. 2016 Nov 3;26(4):375-385.
doi: 10.3233/VES-160587.

Impact of artifacts on VOR gain measures by video-oculography in the acute vestibular syndrome

Affiliations

Impact of artifacts on VOR gain measures by video-oculography in the acute vestibular syndrome

Georgios Mantokoudis et al. J Vestib Res. .

Abstract

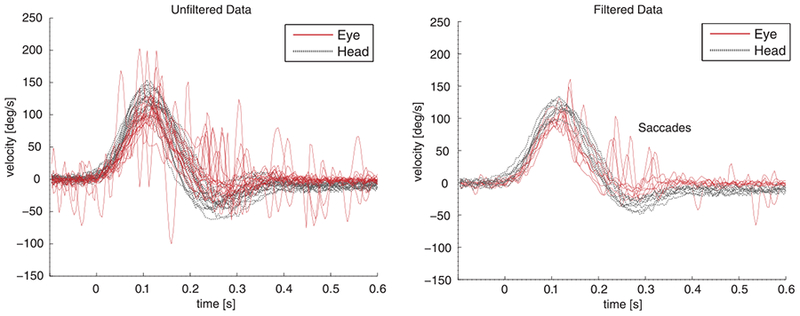
Objective: The video head impulse test (HIT) measures vestibular function (vestibulo-ocular reflex [VOR] gain - ratio of eye to head movement), and, in principle, could be used to make a distinction between central and peripheral causes of vertigo. However, VOG recordings contain artifacts, so using unfiltered device data might bias the final diagnosis, limiting application in frontline healthcare settings such as the emergency department (ED). We sought to assess whether unfiltered data (containing artifacts) from a video-oculography (VOG) device have an impact on VOR gain measures in acute vestibular syndrome (AVS).

Methods: This cross-sectional study compared VOG HIT results 'unfiltered' (standard device output) versus 'filtered' (artifacts manually removed) and relative to a gold standard final diagnosis (neuroimaging plus clinical follow-up) in 23 ED patients with acute dizziness, nystagmus, gait disturbance and head motion intolerance.

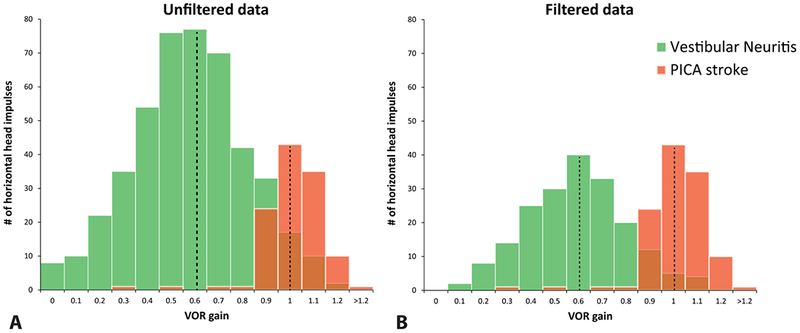
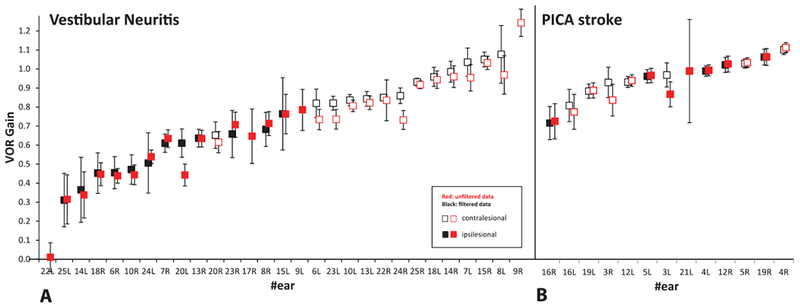
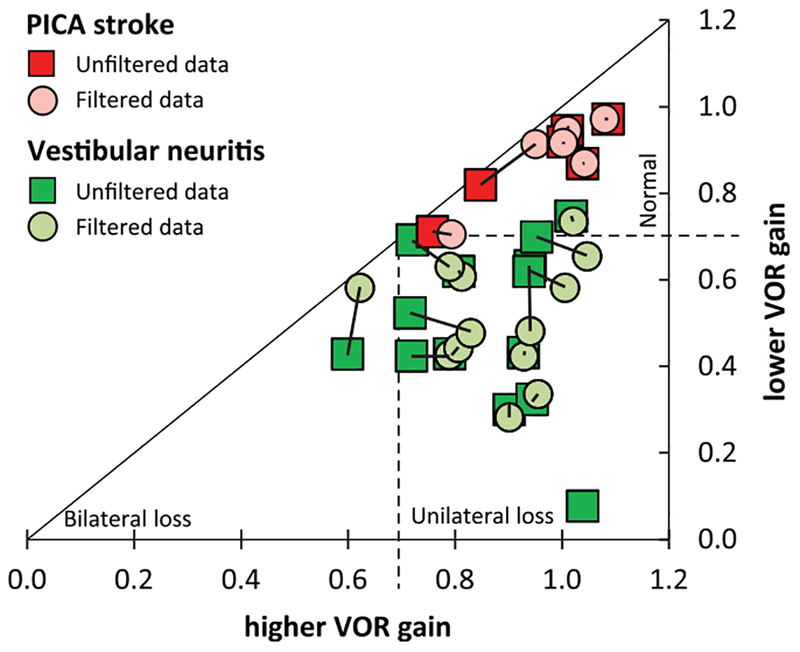
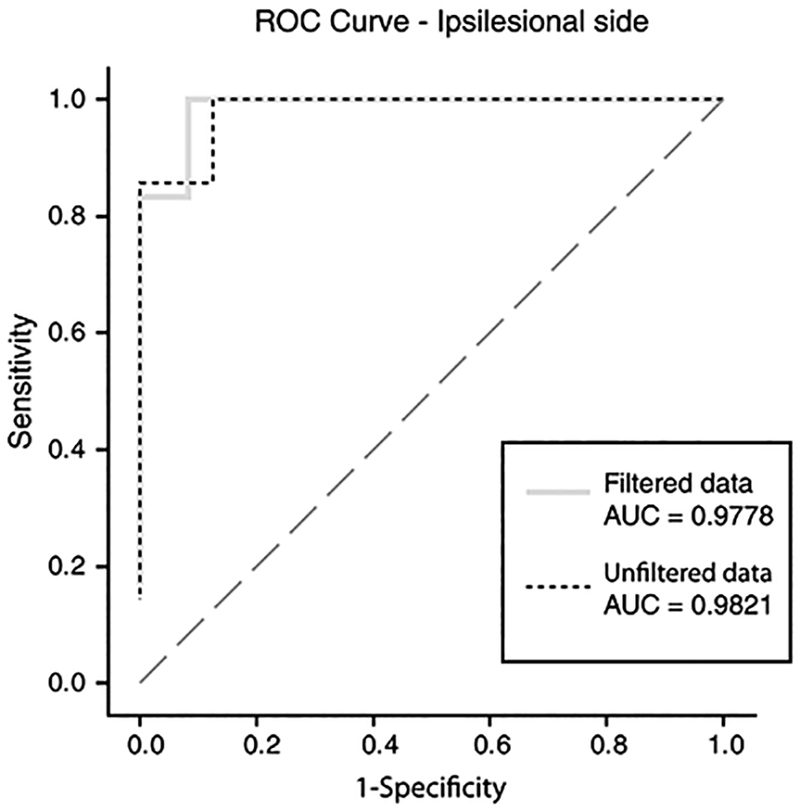
Results: Mean VOR gain assessment alone (unfiltered device data) discriminated posterior inferior cerebellar artery (PICA) strokes from vestibular neuritis with 91% accuracy in AVS. Optimal stroke discrimination cut points were bilateral VOR gain >0.7099 (unfiltered data) versus >0.7041 (filtered data). For PICA stroke sensitivity and specificity, there was no clinically-relevant difference between unfiltered and filtered data-sensitivity for PICA stroke was 100% for both data sets and specificity was almost identical (87.5% unfiltered versus 91.7% filtered). More impulses increased gain precision.

Conclusions: The bedside HIT remains the single best method for discriminating between vestibular neuritis and PICA stroke in patients presenting AVS. Quantitative VOG HIT testing in the ED is associated with frequent artifacts that reduce precision but not accuracy. At least 10-20 properly-performed HIT trials per tested ear are recommended for a precise VOR gain estimate.

Keywords: Eye movement measurements; diagnosis; stroke; vertigo; vestibular neuritis; vestibulo-ocular reflex.


Conflict of interest statement

Potential conflicts of interest

None.

Figures

Fig. 1.
Fig. 1.
Unfiltered vHIT data versus filtered data. Velocity profiles from eye- and head VOG recordings derived from the contralesional (healthy) side in one patient with vestibular neuritis. The left panel shows unfiltered (raw device data, including artifacts) data, and the right panel filtered data (cleaned without artifacts). Both sets of data shown are from the same sequence of HIT trials in a single patient.
Fig. 2.
Fig. 2.
Population histograms depicting disease-specific VOR gain distributions, comparing unfiltered to filtered results. Population histograms of VOR gain values for patients with vestibular neuritis and PICA stroke. Histograms depict ipsilesional gain values for unfiltered vHIT data (A) and filtered vHIT data (B) in 23 patients with AVS. Data are not normalized to adjust for differences in the number of impulses per ear. Unfiltered (A) and filtered data (B) show an approximately normal distribution for each disease-specific population group with identical peaks at 0.6 VOR gain for vestibular neuritis and VOR gain of 1.0 for PICA strokes. Unfiltered data contained more HIT data from the larger neuritis population (A), however, filtering data (B) led to a disproportionally higher data removal from the neuritis group because abnormal HITs (not seen in PICA strokes) contained significantly more artifacts than normal HITs [15].
Fig. 3.
Fig. 3.
Mean VOR gains by ear, comparing unfiltered to filtered results. Ipsi- and contralesional mean VOR gains by ear with 95% confidence interval bars are shown for patients with (A) vestibular neuritis (n =15), and (B) stroke (PICA, n = 7). Data are presented by increasing mean VOR gain values to highlight significant right-left asymmetries in peripheral disease and relative symmetry in PICA strokes. Unfiltered data (with artifacts) are depicted in red color, filtered data in black. VOR gains from five ears show only unfiltered results because there were fewer than five valid impulses (per ear) after filtering.
Fig. 4.
Fig. 4.
Scatterplot of patient-specific VOR gain asymmetries, comparing unfiltered to filtered results. Patient-specific VOR gain asymmetries are shown in a scatterplot, depicting lower VOR mean gain versus higher VOR mean gain for each patient. Only mean VOR gains based on five or more valid trials on both ears are shown (filtered data n =19 [circles] and unfiltered data n = 20 [squares], corresponding data points connected). The triangle is divided into sections by the optimized cutoff of 0.70 for discriminating unilateral vestibular loss (neuritis, bottom-right quadrant), bilateral vestibulopathy (bottom-left corner) and strokes (bilateral normal VOR gain, upper-right corner). Note that strokes cluster in the upper-right corner independent of filtered vs. unfiltered data.
Fig. 5.
Fig. 5.
ROC curves demonstrating sensitivity and specificity for stroke, comparing unfiltered to filtered results. This receiver operating characteristic (ROC) curve analysis plots the diagnostic accuracy (sensitivity and specificity) of quantitative VOG-derived VOR mean gains for identifying PICA stroke in AVS. We used ipsilesional vestibular neuritis and PICA stroke gains for ROC analysis and to determine an optimal VOR gain cut point for discrimination. The diagonal line indicates a hypothetical useless diagnostic test with a likelihood ratio of 1.0 at all diagnostic threshold cut points. The dashed line illustrates the ROC curve derived from unfiltered data from the VOG device, while the grey line shows the ROC curve from filtered data. Total diagnostic accuracy for stroke diagnosis at all thresholds, as measured by the area under the curve (AUC), is effectively identical for unfiltered vs. filtered results.
Fig. 6.
Fig. 6.
Simulated, within subject gain variance (ipsilesional side) by number of anticipated HIT trial observations, comparing unfiltered to filtered results. Simulated, within-subject variance of mean VOR gains is shown on the y-axis, while the number of simulated HIT observations is shown on the x-axis. Filtered data are projected to have lower variance values than unfiltered data regardless of the number of HIT trials performed. Unfiltered data increase their precision substantially from 5 to 10trials, and less beyond 20 trials.

References

    1. Aw ST, Fetter M, Cremer PD, Karlberg M and Halmagyi GM, Individual semicircular canal function in superior and inferior vestibular neuritis, Neurology 57 (2001), 768–774. - PubMed
    1. Beynon GJ, Jani P and Baguley DM, A clinical evaluation of head impulse testing, Clin Otolaryngol Allied Sci 23 (1998), 117–122. - PubMed
    1. Chen L, Lee W, Chambers BR and Dewey HM, Diagnostic accuracy of acute vestibular syndrome at the bedside in a stroke unit, J Neurol 258 (2011), 855–861. - PubMed
    1. Chen L, Todd M, Halmagyi GM and Aw S, Head impulse gain and saccade analysis in pontine-cerebellar stroke and vestibular neuritis, Neurology 83 (2014), 1513–1522. - PMC - PubMed
    1. Cnyrim CD, Newman-Toker D, Karch C, Brandt T and Strupp M, Bedside differentiation of vestibular neuritis from central vestibular pseudoneuritis, J Neurol Neurosurg Psychiatry 79 (2008), 458–460. - PubMed

Publication types

MeSH terms

LinkOut - more resources