. 2016 Nov 4;12(11):e1005177.
doi: 10.1371/journal.pcbi.1005177. eCollection 2016 Nov.

Deep Learning Automates the Quantitative Analysis of Individual Cells in Live-Cell Imaging Experiments

Affiliations

Deep Learning Automates the Quantitative Analysis of Individual Cells in Live-Cell Imaging Experiments

David A Van Valen et al. PLoS Comput Biol. .

Abstract

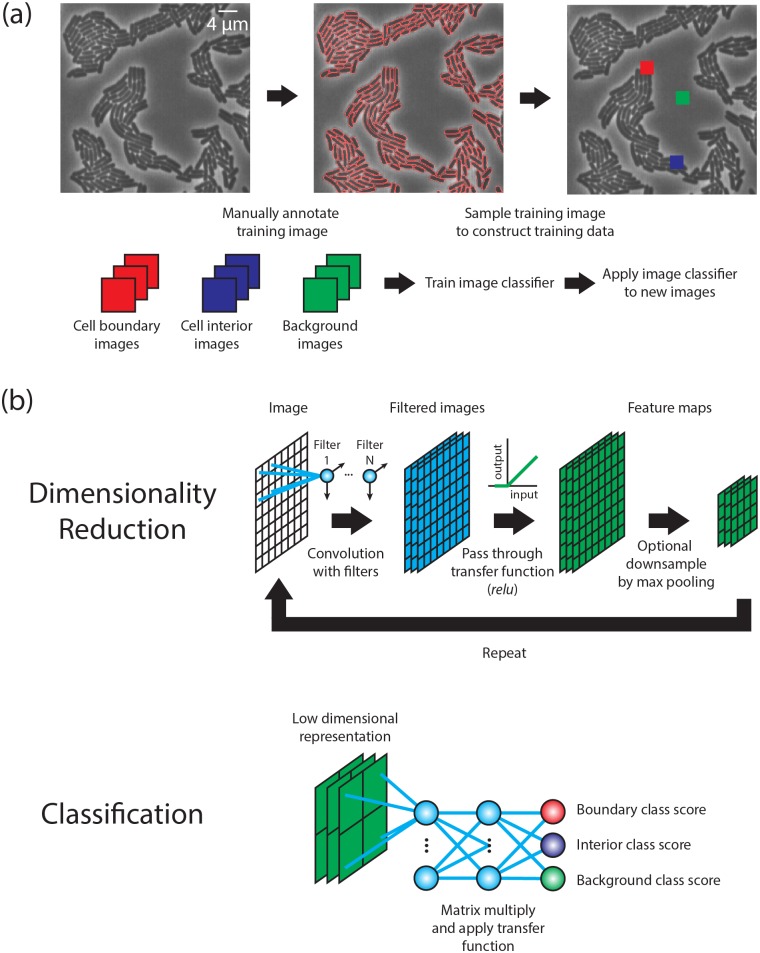
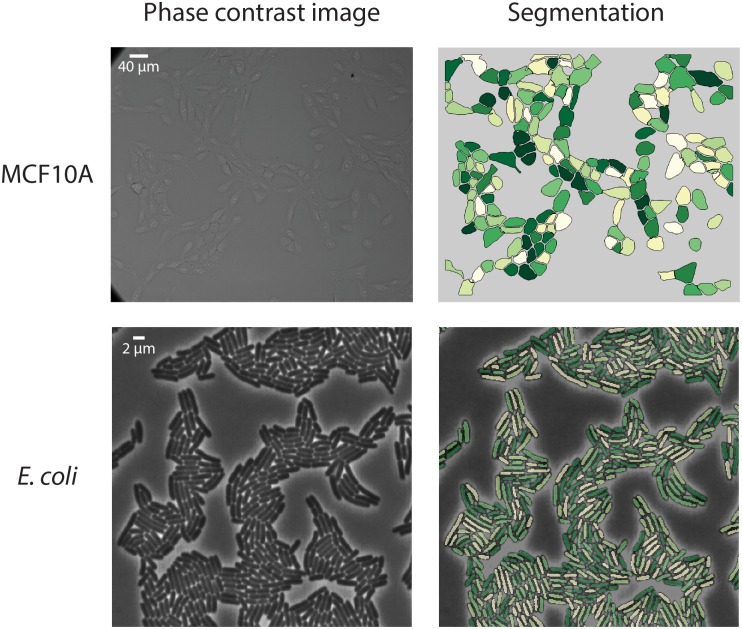
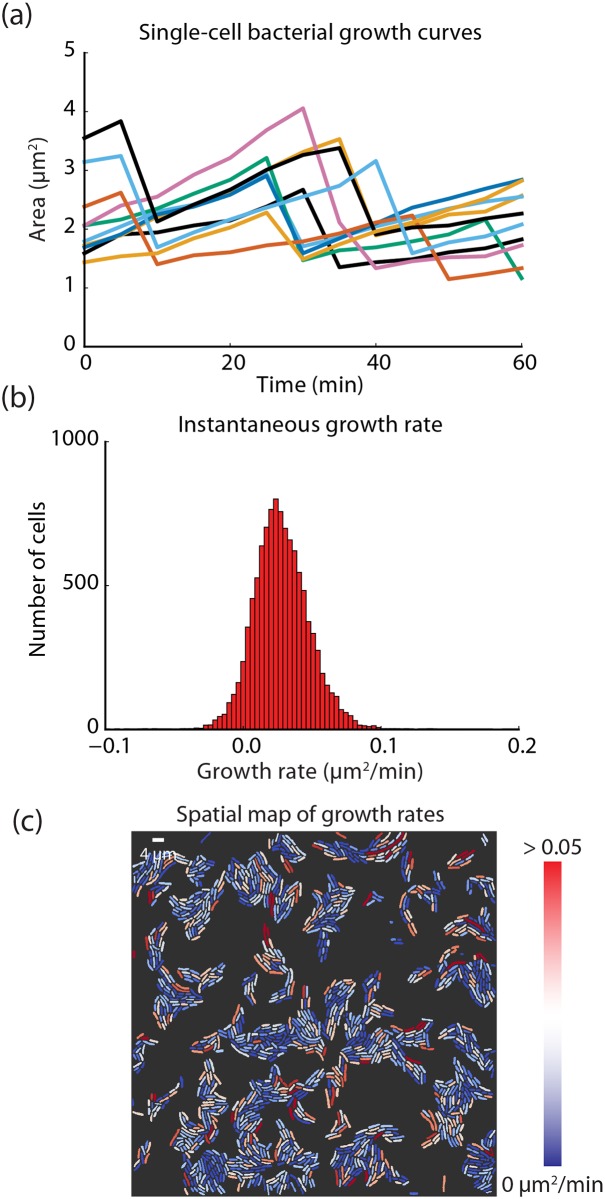
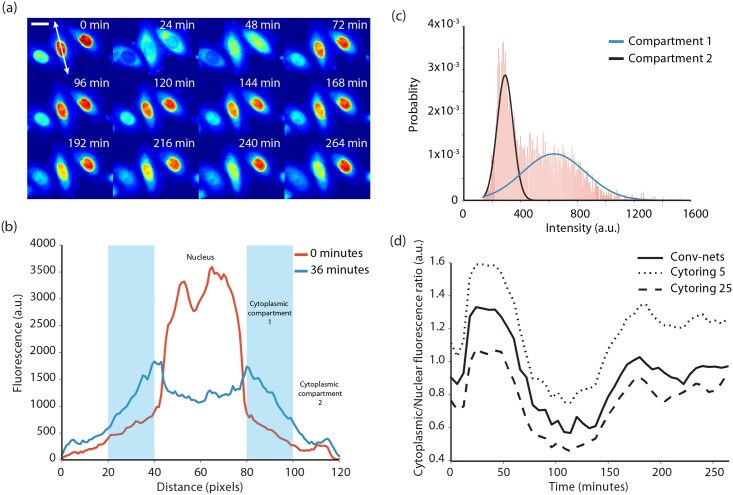
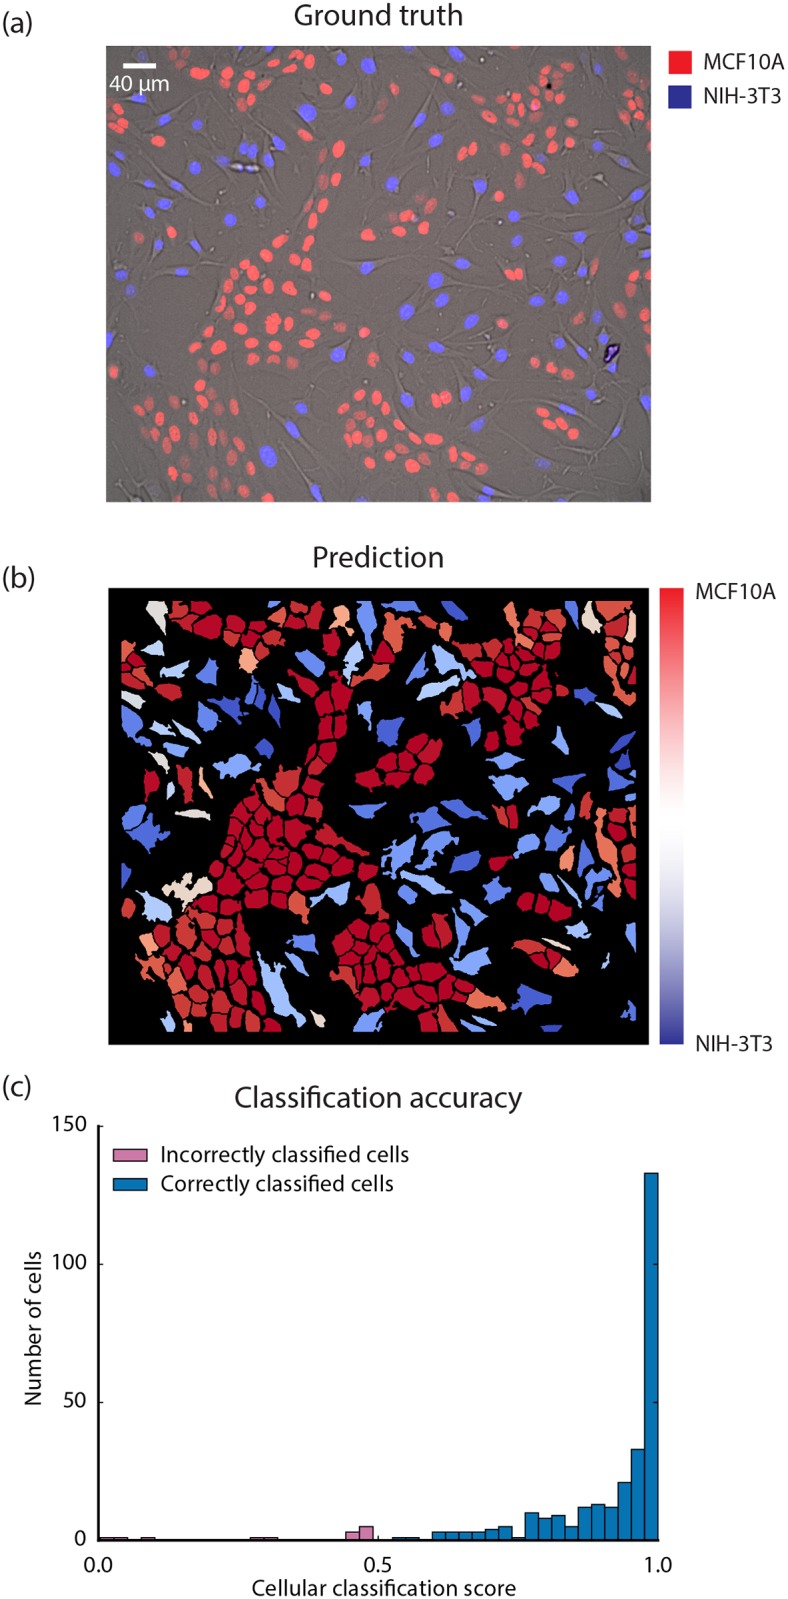
Live-cell imaging has opened an exciting window into the role cellular heterogeneity plays in dynamic, living systems. A major critical challenge for this class of experiments is the problem of image segmentation, or determining which parts of a microscope image correspond to which individual cells. Current approaches require many hours of manual curation and depend on approaches that are difficult to share between labs. They are also unable to robustly segment the cytoplasms of mammalian cells. Here, we show that deep convolutional neural networks, a supervised machine learning method, can solve this challenge for multiple cell types across the domains of life. We demonstrate that this approach can robustly segment fluorescent images of cell nuclei as well as phase images of the cytoplasms of individual bacterial and mammalian cells from phase contrast images without the need for a fluorescent cytoplasmic marker. These networks also enable the simultaneous segmentation and identification of different mammalian cell types grown in co-culture. A quantitative comparison with prior methods demonstrates that convolutional neural networks have improved accuracy and lead to a significant reduction in curation time. We relay our experience in designing and optimizing deep convolutional neural networks for this task and outline several design rules that we found led to robust performance. We conclude that deep convolutional neural networks are an accurate method that require less curation time, are generalizable to a multiplicity of cell types, from bacteria to mammalian cells, and expand live-cell imaging capabilities to include multi-cell type systems.


Conflict of interest statement

The authors have declared that no competing interests exist.

Figures

Fig 1
Fig 1. Performing image segmentation with deep convolutional neural networks.
(a) Image segmentation can be recast as an image classification task that is amenable to a supervised machine learning approach. A manually annotated image is converted into a training dataset by sampling regions around boundary, interior, and background pixels. These sample images are then used to train an image classifier that can then be applied to new images. (b) The mathematical structure of a conv-net. A conv-net can be broken down into two components. The first component is dimensionality reduction through the iterative application of three operations—convolutions, a transfer function, and down sampling. The second component is a classifier that uses the representation and outputs scores for each class.
Fig 2
Fig 2. Sample images from live-cell experiments that were segmented using conv-nets.
Images of bacterial and mammalian cells were segmented using trained conv-nets and additional downstream processing. Thresholding for bacterial cells and an active contour based approach for mammalian cells were used to convert the conv-net prediction into a segmentation mask.
Fig 3
Fig 3. Extracting dynamic measurements of live-cell imaging experiments using conv-nets.
(a) Single-cell growth curves for E. coli. Because conv-nets allow for the robust segmentation of bacterial cells, we can construct single-cell growth curves from movies of growing bacterial micro-colonies. A linear assignment problem based method was used for lineage construction. (b) By computing the change in area from frame to frame for each cell, we can construct a histogram of the instantaneous growth rate. (c) Using the instantaneous growth rate and the segmentation masks, we can construct a spatial map of growth rates with single-cell resolution. Such a map allows rapid identification of slowly dividing cells (such as metabolically inactive cells).
Fig 4
Fig 4. Analysis of JNK-KTR dynamics in single cells.
(a) A montage of HeLa-S3 cells expressing a JNK-KTR after stimulation with TNF-α. The scale bar is 20 μm. (b) A line profile of the fluorescence of the cell highlighted in (a) which demonstrates that there is considerable spatial heterogeneity of the fluorescence in the cytoplasm. We model the cytoplasm as having two compartments, only one of which receives fluorescence from the nucleus during translocation. (c) A fit of a two component Gaussian mixture model to the cytoplasmic fluorescence of a HeLa-S3 cell. This method allows us to accurately estimate the fluorescence inside the cytoplasmic compartment that communicates with the nucleus. (d) Dynamics of the JNK-KTR after stimulation with TNF-α after segmentation with our conv-net based approach and quantification with the two component Gaussian mixture model. Plotted in comparison are dynamics obtained from using cytorings with radii of 5 pixels and 25 pixels.
Fig 5
Fig 5. Semantic segmentation of a co-culture with MCF10A and NIH-3T3 cells.
A conv-net was trained to both segment and recognize NIH-3T3 and MCF10A cells. The training data was created from separate images of NIH-3T3 and MCF10A cells with each image having a nuclear marker (Hoechst 33342) as a separate channel. (a) A ground truth image of a co-culture containing NIH-3T3 and MCF10A cells. The NIH-3T3 cells express a mCerulean nuclear marker (blue) while the MCF10A cells express an iRFP nuclear marker (red). Hoechst 33342 (image not shown) was also used to generate an image of a nuclear marker. (b) Simultaneous image segmentation and cell-type classification of the image in (a) using a trained conv-net. (c) Classification accuracy for the trained conv-net’s cellular level cell type prediction. The cellular classification score of the correct cell type for each cell is plotted as a histogram. The size of the cellular classification score is strongly associated with making a correct prediction. A classification accuracy of 86% was achieved for NIH-3T3 cells and 100% for MCF10A cells.

References

    1. Rosenfeld N, Young JW, Alon U, Swain PS, Elowitz MB. Gene regulation at the single-cell level. Science. 2005;307(5717):1962–5. 10.1126/science.1106914 - DOI - PubMed
    1. Weinert FM, Brewster RC, Rydenfelt M, Phillips R, Kegel WK. Scaling of gene expression with transcription-factor fugacity. Physical review letters. 2014;113(25):258101 10.1103/PhysRevLett.113.258101 - DOI - PMC - PubMed
    1. Selimkhanov J, Taylor B, Yao J, Pilko A, Albeck J, Hoffmann A, et al. Accurate information transmission through dynamic biochemical signaling networks. Science. 2014;346(6215):1370–3. 10.1126/science.1254933 - DOI - PMC - PubMed
    1. Tay S, Hughey JJ, Lee TK, Lipniacki T, Quake SR, Covert MW. Single-cell NF-[kgr] B dynamics reveal digital activation and analogue information processing. Nature. 2010;466(7303):267–71. 10.1038/nature09145 - DOI - PMC - PubMed
    1. Lee TK, Denny EM, Sanghvi JC, Gaston JE, Maynard ND, Hughey JJ, et al. A noisy paracrine signal determines the cellular NF-κB response to lipopolysaccharide. Science signaling. 2009;2(93):ra65 10.1126/scisignal.2000599 - DOI - PMC - PubMed

MeSH terms