

From Proteomic Analysis to Potential Therapeutic Targets: Functional Profile of Two Lung Cancer Cell Lines, A549 and SW900, Widely Studied in Pre-Clinical Research
- PMID: 27814385
- PMCID: PMC5096714
- DOI: 10.1371/journal.pone.0165973
From Proteomic Analysis to Potential Therapeutic Targets: Functional Profile of Two Lung Cancer Cell Lines, A549 and SW900, Widely Studied in Pre-Clinical Research
Abstract
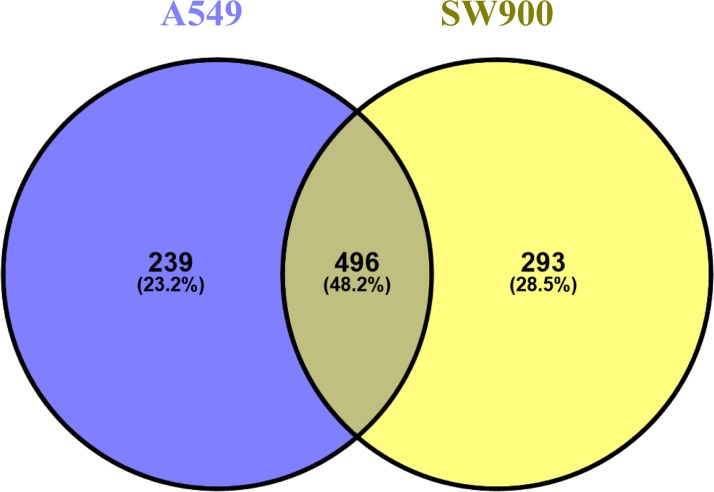
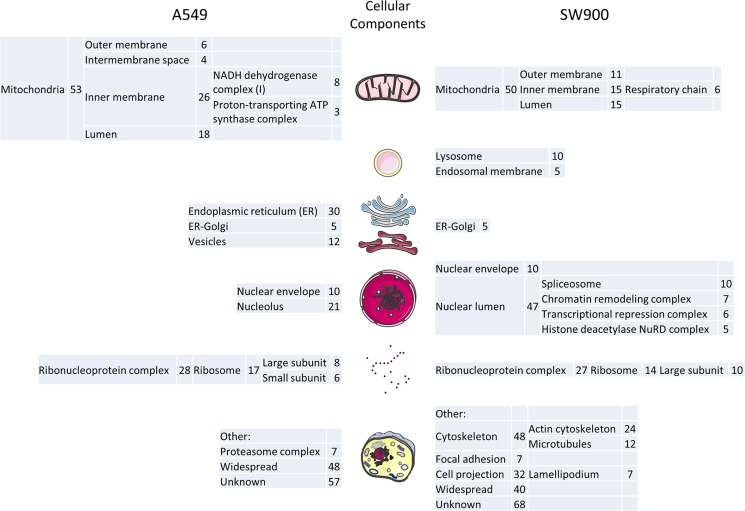
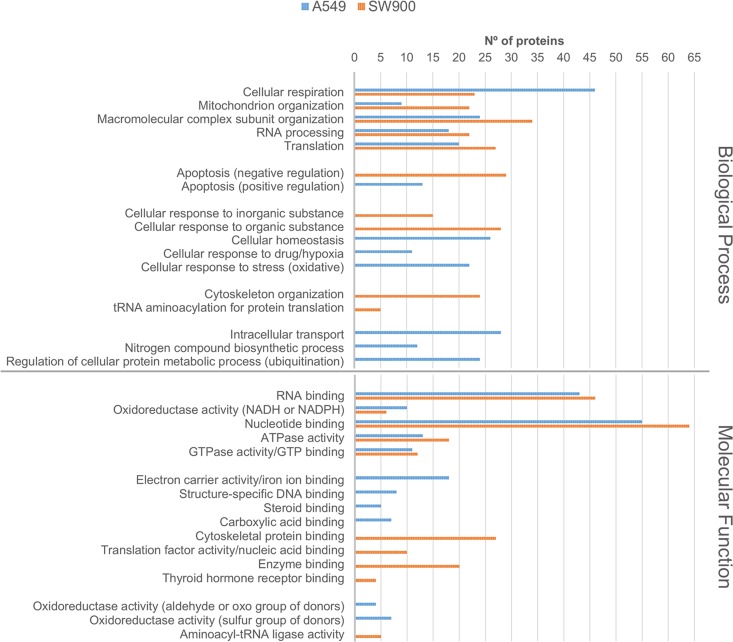
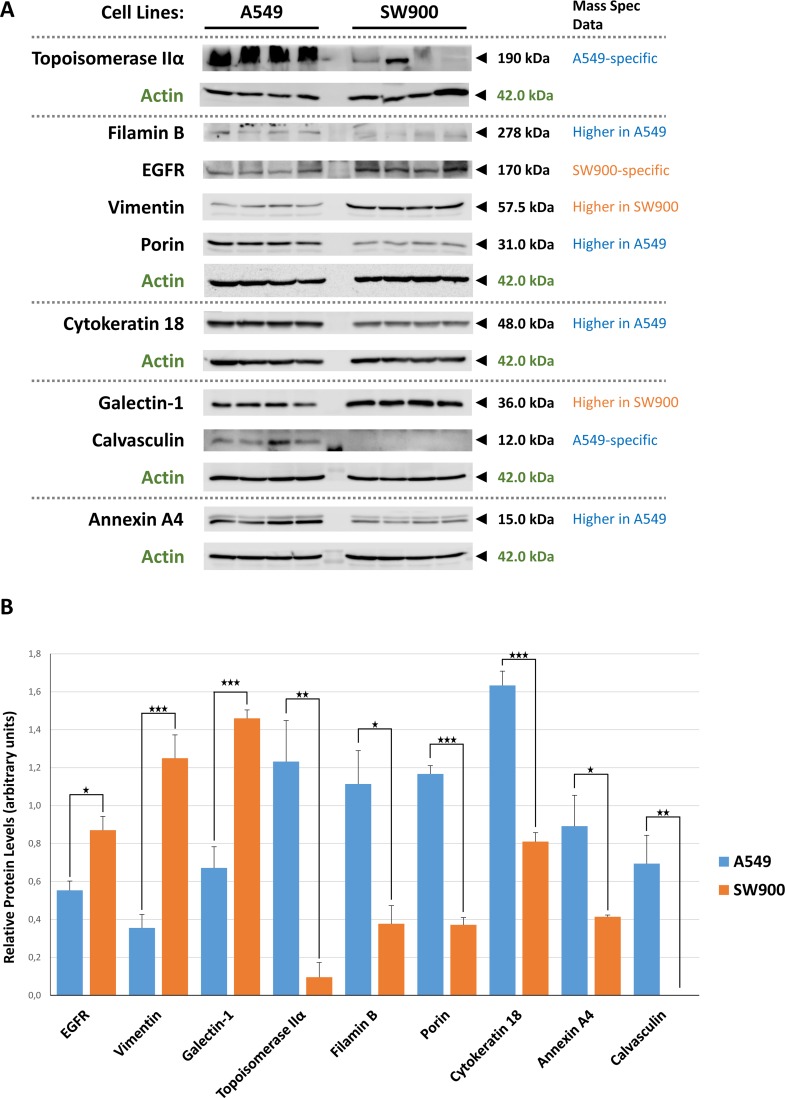
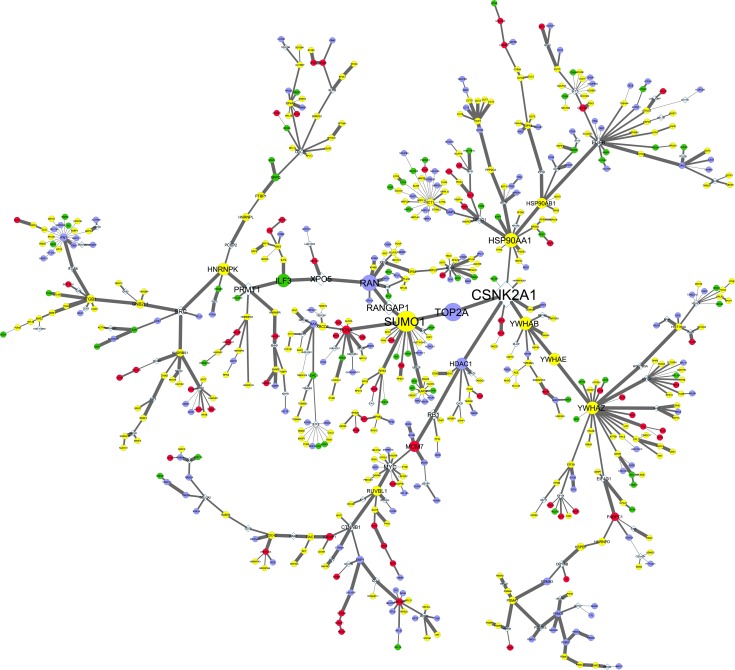
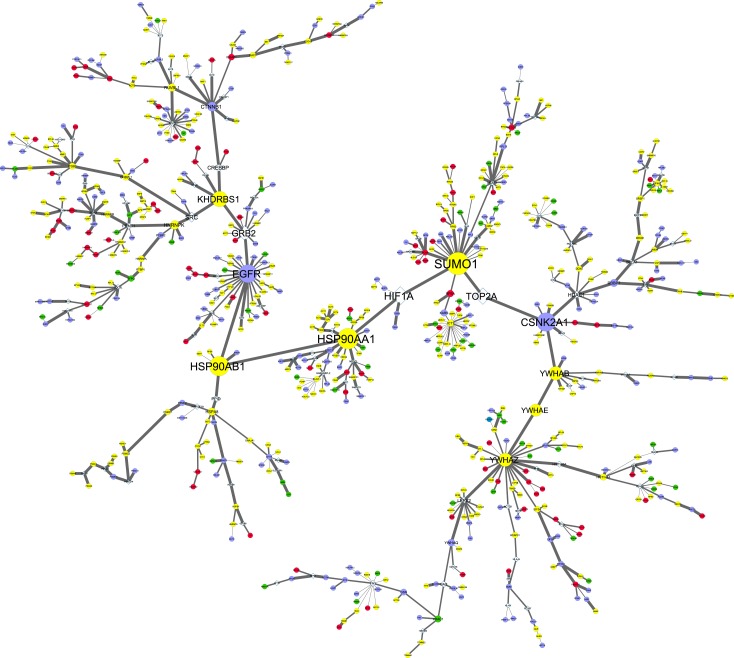
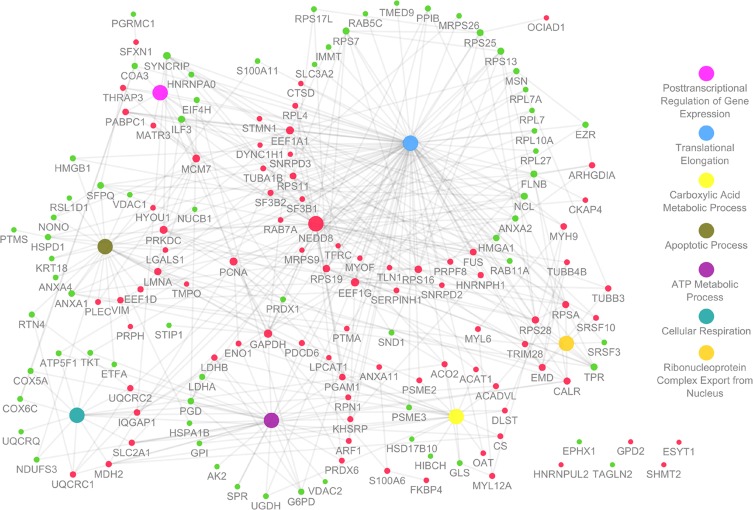
Lung cancer is a serious health problem and the leading cause of cancer death worldwide. The standard use of cell lines as in vitro pre-clinical models to study the molecular mechanisms that drive tumorigenesis and access drug sensitivity/effectiveness is of undisputable importance. Label-free mass spectrometry and bioinformatics were employed to study the proteomic profiles of two representative lung cancer cell lines and to unravel the specific biological processes. Adenocarcinoma A549 cells were enriched in proteins related to cellular respiration, ubiquitination, apoptosis and response to drug/hypoxia/oxidative stress. In turn, squamous carcinoma SW900 cells were enriched in proteins related to translation, apoptosis, response to inorganic/organic substances and cytoskeleton organization. Several proteins with differential expression were related to cancer transformation, tumor resistance, proliferation, migration, invasion and metastasis. Combined analysis of proteome and interactome data highlighted key proteins and suggested that adenocarcinoma might be more prone to PI3K/Akt/mTOR and topoisomerase IIα inhibitors, and squamous carcinoma to Ck2 inhibitors. Moreover, ILF3 overexpression in adenocarcinoma, and PCNA and NEDD8 in squamous carcinoma shows them as promising candidates for therapeutic purposes. This study highlights the functional proteomic differences of two main subtypes of lung cancer models and hints several targeted therapies that might assist in this type of cancer.
Conflict of interest statement
The authors have declared that no competing interests exist.
Figures
Similar articles
-
Piperlongumine induces apoptosis and autophagy in human lung cancer cells through inhibition of PI3K/Akt/mTOR pathway.Int J Immunopathol Pharmacol. 2015 Sep;28(3):362-73. doi: 10.1177/0394632015598849. Epub 2015 Aug 5. Int J Immunopathol Pharmacol. 2015. PMID: 26246196
-
MiR-206 inhibits HGF-induced epithelial-mesenchymal transition and angiogenesis in non-small cell lung cancer via c-Met /PI3k/Akt/mTOR pathway.Oncotarget. 2016 Apr 5;7(14):18247-61. doi: 10.18632/oncotarget.7570. Oncotarget. 2016. PMID: 26919096 Free PMC article.
-
Baicalein increases cisplatin sensitivity of A549 lung adenocarcinoma cells via PI3K/Akt/NF-κB pathway.Biomed Pharmacother. 2017 Jun;90:677-685. doi: 10.1016/j.biopha.2017.04.001. Epub 2017 Apr 14. Biomed Pharmacother. 2017. PMID: 28415048 Review.
-
ITRAQ-Based Proteomics Analysis of Triptolide On Human A549 Lung Adenocarcinoma Cells.Cell Physiol Biochem. 2018;45(3):917-934. doi: 10.1159/000487286. Epub 2018 Feb 2. Cell Physiol Biochem. 2018. PMID: 29428961
-
Targeting the phosphatidylinositol 3-kinase (PI3K)/AKT/mammalian target of rapamycin (mTOR) pathway: an emerging treatment strategy for squamous cell lung carcinoma.Cancer Treat Rev. 2014 Sep;40(8):980-9. doi: 10.1016/j.ctrv.2014.06.006. Epub 2014 Jul 3. Cancer Treat Rev. 2014. PMID: 25037117 Review.
Cited by
-
Targeting neddylation as a novel approach to lung cancer treatment (Review).Int J Oncol. 2023 May;62(5):65. doi: 10.3892/ijo.2023.5513. Epub 2023 Apr 21. Int J Oncol. 2023. PMID: 37083098 Free PMC article. Review.
-
Polyherbal Formulation as a Therapeutic Strategy for Lung Cancer: Phytochemical Profiling, Molecular Docking, and Pharmacological Evaluation.Asian Pac J Cancer Prev. 2025 May 1;26(5):1841-1852. doi: 10.31557/APJCP.2025.26.5.1841. Asian Pac J Cancer Prev. 2025. PMID: 40439398 Free PMC article.
-
Cryptotanshinone inhibits lung cancer invasion via microRNA-133a/matrix metalloproteinase 14 regulation.Oncol Lett. 2019 Sep;18(3):2554-2559. doi: 10.3892/ol.2019.10580. Epub 2019 Jul 5. Oncol Lett. 2019. PMID: 31452742 Free PMC article.
-
Anticancer, antioxidant, and antibacterial effects of nanoemulsion of Origanum majorana essential oil.Iran J Microbiol. 2023 Aug;15(4):565-573. doi: 10.18502/ijm.v15i4.13511. Iran J Microbiol. 2023. PMID: 38045710 Free PMC article.
-
Radio-resistance of hypoxic tumors: exploring the effects of oxygen and x-ray radiation on non-small lung cancer cell lines.Radiat Oncol. 2023 May 12;18(1):81. doi: 10.1186/s13014-023-02275-8. Radiat Oncol. 2023. PMID: 37173741 Free PMC article.
References
MeSH terms
Substances
LinkOut - more resources
Full Text Sources
Other Literature Sources
Medical
Miscellaneous
