. 2016 Nov 3;167(4):1111-1124.e13.
doi: 10.1016/j.cell.2016.10.018.

Host and Environmental Factors Influencing Individual Human Cytokine Responses

Affiliations

Host and Environmental Factors Influencing Individual Human Cytokine Responses

Rob Ter Horst et al. Cell. .

Abstract

Differences in susceptibility to immune-mediated diseases are determined by variability in immune responses. In three studies within the Human Functional Genomics Project, we assessed the effect of environmental and non-genetic host factors of the genetic make-up of the host and of the intestinal microbiome on the cytokine responses in humans. We analyzed the association of these factors with circulating mediators and with six cytokines after stimulation with 19 bacterial, fungal, viral, and non-microbial metabolic stimuli in 534 healthy subjects. In this first study, we show a strong impact of non-genetic host factors (e.g., age and gender) on cytokine production and circulating mediators. Additionally, annual seasonality is found to be an important environmental factor influencing cytokine production. Alpha-1-antitrypsin concentrations partially mediate the seasonality of cytokine responses, whereas the effect of vitamin D levels is limited. The complete dataset has been made publicly available as a comprehensive resource for future studies. PAPERCLIP.

Keywords: age; alpha-1-antitrypsin; cytokines; environment; gender; genetics; host; microbiome; season; vitamin D.


Figures

Figure 1
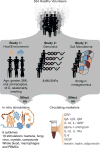
Figure 1. Schematic overview of the three studies on the 500FG cohort
The cohort consists of 534 volunteers with varying characteristics. The current manuscript is the first in a series of three studies presented in this issue of Cell, that aim to provide a systematic assessment of the impact of various intrinsic and environmental factors (this manuscript), the host genome (Li et al., 2016), and the gut microbiome (Schirmer et al., 2016), on cytokine production and baseline immune parameters in a systems biology-based approach. See also Table S1, S2 and Figure S1.
Figure 2
Figure 2. Schematic depiction of the study parameters
(A) Stimuli and measurements in this study. (B–E) Different factors studied in our cohort. The blue dots in E are the individual vitamin-D measurements and the red line is the LOESS fit through these points. See also Table S1, S2 and Figure S1.
Figure 3
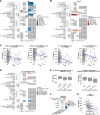
Figure 3. Correlations of circulating mediators with non-genetic host characteristics
(A) P-values (FDR corrected) of the correlations of mediators with each other. For color codes of the FDR, see legend. (B) Scatterplots of highly signficant correlations from A. (C) Significance of the relation between host characeristics/environmental factors (x-axis) to circulating mediators and immunoglobulins (y-axis). (D) Scatterplots showing the effect of age, gender, oral contraceptive and BMI. The lines indicate the Local Regression (LOESS) fit. See also Figure S2 and Table S3.
Figure 4
Figure 4. Relation of age, gender and oral contraceptive usage to cytokine production
(A) significance of age in relation to different cytokines (x-axis) induced by different stimuli (y-axis). The darker the color, the greater the significance, where an decrease with age is blue and an increase is red (see Figure legend). (B) Similar plot to figure 3A for gender. Red indicates a stronger response in men, whereas blue indicates a stronger response in women. (C) Specific correlations of age to IFNγ and IL-22 production with different stimuli (the lines indicate the LOESS fit). (D) Similar to Figure 4A and 3B, the effect of “oral contraceptive usage”, where red indicates an increase with usage of oral contraceptives and blue a decrease. (E) Box plot visualisation of cytokine production with gender/oral contraceptive usage. (F) Correlations between progesterone/testosterone levels and cytokine/IgA levels for men and women. Tests were performed for all immunological responses showing a significant relation to gender. Only the resulting significant correlations are shown in this plot. (G) Scatterplot of the relation between leptin and testosterone in men, where the lines indicate the LOESS fit. See also Figure S2, S3 and Table S1, S3.
Figure 5
Figure 5. Seasonal changes in cytokine levels
(A) Heatmap showing the cytokines having seasonal responses. Three letter abbreviation indicate the month at which the production of the cytokine (x-axis) is highest. A few stimulus-cytokine combinations were excluded (see legend), because the time profile showed clear storage degradation effects which interfere with the seasonality analysis. (B) Effects of vitamin D levels shown in a heatmap to Figure 3A, red indicates a positive relation. (C) Heatmap showing the signifiance of the seasonality of the circulating cytokines. (D) Examples of some of the seasonal responses, where each blue dot is an individual measurement and the red line depicts LOESS. See also Figure S2, S3 and S4 and Table S3, S4, S5, S6 and S7.
Figure 6
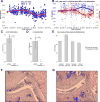
Figure 6. AAT effects on IL-1b production and gout prevalence
(A) Scatterplot ot the seasonal response of AAT, showing a decrease in summer. The line indicate the LOESS fit. (B) Combined plots of AAT and IL-1b after influenza stimulation, showing their opposite seasonal periodicity. (C) Bar plots showing decreased joint inflammation in mice injected with uric acid crystals after being injected AAT. Data are represented as mean +/− SEM. (D) Bar plots showing decreased IL-1β production in mice injected with uric acid crystals after being injected AAT. Data are represented as mean +/− SEM. (E) Number of patients presenting with gout at a primary physician in the Netherlands (n~800), with a clear increase in spring/summer. (F,G) Histopathology of an inflamed knee joint of an vehicle (BSA, 100μg/kg)-treated mouse, 4h after induction of gouty arthritis induced by intra-articular injection of MSU/C16.0 (300μg/200mM). Note the severe infiltration of cells in the joint cavity (F). Human plasma derived AAT (Prolastin C, 10μg/kg) treated mouse, showing decreased inflammation (G). H&E staining, original magnification 200x. See also Figure S5 and Table S5, S6 and S7.

Comment in

References

    1. Aguirre-Gamboa R, Joosten I, PCM U, van der Molen RG, van Rijssen E, van Cranenbroek B, Oosting M, Smeekens SP, Jaeger M, Zorro M, et al. Differential effects of environmental and genetic factors on T and B cell immune traits. Cell Reports 2016 - PMC - PubMed
    1. Anderson P. Post-transcriptional control of cytokine production. Nat Immunol. 2008;9:353–359. - PubMed
    1. Aulock SV, Deininger S, Draing C, Gueinzius K, Dehus O, Hermann C. Gender difference in cytokine secretion on immune stimulation with LPS and LTA. Journal of interferon & cytokine research: the official journal of the International Society for Interferon and Cytokine Research. 2006;26:887–892. - PubMed
    1. Baylis D, Bartlett DB, Patel HP, Roberts HC. Understanding how we age: insights into inflammaging. Longevity & healthspan. 2013;2:8. - PMC - PubMed
    1. Behre HM, Simoni M, Nieschlag E. Strong association between serum levels of leptin and testosterone in men. Clinical endocrinology. 1997;47:237–240. - PubMed

Publication types

MeSH terms