

Mergeomics: multidimensional data integration to identify pathogenic perturbations to biological systems
- PMID: 27814671
- PMCID: PMC5097440
- DOI: 10.1186/s12864-016-3198-9
Mergeomics: multidimensional data integration to identify pathogenic perturbations to biological systems
Abstract
Background: Complex diseases are characterized by multiple subtle perturbations to biological processes. New omics platforms can detect these perturbations, but translating the diverse molecular and statistical information into testable mechanistic hypotheses is challenging. Therefore, we set out to create a public tool that integrates these data across multiple datasets, platforms, study designs and species in order to detect the most promising targets for further mechanistic studies.
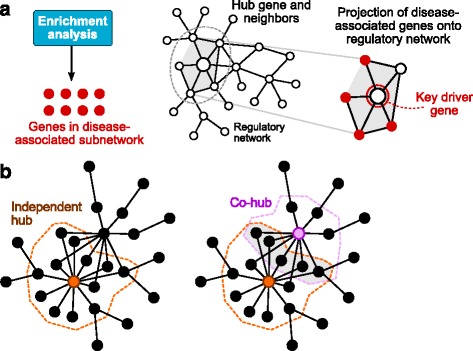
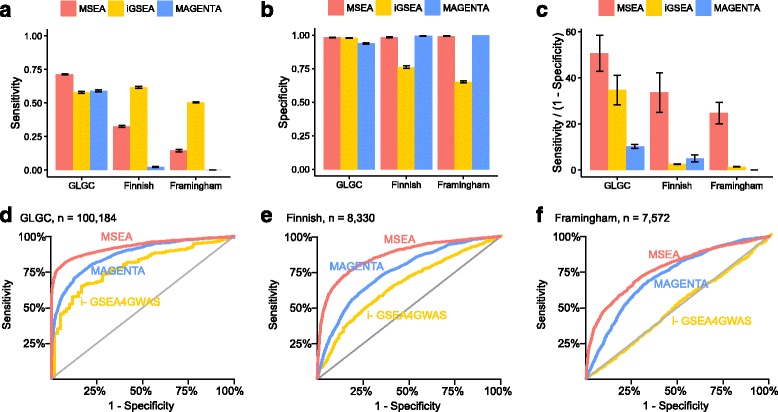
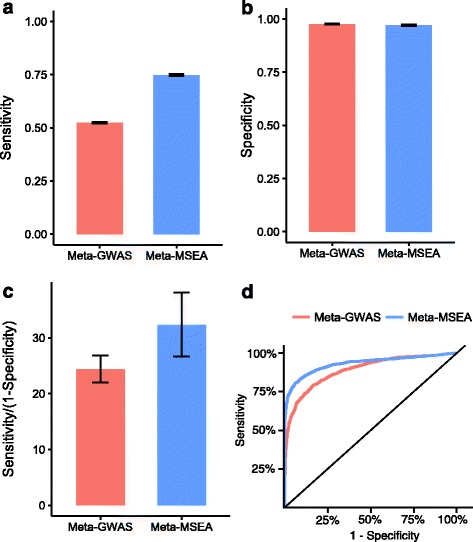
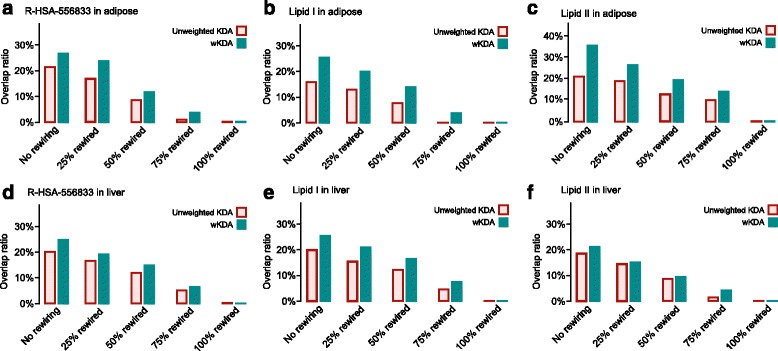
Results: We developed Mergeomics, a computational pipeline consisting of independent modules that 1) leverage multi-omics association data to identify biological processes that are perturbed in disease, and 2) overlay the disease-associated processes onto molecular interaction networks to pinpoint hubs as potential key regulators. Unlike existing tools that are mostly dedicated to specific data type or settings, the Mergeomics pipeline accepts and integrates datasets across platforms, data types and species. We optimized and evaluated the performance of Mergeomics using simulation and multiple independent datasets, and benchmarked the results against alternative methods. We also demonstrate the versatility of Mergeomics in two case studies that include genome-wide, epigenome-wide and transcriptome-wide datasets from human and mouse studies of total cholesterol and fasting glucose. In both cases, the Mergeomics pipeline provided statistical and contextual evidence to prioritize further investigations in the wet lab. The software implementation of Mergeomics is freely available as a Bioconductor R package.
Conclusion: Mergeomics is a flexible and robust computational pipeline for multidimensional data integration. It outperforms existing tools, and is easily applicable to datasets from different studies, species and omics data types for the study of complex traits.
Keywords: Blood glucose; Cholesterol; Functional genomics; Gene networks; Integrative genomics; Key drivers; Mergeomics; Multidimensional data integration.
Figures

References
-
- Parkinson H, Kapushesky M, Shojatalab M, Abeygunawardena N, Coulson R, Farne A, Holloway E, Kolesnykov N, Lilja P, Lukk M, et al. ArrayExpress--a public database of microarray experiments and gene expression profiles. Nucleic Acids Res. 2007;35(Database issue):D747–D750. doi: 10.1093/nar/gkl995. - DOI - PMC - PubMed
-
- Consortium EP, Birney E, Stamatoyannopoulos JA, Dutta A, Guigo R, Gingeras TR, Margulies EH, Weng Z, Snyder M, Dermitzakis ET, et al. Identification and analysis of functional elements in 1% of the human genome by the ENCODE pilot project. Nature. 2007;447(7146):799–816. doi: 10.1038/nature05874. - DOI - PMC - PubMed
Publication types
MeSH terms
Substances
Grants and funding
LinkOut - more resources
Full Text Sources
Other Literature Sources
Molecular Biology Databases
Miscellaneous
