. 2016 Dec 22;128(25):2931-2940.
doi: 10.1182/blood-2016-04-712562. Epub 2016 Nov 4.

High-level ROR1 associates with accelerated disease progression in chronic lymphocytic leukemia

Affiliations

High-level ROR1 associates with accelerated disease progression in chronic lymphocytic leukemia

Bing Cui et al. Blood. .

Abstract

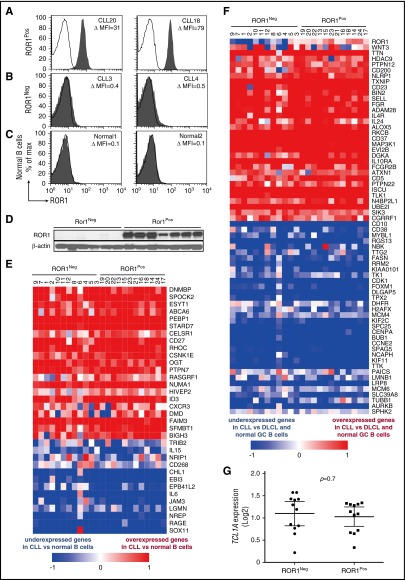
ROR1 is an oncoembryonic orphan receptor found on chronic lymphocytic leukemia (CLL) B cells, but not on normal postpartum tissues. ROR1 is a receptor for Wnt5a that may complex with TCL1, a coactivator of AKT that is able to promote development of CLL. We found the CLL cells of a few patients expressed negligible ROR1 (ROR1Neg), but expressed TCL1A at levels comparable to those of samples that expressed ROR1 (ROR1Pos). Transcriptome analyses revealed that ROR1Neg cases generally could be distinguished from those that were ROR1Pos in unsupervised gene-expression clustering analysis. Gene-set enrichment analyses demonstrated that ROR1Neg CLL had lower expression and activation of AKT signaling pathways relative to ROR1Pos CLL, similar to what was noted for leukemia that respectively developed in TCL1 vs ROR1xTCL1 transgenic mice. In contrast to its effect on ROR1Pos CLL, Wnt5a did not enhance the proliferation, chemotaxis, or survival of ROR1Neg CLL. We examined the CLL cells from 1568 patients, which we randomly assigned to a training or validation set of 797 or 771 cases, respectively. Using recursive partitioning, we defined a threshold for ROR1 surface expression that could segregate samples of the training set into ROR1-Hi vs ROR1-Lo subgroups that differed significantly in their median treatment-free survival (TFS). Using this threshold, we found that ROR1-Hi cases had a significantly shorter median TFS and overall survival than ROR1-Lo cases in the validation set. These data demonstrate that expression of ROR1 may promote leukemia-cell activation and survival and enhance disease progression in patients with CLL.


Figures

Figure 1.
Figure 1.
Expression of CLL signature genes by ROR1Negor ROR1PosCLL cells. Representative histograms depicting the fluorescence of CD19+ cells labeled with Alexa-647–conjugated 4A5 (anti-ROR1 mAb) (shaded histograms) or Alexa-647-conjugated nonspecific immunoglobulin G (IgG) of the same isotype (open histograms) for (A) ROR1Pos CLL B cells, (B) ROR1Neg CLL cells, or (C) representative normal blood B cells. The case identifier and the ROR1 ΔMFI are indicated at the top right corner of each panel. (D) Immunoblot analyses of whole cell lysates of ROR1Neg CLL or ROR1Pos CLL, as indicated at the top. Each lane represents a separate case. The membranes were probed with mAbs specific for ROR1 (top row) or β-actin (bottom row), as indicated on the left. (E-F) Each column represents a separate case of ROR1Neg or ROR1Pos CLL, as indicated at the top. The relative expression of the genes indicated on the right margin are provided in rows, using the color coding for log2 normalized effective count z scores as per the scale provided at the bottom of each heat map. (E) Heat map for 34 genes previously found expressed differentially by CLL cells vs normal B cells. (F) Heat map for 65 genes previously found expressed differentially by CLL cells vs diffuse large cell lymphoma (DLCL) cells or normal germinal center (GC) B cells. (G) Relative amount of TCL1A transcripts found in ROR1Neg or ROR1Pos CLL cases, as indicated at the bottom of the graph. Each dot represents the relative TCL1A of a separate case. The large horizontal bar indicates the mean level of TCL1A transcripts, and the 2 smaller horizontal bars show the 95% confidence interval.
Figure 2.
Figure 2.
Differentially expressed genes and subnetworks in ROR1Posvs ROR1NegCLL cells. (A) Unsupervised clustering of ROR1Pos (n = 12, red) and ROR1Neg (n = 12, blue) CLL cases using log2 effective count z scores for 2000 genes expressed in all samples (effective count >0) with the largest coefficients of variation. Each column represents a separate case. (B) z scores from Ingenuity Pathway Analysis depicting the subnetwork–gene expression differences between ROR1Pos vs ROR1Neg CLL cases. The z score heat map depicts the top 10 most upregulated and top 10 most downregulated subnetworks. Each row represents the data for the subnetwork indicated at the right margin. (C) The z score of each of the 14 subnetworks that are expressed differentially by ROR1Pos (n = 12) vs ROR1Neg (n = 12) CLL cases that also were expressed differentially by the leukemia cells of ROR1xTCL1 (n = 4) vs TCL1 transgenic mice (n = 4). The color of the bar indicates whether the subnetwork is expressed at higher or lower level by ROR1Pos CLL relative to ROR1Neg CLL, or by ROR1xTCL1 leukemia cells relative to TCL1 leukemia cells, as indicated in the legend at the bottom of the figure. (D) Immunoblot analyses of whole cell lysates of ROR1Neg and ROR1Pos CLL as indicated at the top of the panel. Each lane represents a separate case. The membranes were probed with mAb-specific phospho-AKT (p-AKT Ser473) or total AKT (t-AKT) as indicated on the left margin. The ratios of the band densities for each case of p-AKT/t-AKT are provided in the dot plot on the right for ROR1Neg CLL cases vs ROR1Pos CLL cases, as indicated at the bottom. The horizontal bar provides the median ratio observed for each group. The Mann-Whitney U test was used to calculate the P value, indicating the significance of the difference in median values between the 2 groups.
Figure 3.
Figure 3.
ROR1PosCLL cells have enhanced survival, migration, and proliferation. (A) CLL-cell viability was assessed after 0, 3, 6, 24, or 48 hours and normalized to that of the cells at 0 hour (mean ± standard error of the mean [SEM]; n = 10 for each group). The initial absolute viability of all samples at 0 hour was of 81% ± 3% (mean ± SEM). Significant difference of the percentage live CLL cells between ROR1Pos (n = 10) and ROR1Neg (n = 10) subgroup is indicated by asterisks (Student t test; **P < .01). (B) Percentage of viability after 24 hours (left) and 48 hours (right) incubation. P values were determined by Wilcoxon matched paired nonparametric test. (C-E) After 3 hours of incubation, relative percentage of basal migration (C) and chemotaxis toward CXCL12 (D) or CCL19 (E) of ROR1Neg or ROR1Pos CLL cells, with or without Wnt5a (200 ng/mL), as indicated at the bottom of the graph. P values were determined by Wilcoxon matched paired nonparametric test. (F-H) CD154-induced proliferation of carboxyfluorescein diacetate succinimidyl ester (CFSE)-labeled ROR1Neg (F) or ROR1Pos (G) CLL cells (n = 3 per group) with (right) or without (left) exogenous Wnt5a in the presence of control IgG antibody or UC-961, as indicated in the upper left of each histogram. The results of assays on 1 representative CLL sample are shown with the percent of dividing cells. (H) The bars indicate the mean proportions of ROR1Pos or ROR1Neg CLL cells with diminished CFSE fluorescence from each of 3 different patients for each culture condition indicated at the bottom of the graph. Data are shown as mean ± SEM; **P < .01, *P < .05.
Figure 4.
Figure 4.
Relationship between expression levels of ROR1, TFS, and OS. Patients in the training cohort were segregated into ROR1-Lo vs ROR1-Hi subgroups using the ROR1 ΔMFI threshold found optimal for defining 2 groups that had the largest difference in TFS, whereas patients in the validation cohort were segregated into 2 subgroups using the ROR1 ΔMFI threshold found optimal for cases in the training cohort. (A-B) Kaplan-Meier curves depict the TFS probability over time for ROR1-Lo (dashed line) vs ROR1-Hi (continuous line) subgroups in the training cohort (A) or validation cohort (B). (C-D) Kaplan-Meier curves depict the OS probability over time for ROR1-Lo (dashed line) vs ROR1-Hi (continuous line) subgroups in the training cohort (C) or validation cohort (D). The number of patients in each category and the number of treatment events are shown in the tables under each figure. Statistical significance was determined by log-rank test (P < .05). The P values for the comparisons between subgroups are indicated below each graph.
Figure 5.
Figure 5.
Relationship between expression levels of ROR1 and TFS, OS on CLL cells segregated on the basis of IGHV mutation status. Kaplan-Meier curves depict the TFS (A) or OS (B) probability over time for ROR1-Lo with M-IGHV (black solid line), ROR1-Lo with U-IGHV (black dashed line), ROR1-Hi with M-IGHV (gray solid line), or ROR1-Hi with U-IGHV (gray dashed line) subgroups of all CLL patients for whom the IGHV mutation status is known.

References

    1. Fukuda T, Chen L, Endo T, et al. Antisera induced by infusions of autologous Ad-CD154-leukemia B cells identify ROR1 as an oncofetal antigen and receptor for Wnt5a. Proc Natl Acad Sci USA. 2008;105(8):3047-3052. - PMC - PubMed
    1. Baskar S, Kwong KY, Hofer T, et al. Unique cell surface expression of receptor tyrosine kinase ROR1 in human B-cell chronic lymphocytic leukemia. Clin Cancer Res. 2008;14(2):396-404. - PubMed
    1. Daneshmanesh AH, Mikaelsson E, Jeddi-Tehrani M, et al. Ror1, a cell surface receptor tyrosine kinase is expressed in chronic lymphocytic leukemia and may serve as a putative target for therapy. Int J Cancer. 2008;123(5):1190-1195. - PubMed
    1. Yu J, Chen L, Cui B, et al. Wnt5a induces ROR1/ROR2 heterooligomerization to enhance leukemia chemotaxis and proliferation. J Clin Invest. 2016;126(2):585-598. - PMC - PubMed
    1. Choudhury A, Derkow K, Daneshmanesh AH, et al. Silencing of ROR1 and FMOD with siRNA results in apoptosis of CLL cells. Br J Haematol. 2010;151(4):327-335. - PubMed

Publication types

MeSH terms

Substances