. 2016 Nov 22;17(9):2474-2487.
doi: 10.1016/j.celrep.2016.10.053. Epub 2016 Nov 3.

Differential Effects of Environmental and Genetic Factors on T and B Cell Immune Traits

Affiliations

Differential Effects of Environmental and Genetic Factors on T and B Cell Immune Traits

Raul Aguirre-Gamboa et al. Cell Rep. .

Abstract

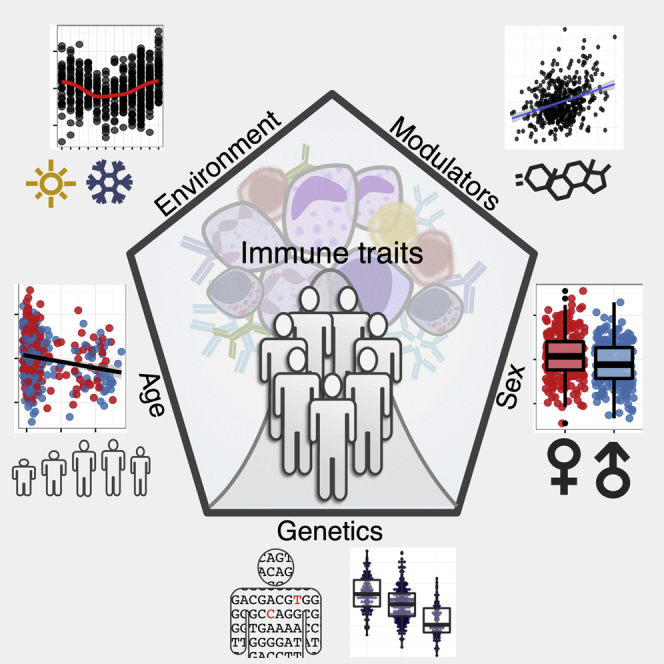
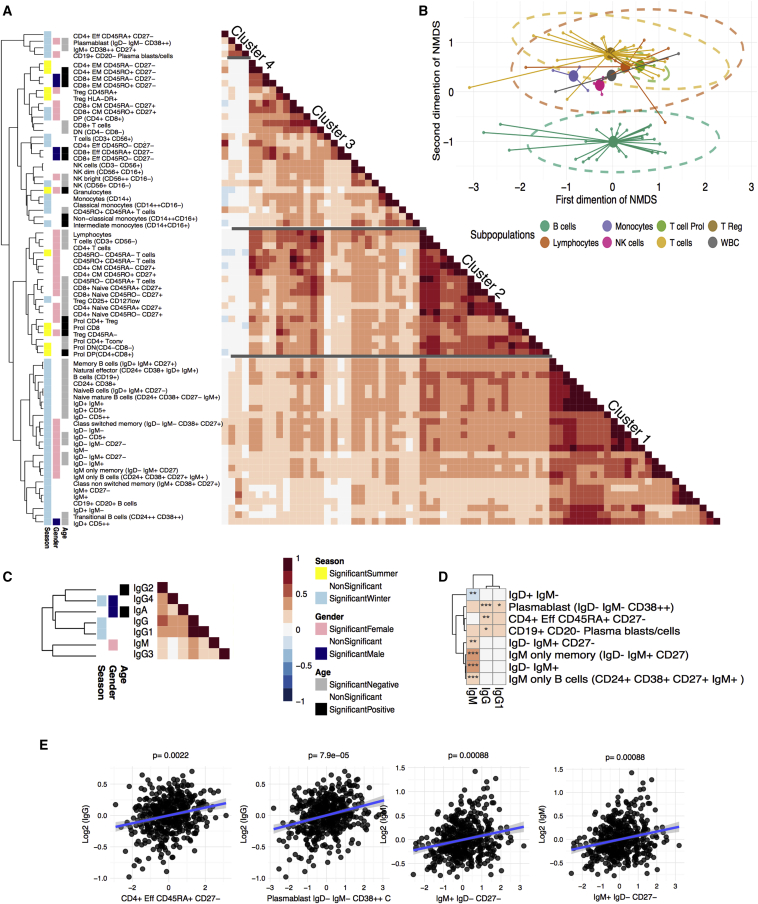
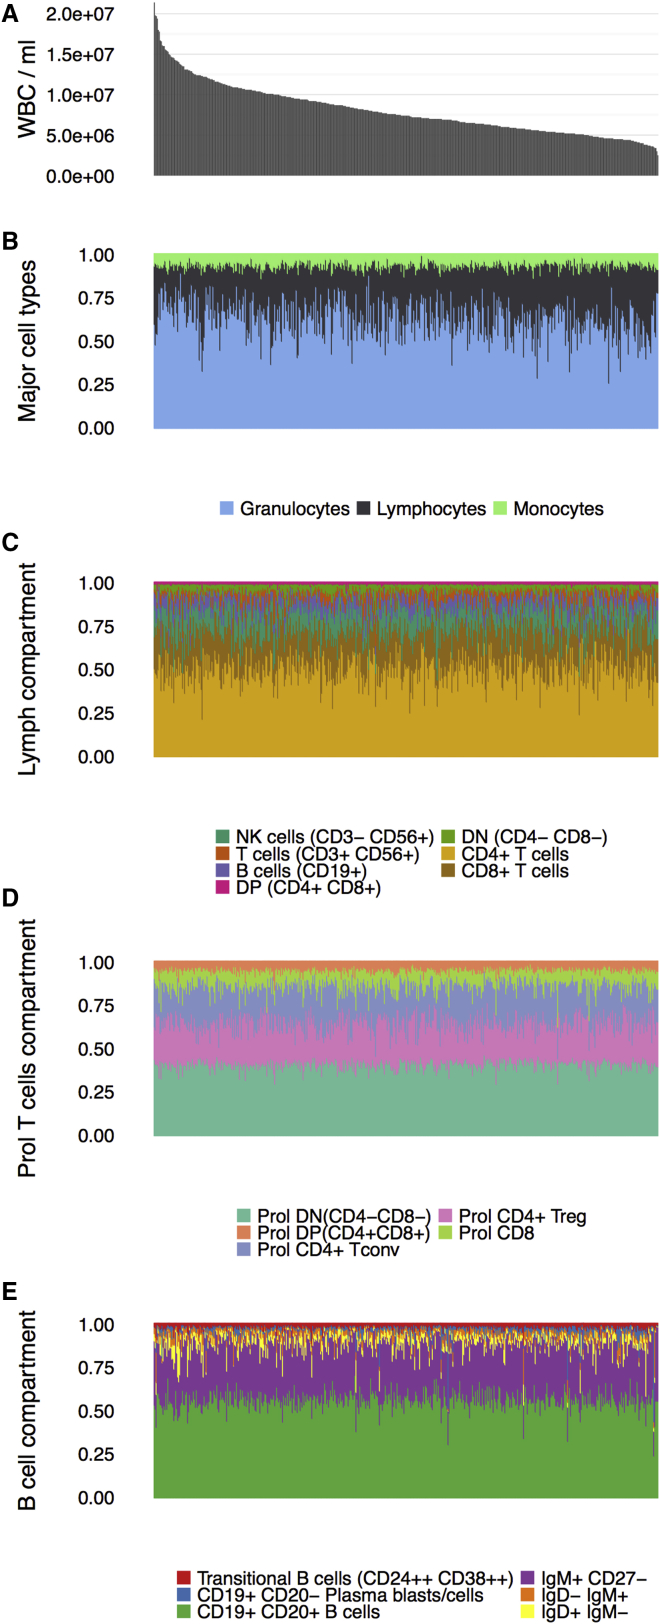
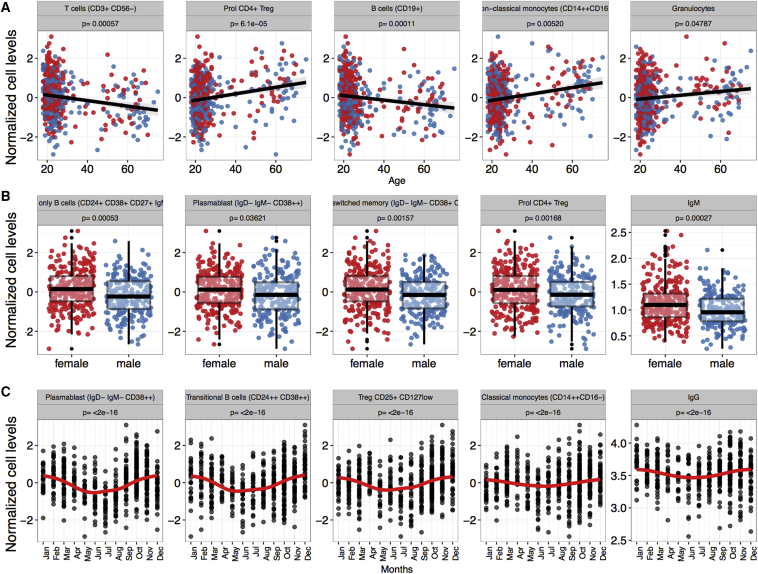
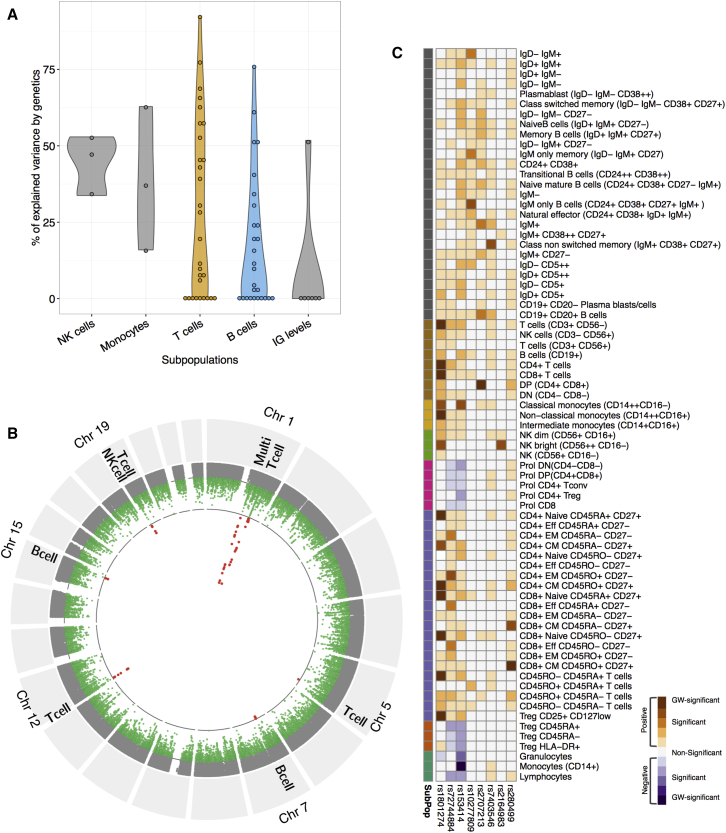
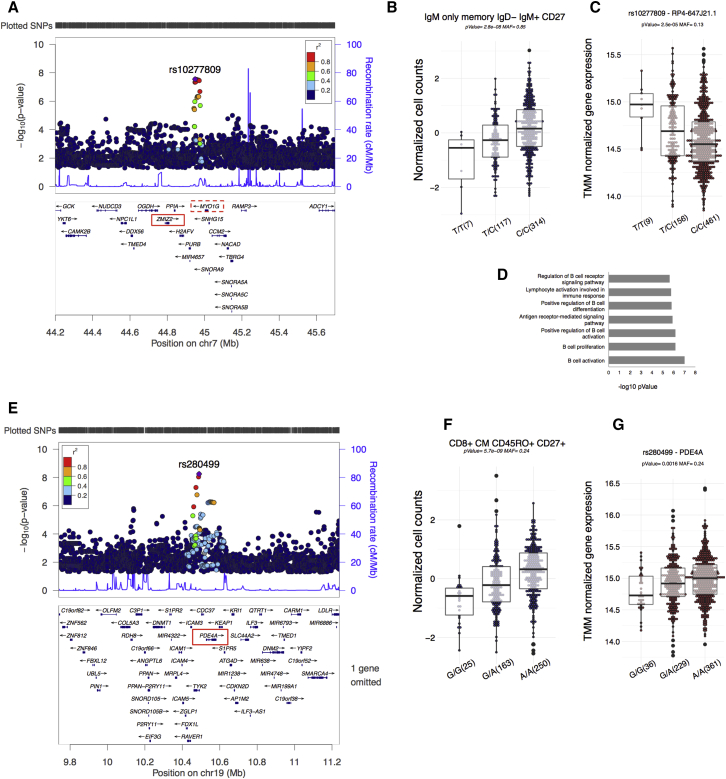
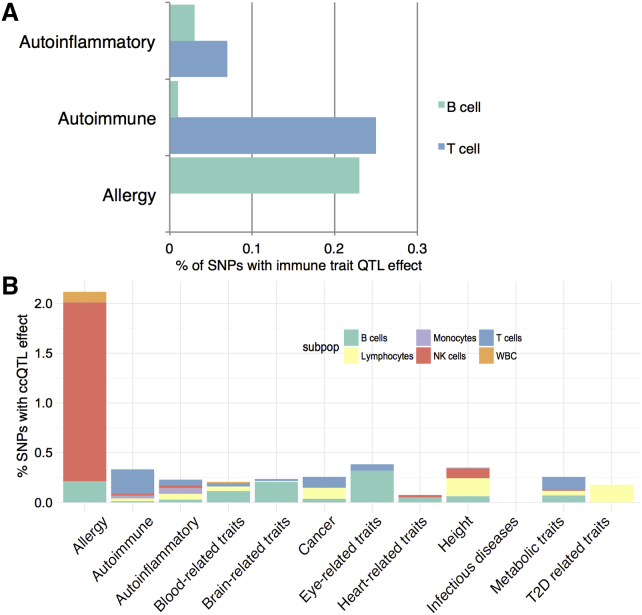
Effective immunity requires a complex network of cellular and humoral components that interact with each other and are influenced by different environmental and host factors. We used a systems biology approach to comprehensively assess the impact of environmental and genetic factors on immune cell populations in peripheral blood, including associations with immunoglobulin concentrations, from ∼500 healthy volunteers from the Human Functional Genomics Project. Genetic heritability estimation showed that variations in T cell numbers are more strongly driven by genetic factors, while B cell counts are more environmentally influenced. Quantitative trait loci (QTL) mapping identified eight independent genomic loci associated with leukocyte count variation, including four associations with T and B cell subtypes. The QTLs identified were enriched among genome-wide association study (GWAS) SNPs reported to increase susceptibility to immune-mediated diseases. Our systems approach provides insights into cellular and humoral immune trait variability in humans.


Figures

None
Graphical abstract
Figure 1
Figure 1
Interrelationship between Immune-Associated Cell Subpopulations and Immunoglobulin Levels in the General Population (A) Unsupervised hierarchical clustering of the correlation within cell subpopulations. (B) A two-dimensional representation of the correlations between each cell type by non-metric multidimensional scale analysis. Small circles represent individual cell types. Large circles represent the calculated centroid of the grouped cell types. (C) Unsupervised clustering of immunoglobulin levels. The color code next to the dendogram represents any significant association of cell count with age, gender, or season. (D) Heatmap of Spearman correlation coefficients between each independent cell subpopulation and immunoglobulin levels. Stars indicate significance of the correlation after FDR correction. p ≤ 0.05, ∗∗p ≤ 0.005, ∗∗∗p ≤ 0.0005. (E) Examples of cell subpopulations that are significantly associated with immunoglobulin levels. Regression line are included for visualization purposes.
Figure 2
Figure 2
Variation of Cell Levels and Composition in the Dutch General Population (A) Peripheral-blood white blood cell counts per ml blood (y axis) in 516 individuals (500FG cohort) (x axis). (B–E) Relative cell proportions (y axis) of monocytes, lymphocytes and neutrophils (B), the lymphoid subpopulations (C), proliferating T cell subsets (D), and B cell subsets (E). Samples are presented in the exact same order in each figure.
Figure 3
Figure 3
Age, Gender, and Season Are Modulators of the Immune Traits Examples of significant associations (FDR ≤ 0.05) between age (A), gender (B), or season (C) and cell counts or immunoglobulin levels.
Figure 4
Figure 4
The Genetics of Cell Counts and Immunoglobulin Level Variation in a General Population (A) Violin plot representing the distribution of the percentage of variance explained by genetics for the immune traits. A total of 29 T cell subsets versus 27 B cell subsets were analyzed (mean percentages of variance explained by genetics of 29.5 versus 17.7, respectively; Student’s t test, p ≤ 0.05). (B) Combined Manhattan plot of all cell types. Red dots mark genome-wide significant associations (p ≤ 5e−10). Immune cell types with the strongest association are indicated. (C) Overview of the association of multiple genomic loci (ccQLTs) and immune cell types. Darkest colors indicate genome-wide significant ccQTLs, while divergence represents the direction of ccQLT effect.
Figure 5
Figure 5
ccQTLs Associated with B and T Cell Subpopulations in Healthy Volunteers (A) Locus zoom plot showing a B-cell-specific ccQTL in chromosome 7. Red boxes in the gene area denote a significant eQTL effect (nominal p value ≤ 0.05) using ∼600 RNA-seq samples from an independent Dutch LLDeep cohort. (B) Box-plot of the top associated B cell subpopulation (IgM-only memory IgD− IgM+ CD27) with the genotype. (C) eQTL box-plot of the lncRNA RP4-647J2.1, which shows a high co-expression pattern with MYO1G, dotted red box in (A). (D) Gene ontology enrichment analysis of co-expression genes using publically available RNA-seq data (∼10,000) indicates that candidate gene RP4-647J21 is involved in the regulation of B cell activation. (E) Locus zoom plot showing a T-cell-specific ccQTL in chromosome 19. Red box marks the gene with a significant eQTL effect using the LLDeep cohort RNA-seq data (∼600 samples). (F) ccQTL boxplot of the top associated T cell subpopulation (CD8+ CM CD45RO+CD27+). (G) Box-plot of cis-eQTL of PDE4A using the LLDeep cohort RNA-seq data.
Figure 6
Figure 6
Association of ccQTLs with Disease (A) The percentage of auto-inflammatory-disease-, autoimmune-disease-, and allergy-associated SNPs with B cell and T cell count QTLs (p ≤ 1E-05). (B) The percentage of disease-associated SNPs with cell count QTLs (p ≤ 1E−05).

Similar articles

Cited by

References

    1. Akiyama M., Suzuki K., Yamaoka K., Yasuoka H., Takeshita M., Kaneko Y., Kondo H., Kassai Y., Miyazaki T., Morita R. Number of Circulating Follicular Helper 2 T Cells Correlates With IgG4 and Interleukin-4 Levels and Plasmablast Numbers in IgG4-Related Disease. Arthritis Rheumatol. 2015;67:2476–2481. - PubMed
    1. Amadori A., Zamarchi R., De Silvestro G., Forza G., Cavatton G., Danieli G.A., Clementi M., Chieco-Bianchi L. Genetic control of the CD4/CD8 T-cell ratio in humans. Nat. Med. 1995;1:1279–1283. - PubMed
    1. Baumgarth N., Herman O.C., Jager G.C., Brown L., Herzenberg L.A., Herzenberg L.A. Innate and acquired humoral immunities to influenza virus are mediated by distinct arms of the immune system. Proc. Natl. Acad. Sci. USA. 1999;96:2250–2255. - PMC - PubMed
    1. Benjamini Y., Hochberg Y. Controlling the False Discovery Rate: A Practical and Powerful Approach to Multiple Testing. J.R. Stat. Soc. 1995;57:289–300.
    1. Brodin P., Jojic V., Gao T., Bhattacharya S., Angel C.J.L., Furman D., Shen-Orr S., Dekker C.L., Swan G.E., Butte A.J. Variation in the human immune system is largely driven by non-heritable influences. Cell. 2015;160:37–47. - PMC - PubMed

Publication types

MeSH terms

LinkOut - more resources