. 2017 Feb;17(2):164-173.
doi: 10.1016/S1473-3099(16)30409-1. Epub 2016 Nov 3.

Genetic markers associated with dihydroartemisinin-piperaquine failure in Plasmodium falciparum malaria in Cambodia: a genotype-phenotype association study

Affiliations

Genetic markers associated with dihydroartemisinin-piperaquine failure in Plasmodium falciparum malaria in Cambodia: a genotype-phenotype association study

Roberto Amato et al. Lancet Infect Dis. 2017 Feb.

Abstract

Background: As the prevalence of artemisinin-resistant Plasmodium falciparum malaria increases in the Greater Mekong subregion, emerging resistance to partner drugs in artemisinin combination therapies seriously threatens global efforts to treat and eliminate this disease. Molecular markers that predict failure of artemisinin combination therapy are urgently needed to monitor the spread of partner drug resistance, and to recommend alternative treatments in southeast Asia and beyond.

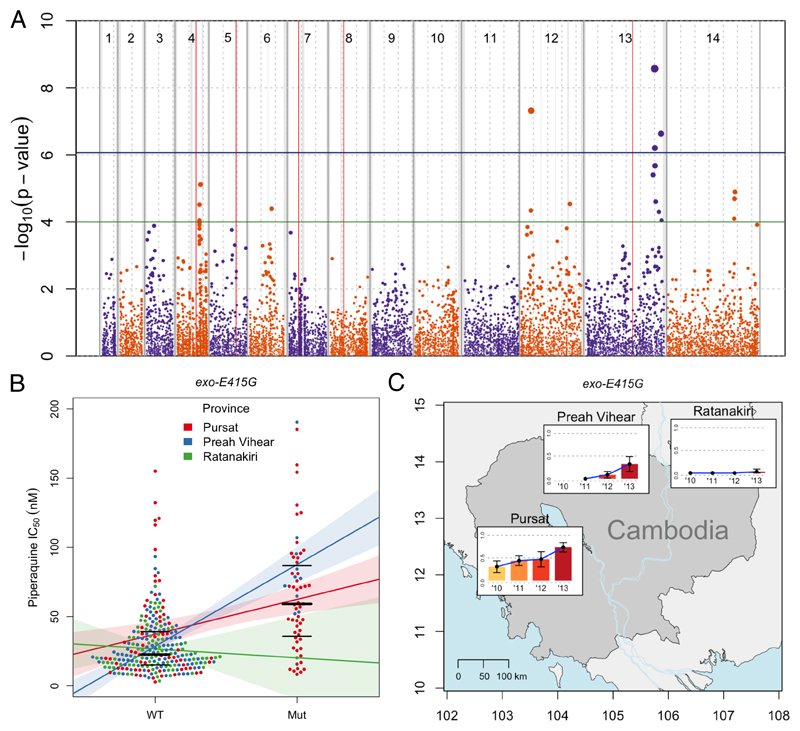
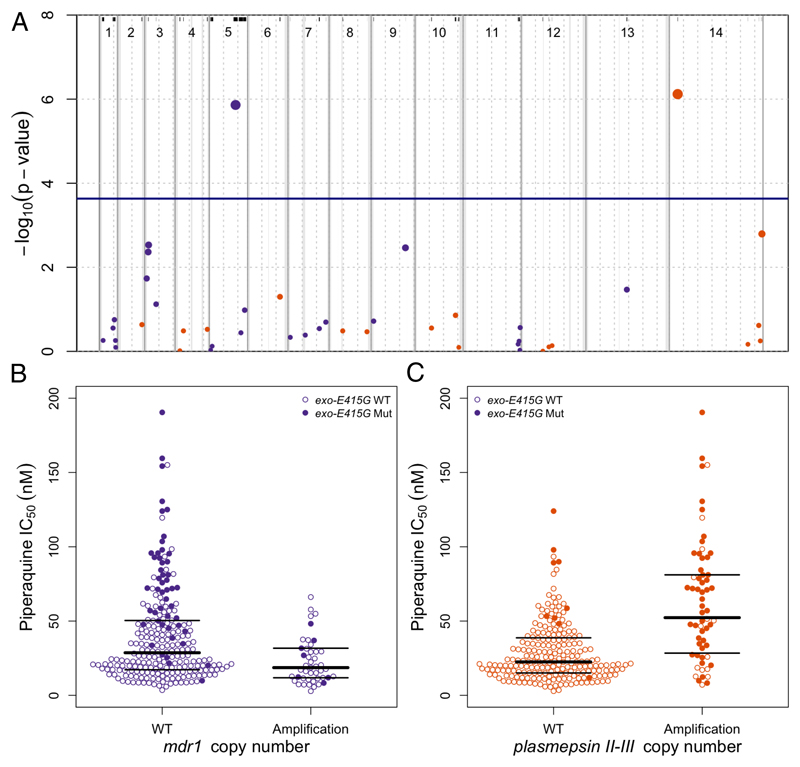
Methods: We did a genome-wide association study of 297 P falciparum isolates from Cambodia to investigate the relationship of 11 630 exonic single-nucleotide polymorphisms (SNPs) and 43 copy number variations (CNVs) with in-vitro piperaquine 50% inhibitory concentrations (IC50s), and tested whether these genetic variants are markers of treatment failure with dihydroartemisinin-piperaquine. We then did a survival analysis of 133 patients to determine whether candidate molecular markers predicted parasite recrudescence following dihydroartemisinin-piperaquine treatment.

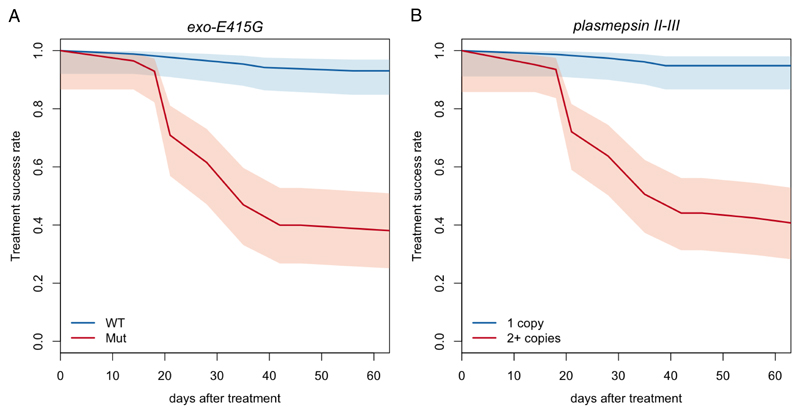
Findings: Piperaquine IC50s increased significantly from 2011 to 2013 in three Cambodian provinces (2011 vs 2013 median IC50s: 20·0 nmol/L [IQR 13·7-29·0] vs 39·2 nmol/L [32·8-48·1] for Ratanakiri, 19·3 nmol/L [15·1-26·2] vs 66·2 nmol/L [49·9-83·0] for Preah Vihear, and 19·6 nmol/L [11·9-33·9] vs 81·1 nmol/L [61·3-113·1] for Pursat; all p≤10-3; Kruskal-Wallis test). Genome-wide analysis of SNPs identified a chromosome 13 region that associates with raised piperaquine IC50s. A non-synonymous SNP (encoding a Glu415Gly substitution) in this region, within a gene encoding an exonuclease, associates with parasite recrudescence following dihydroartemisinin-piperaquine treatment. Genome-wide analysis of CNVs revealed that a single copy of the mdr1 gene on chromosome 5 and a novel amplification of the plasmepsin 2 and plasmepsin 3 genes on chromosome 14 also associate with raised piperaquine IC50s. After adjusting for covariates, both exo-E415G and plasmepsin 2-3 markers significantly associate (p=3·0 × 10-8 and p=1·7 × 10-7, respectively) with decreased treatment efficacy (survival rates 0·38 [95% CI 0·25-0·51] and 0·41 [0·28-0·53], respectively).

Interpretation: The exo-E415G SNP and plasmepsin 2-3 amplification are markers of piperaquine resistance and dihydroartemisinin-piperaquine failures in Cambodia, and can help monitor the spread of these phenotypes into other countries of the Greater Mekong subregion, and elucidate the mechanism of piperaquine resistance. Since plasmepsins are involved in the parasite's haemoglobin-to-haemozoin conversion pathway, targeted by related antimalarials, plasmepsin 2-3 amplification probably mediates piperaquine resistance.

Funding: Intramural Research Program of the US National Institute of Allergy and Infectious Diseases, National Institutes of Health, Wellcome Trust, Bill & Melinda Gates Foundation, Medical Research Council, and UK Department for International Development.


Conflict of interest statement

Conflicts of interest

We declare that we have no conflicts of interest.

Figures

Figure 1
Figure 1. Manhattan plot showing the statistical significance level of SNP associations in the GWAS (A), piperaquine IC50s (B), and exo-E415G frequency distribution (C).
(A) Each point represents 1 of the 11,630 SNPs with MAF>0.033 in the set of 297 P. falciparum clinical isolates, coloured according to chromosome. Genomic location is shown on the x-axis. The p value for each SNP's association, calculated using a linear mixed model, is shown on the y-axis; point size is proportional to significance level. Province of sample origin, status of kelch13 (mutant vs wild-type), presence or absence of mdr1 amplification, and a genetic relatedness matrix were added as fixed effects to the analysis. 4 SNPs reached the Bonferroni-corrected, genome-wide significance level of p≤8.6×10⁻⁷ (above horizontal blue line). Loci containing these significant SNPs, plus those containing suggestive SNPs reaching the significance level of p≤10−4 (above horizontal green line), are listed in Table 1. Vertical red lines mark known drug resistance loci: dhfr, mdr1, crt, dhps, and kelch13 on chromosomes 4, 5, 7, 8, and 13, respectively. Dashed grey vertical lines are plotted every 500 Kbp from the beginning of each chromosome. Solid grey vertical boxes mark telomeric, sub-telomeric, and internal hypervariable regions. (B) Each point represents the piperaquine IC50 for a P. falciparum clinical isolate carrying the wild-type ‘A’ allele (WT) or mutant ‘G’ allele (Mut) allele of exo-E415G (Pf3D7_13_v3:2504560). Bold and thin horizontal lines indicate the median and interquartile range of each distribution, respectively. Samples are divided into 3 coloured groups depending on their geographical origin. Coloured lines represent the least-squares linear regression of the phenotype on the 2 genotypes, calculated in each group separately. Shaded areas represent 95%CIs of the regression. (C) Coloured bars indicate the mutant allele frequencies in each of the 3 provinces over time (no samples were available from Preah Vihear in 2010). Error bars indicate 95% confidence intervals of the estimation. Geographical coordinates are shown on the axes.
Figure 2
Figure 2. Manhattan plot showing the statistical significance level of CNV associations in the GWAS (A) and piperaquine IC50s according to mdr1 and plasmepsin II-III copy number (B).
(A) Each point represents 1 of the 43 CNVs present in ≥5 samples, coloured according to chromosome. Genomic location is shown on the x-axis. The p value for each CNV's association, calculated using a linear mixed model, is shown on the y-axis; point size is proportional to significance level. The province of sample origin, status of kelch13 (mutant vs wild-type), and a genetic relatedness matrix were added as fixed effects to the analysis. 2 CNVs reached the Bonferroni-corrected, genome-wide significance level of p≤2.3×10⁻⁴ (above the horizontal blue line), 1 including plasmepsin II and plasmepsin III, and 1 including mdr1. All 43 CNVs are marked by black lines at the top and are listed in supplementary table 3. Dashed grey vertical lines are plotted every 500 Kbp from the beginning of each chromosome. Solid grey vertical boxes mark telomeric, sub-telomeric, and internal hypervariable regions. (B, C) Each point represents the piperaquine IC50 for a P. falciparum clinical isolate carrying wild-type (WT) or amplified (Amplification) mdr1 (B) or plasmepsin II-III (C) genes. Bold and thin horizontal lines indicate the median and interquartile range of each distribution, respectively. Filled circles identify samples also carrying exo-E415G.
Figure 3
Figure 3. Treatment success rate stratified by exo-E415G (A) and plasmepsin II-III copy number (B).
Adjusted survival curves showing the proportion of recrudescent cases following dihydroartemisinin-piperaquine treatment, according to the presence of the exo-E415G SNP (A) and plasmepsin II-III amplification (B).

Comment in

References

    1. http://www.who.int/malaria/publications/atoz/9789241547925/en/

    1. Fairhurst RM. Understanding artemisinin-resistant malaria: what a difference a year makes. Current opinion in infectious diseases. 2015;28(5):417–25. - PMC - PubMed
    1. Amaratunga C, Sreng S, Suon S, et al. Artemisinin-resistant Plasmodium falciparum in Pursat province, western Cambodia: a parasite clearance rate study. The Lancet Infectious diseases. 2012;12(11):851–8. - PMC - PubMed
    1. Amaratunga C, Lim P, Suon S, et al. Dihydroartemisinin-piperaquine resistance in Plasmodium falciparum malaria in Cambodia: a multisite prospective cohort study. The Lancet Infectious diseases. 2016;16(3):357–65. - PMC - PubMed
    1. Dondorp AM, Nosten F, Yi P, et al. Artemisinin resistance in Plasmodium falciparum malaria. The New England journal of medicine. 2009;361(5):455–67. - PMC - PubMed

MeSH terms