. 2016 Nov 14;30(5):750-763.
doi: 10.1016/j.ccell.2016.10.005. Epub 2016 Nov 3.

Transcriptomic Characterization of SF3B1 Mutation Reveals Its Pleiotropic Effects in Chronic Lymphocytic Leukemia

Affiliations

Transcriptomic Characterization of SF3B1 Mutation Reveals Its Pleiotropic Effects in Chronic Lymphocytic Leukemia

Lili Wang et al. Cancer Cell. .

Abstract

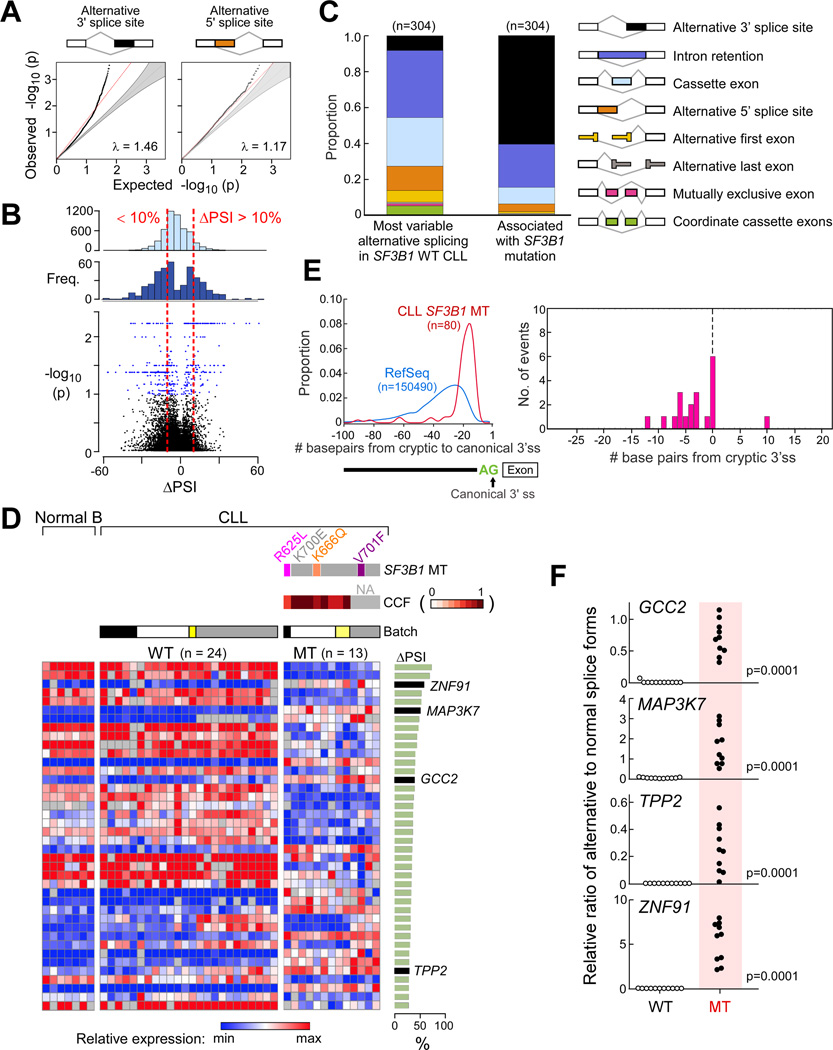
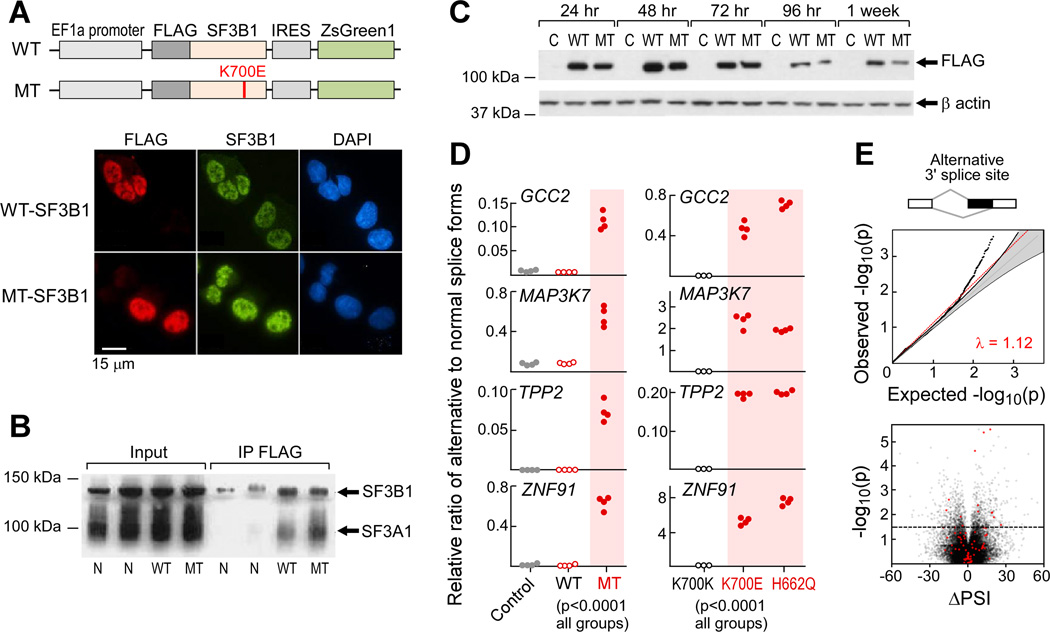
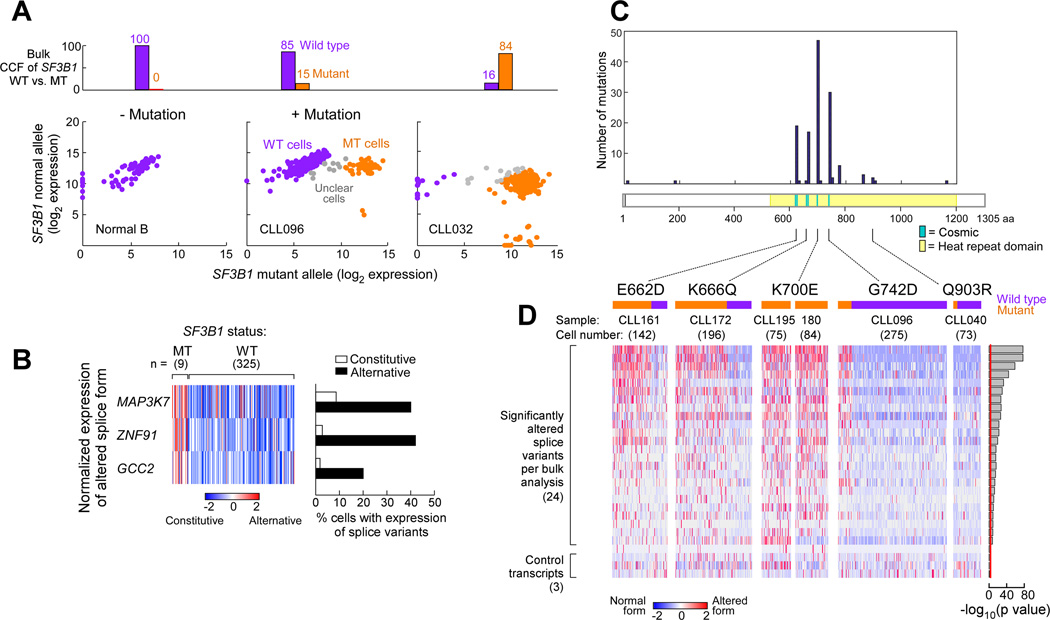
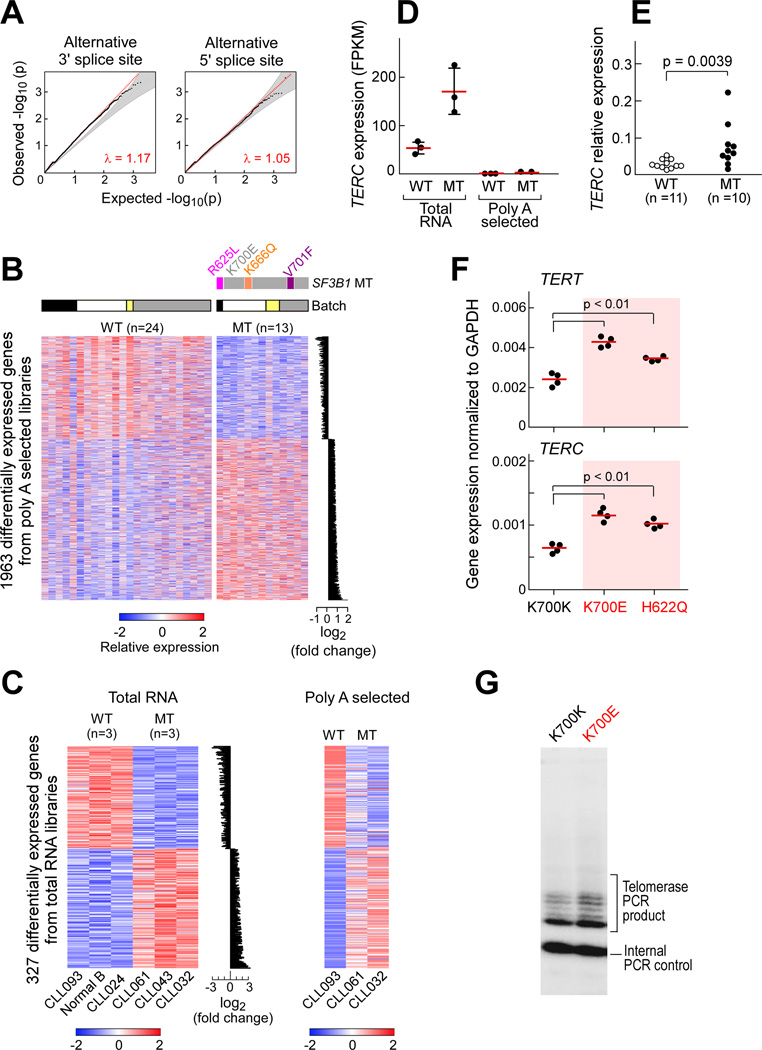
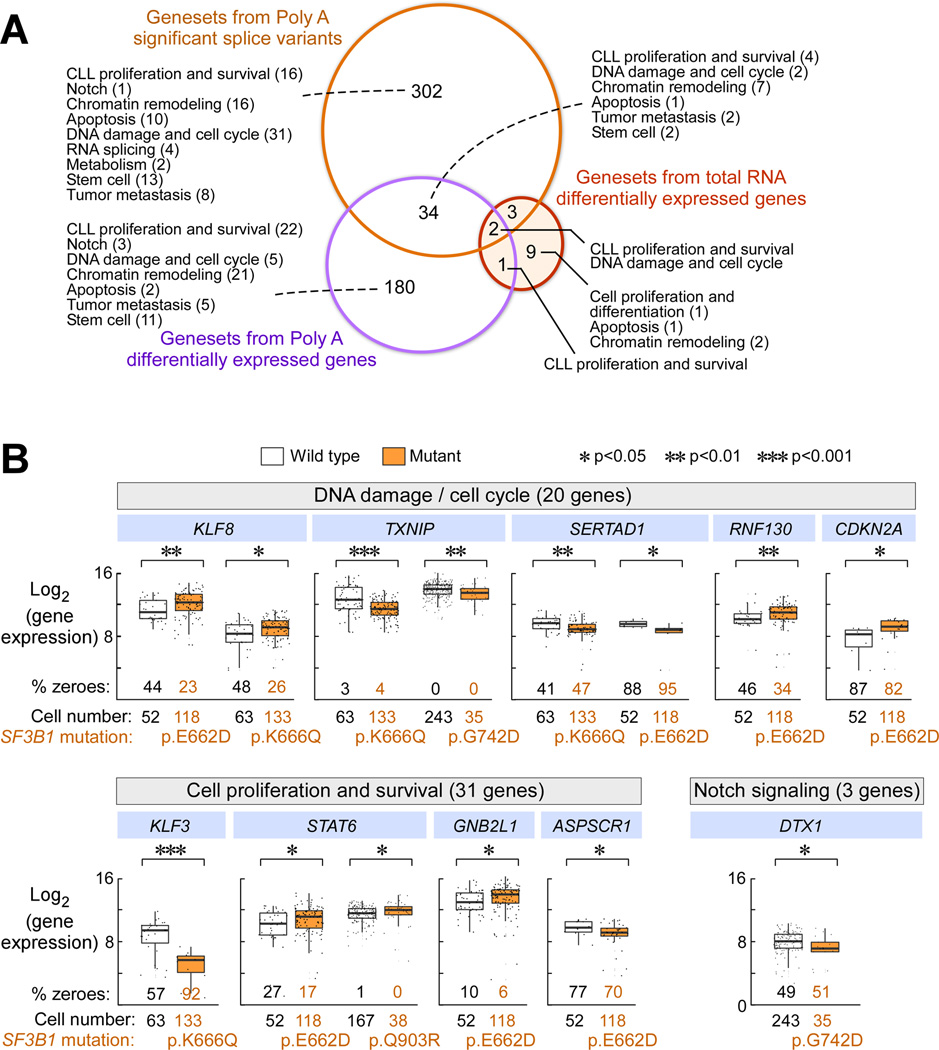
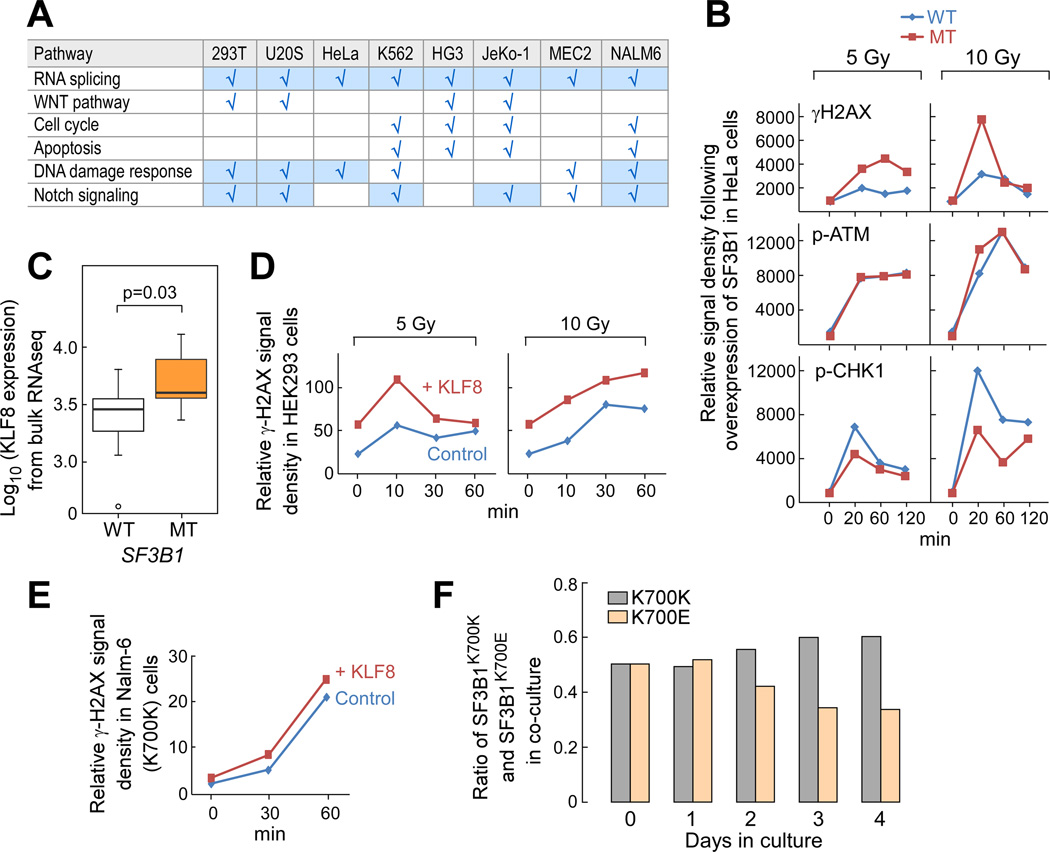
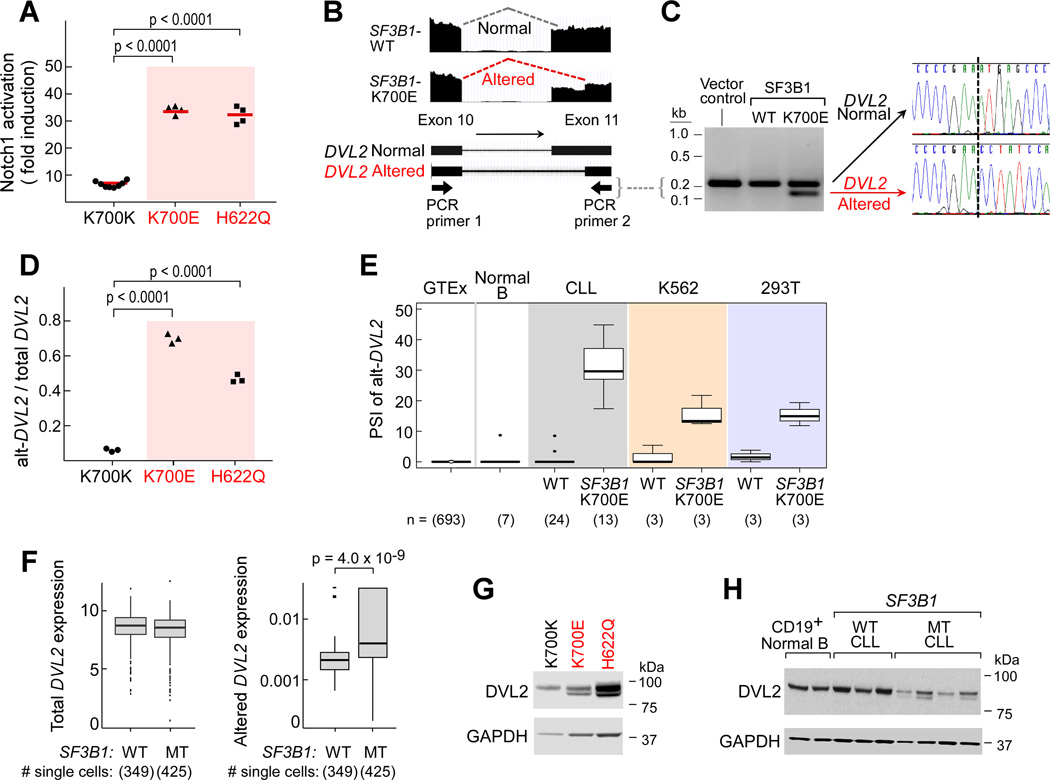
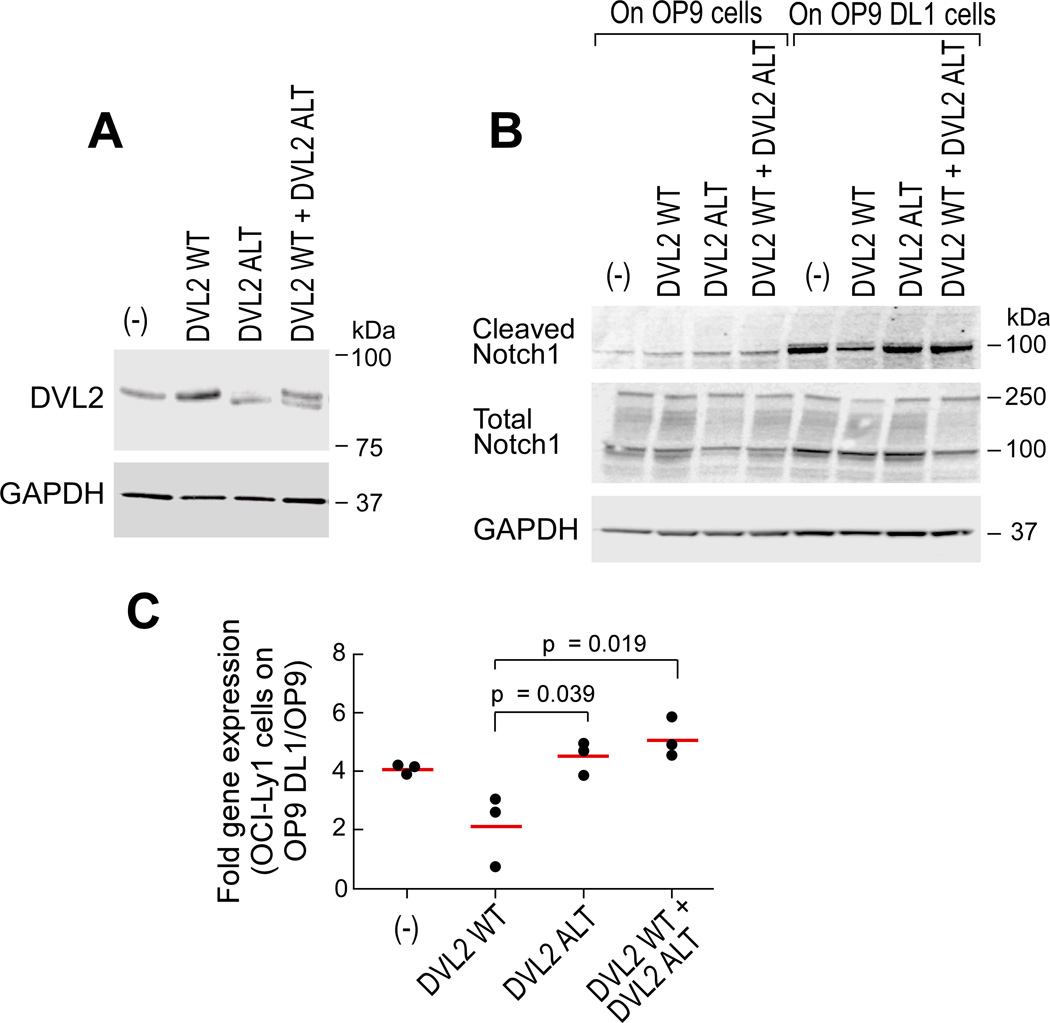
Mutations in SF3B1, which encodes a spliceosome component, are associated with poor outcome in chronic lymphocytic leukemia (CLL), but how these contribute to CLL progression remains poorly understood. We undertook a transcriptomic characterization of primary human CLL cells to identify transcripts and pathways affected by SF3B1 mutation. Splicing alterations, identified in the analysis of bulk cells, were confirmed in single SF3B1-mutated CLL cells and also found in cell lines ectopically expressing mutant SF3B1. SF3B1 mutation was found to dysregulate multiple cellular functions including DNA damage response, telomere maintenance, and Notch signaling (mediated through KLF8 upregulation, increased TERC and TERT expression, or altered splicing of DVL2 transcript, respectively). SF3B1 mutation leads to diverse changes in CLL-related pathways.

Keywords: CLL; Notch signaling; RNA sequencing; SF3B1; alternative splicing.


Conflict of interest statement

Michael Seiler, Silvia Buonamici, Peter G. Smith are employees and shareholders of H3 Biomedicine. Catherine J. Wu is co-founder and scientific advisory board member of Neon Therapeutics, Inc. All other authors have no conflicts of interest.

Figures

Figure 1
Figure 1. SF3B1 mutation is associated with alternative splicing at 3’ splice sites in CLL
(A) Q–Q plots comparing observed empirical with expected p values between SF3B1 wild-type and mutated CLL identified through the analysis of bulk poly-A selected RNA-seq from 37 CLLs. Red line - the least-squares linear fit to the lower 95 percentile of points with slope λ. Grey-shaded areas - 95% confidence intervals for the expected distribution. (B) Frequency of ΔPSI from random comparisons (top) or significant splice changes (middle, p<0.05) from the RNA-Seq data above and volcano plot of ΔPSI versus log10(p) of all splicing changes (bottom). Red dotted lines - thresholds of ΔPSI of 10%. Blue dots -significant splicing events. (C) Categories of alternative splicing within the 304 splice events significantly associated with mutant SF3B1 in CLL vs. the 304 most variable alternatively spliced events in wild-type CLL from bulk poly-A selected RNA-seq. (D) Heat map of the top 40 alternatively spliced events with the highest ΔPSI between CLL samples with mutant (n=13) and wild-type (n=24) SF3B1. Expression of splice variants from RNA-seq analysis of CD19+ selected B cells from 7 healthy adult volunteers indicated, along with RNA-seq batch labels, SF3B1 mutation type and clonality status. Right panel - ΔPSI for each splice event. (E) Left-Density plot of the positions of cryptic AGs relative to their canonical splice sites in SF3B1 mutant samples, compared to the distance to the first AG (non-GAG trimer) from all RefSeq canonical 3’ splice sites. Right-Relative positions of mapped branchpoints (BP) (n = 16) from Mercer et al. X axis - distance in nucleotides (nt) of the BP to the cryptic AG (upstream positions are negative distances); Y axis - the frequency of BP found at that position. (F) Validation of RNA-seq analysis through quantitative PCR of selected significantly altered spliced events in independent CLL samples (11 with wild-type (WT) and 10 with mutated (MT) SF3B1). See also Figure S1.
Figure 2
Figure 2. Expression of mutant SF3B1 causes alternative splicing
(A) Schematics of wild-type (WT) and K700E mutated (MT) SF3B1 expression constructs (top) and immunoflourescence staining of FLAG-tagged SF3B1 in K562 cells that were nucleofected with SF3B1 constructs (bottom). (B) Cell lysate from HeLa cells overexpressing either WT or MT SF3B1 was immunprecipated with anti-FLAG antibody and probed with anti-SF3B1 antibody. (C) FLAG-tagged mutant and wild-type SF3B1 protein were transiently expressed in HEK293T cells and detected by immunoblotting. (D) Expression of alternative splicing associated with SF3B1 mutations in transfected K562 cells (left, n=4 for each group) and in isogenic Nalm-6 cells (right) was assessed with quantitative RT-PCR assays. (E) Analysis of bulk poly-A selected RNA-seq of K562 cells expressing SF3B1-K700E. Top panel- Q–Q plot of alternative 3’ splice sites between empirical p value of observed and expected spliced events. Lower panel - volcano plot of ΔPSI in relation to significance between wild-type and mutant SF3B1 overexpression in K562 cells for each splicing events. Red dots - significantly differentially spliced events also identified in the primary CLL analysis. See also Figure S2.
Figure 3
Figure 3. Single CLL cells with SF3B1 mutation express alternatively spliced RNAs
(A) Example of SF3B1 mutation call in single normal B cells and from CLL cells from samples with either subclonal (CLL096) or clonal (CLL032) SF3B1 mutation. Log2 transformed expression of mutant vs wild-type SF3B1 alleles are plotted, with each dot representing one single cell. Purple - cells identified to be SF3B1 wild-type; Orange - cells inferred to be SF3B1 mutant; Grey - cells with ambiguous calls. (B) Expression of alternative vs. constitutive transcript relative to total expression of the genes MAP3K7, ZNF91 and GCC2 from single cells of sample CLL096. (C) Frequency of mutations in SF3B1 at different mutation sites from a recent study of 538 CLL samples (Landau et al., 2015). Yellow shading - heat repeat region; Blue - mutation sites previously reported from the COSMIC database. (D) Single cell profiling of splice variant expression across 5 SF3B1 mutations from 6 CLL samples (one cell per column). Expression of the alternative transcript relative to total gene expression in 24 selected genes, identified from the bulk poly-A RNA-seq analysis, was scored along with 3 control genes. Orange and purple bars indicate cells with and without mutation, respectively.
Figure 4
Figure 4. Affected genes associated with SF3B1 mutation in CLL samples
(A) Q–Q plots of alternative 5’ and 3’ splice sites between empirical p value of observed and expected spliced events from RNA-Seq analysis of CLL total RNA libraries. (B) Heat map visualizations of significantly differentially expressed genes (batch corrected, adjusted p value < 0.2) between CLL samples with or without SF3B1 mutation derived from poly-A selected RNA. The barplot at the right shows the average log2 fold expression difference between the two conditions. (C) Left-visualization of the 327 significantly differentially expressed genes (batch corrected, adjusted p value < 0.2) identified from total RNA libraries derived from one sample of normal CD19+ B cells, two SF3B1 wild type samples, and three SF3B1 mutant CLL samples. Right- heatmap of the same genes, extracted from RNA-Seq data prepared from poly-A selected libraries of matched CLL samples. (D) TERC expression in CLL samples with SF3B1 mutation from RNA-Seq data prepared from either total RNA or poly-A selected libraries. Mean (red line) ± SD; n=3. (E) TERC expression was assessed in independent CLL samples with mutant or wild-type SF3B1, with cDNA prepared with random hexamers. (F) TERC and TERT expression was examined in Nalm-6 cells gene-edited to express SF3B1K700E and SF3B1H622Q (compared to SF3B1K700K), with cDNA prepared with random hexamers. Red line indicates mean. (G) Telomerase activity in Nalm-6 cells expressing either SF3B1K700E or SF3B1K700K was measured with telomeric repeat amplification protocol assay. Shown are representative results from one of three experiments. See also Figure S3.
Figure 5
Figure 5. SF3B1 mutations affect genes involved in multiple CLL-associated pathways
(A) An analysis of overlap of enriched gene sets (all with q-value < 0.1) using splice variants and differentially expressed genes associated with mutant SF3B1 derived from total and poly-A selected RNA libraries. This analysis includes 1970 gene sets from MSigDb and 14 additional manually curated gene sets. Each number represents the number of gene sets enriched in the different groups. (B) Gene expression of single CLL cells from samples with subclonal SF3B1 mutation that were tested in parallel against a panel of 96 genes, encompassing targets of CLL-associated pathways. Significantly differentially expressed genes associated with expression of SF3B1 mutation in individual cells associated with the DNA damage response and cell cycle regulation, proliferation and survival and Notch signaling are shown. Median is represented as a line inside the box. Lines at the bottom and top of the box represent, respectively, the 25th and the 75th quartile, and lines above and below the box show the minimum and maximum. P values were defined by a two-sided Wilcoxon rank sum test. ‘% zeroes’ represents the percent of total cells samples with zero expression for that particular genes. See also Figure S4.
Figure 6
Figure 6. Functional assessment of SF3B1 K700E on cellular processes in CLL and in cell lines
(A) Summary of effects of expressing SF3B1-K700E on 6 CLL-associated pathways examined in different cell lines. Shaded –cell lines and pathways for which SF3B1-K700E expression appeared to exert a functional change in the cell type evaluated. (B) Levels of phosphorylated forms of H2AX, ATM and CHK1 in HeLa cells upon γ-irradiation were examined from cells overexpressing wild-type or mutant SF3B1 for 48 hours. Relative signal intensity was plotted based on Image J quantification of bands from the raw image. (C) Box-and-whisker plots of KLF8 expression in bulk CLL samples with SF3B1 mutation compared to WT SF3B1 derived from the RNA-seq dataset was plotted (Median-center line within box; Bottom and Top lines of box represent the 25th and the 75th quartile, respectively, while whiskers above and below the box show the minimum and maximum values). (D, E) DNA damage response was assessed in HEK293 (D) and Nalm-6 (E) SF3B1K700K cells that were transfected or nucleofected with control or KLF8 expressing constructs upon various doses of γ-irradiation, and protein levels of phosphorylated form of H2AX protein expression was quantified using Image J. (F) Nalm-6 SF3B1K700E and SF3B1K700K cells were co-cultured and the percentage of each cell population was assessed daily. Shown is representative data from 2 independent culture experiments. See also Figure S5.
Figure 7
Figure 7. SF3B1 mutation modulates Notch signaling and generates alternative splicing of DVL2
(A) Nalm-6 SF3B1K700K, SF3B1H622Q and SF3B1K700E cells were nucleofected with a Notch luciferase reporter along with a GFP-expressing plasmid in the presence or absence of a Notch1-expressing construct. 48 hours after the nucleofection, GFP positive cells were isolated and Notch activity in these cells was assessed by measuring luciferase activity. (B) Visualization of the DVL2 transcript from RNA-Seq of CLL samples with and without SF3B1 mutation. (C) Detection of DVL2 transcript using primers that cross exons 10 and 11 with cDNA derived from K562 cells overexpressing the vector control, or the wild-type or mutant SF3B1. Sanger sequencing of the two different fragments from mutant samples revealed the same junction as detected in the RNA-Seq. (D) DVL2 alternative transcript levels in the Nalm-6K700E, Nalm6 H622Q, and Nalm-6K700K cells. (E) Expression of the alternative splice isoform of DVL2 mRNA (alt-DVL2) is evaluated in relation to SF3B1 mutation. PSI of alt-DVL2 in RNA-Seq data from the GTEx consortium (693 samples from blood, brain, breast, lung, and colon), 7 samples of normal B cells, 37 CLL samples and K562 and HEK293T cells overexpressing wild-type or mutant SF3B1 (Median-center line within box; Bottom and Top lines of box represent the 25th and the 75th quartile, respectively, while whiskers above and below the box show the minimum and maximum values). (F) Total mRNA or the alternative form of DVL2 expression in single CLL cells with mutated or wild-type SF3B1, using samples and an analysis approach per Figure 3D. Median is represented as a line inside the box. Lines at the bottom and top of the box represent, respectively, the 25th and the 75th quartile, and lines above and below the box show the minimum and maximum. Outliers displayed as points. (G, H) Detection of protein expression of alternative DVL2 in Nalm-6 isogenic cell lines (G) and primary CLL samples with or without SF3B1 mutation (H). See also Figure S6.
Figure 8
Figure 8. SF3B1 mutation modulates Notch signaling through a splice variant of DVL2
(A) Detection of DVL2 expression in OCI-Ly1 B cell lymphoma cells with stable expression of wild-type (WT), altered (ALT), or combined wild-type and altered forms (WT+ALT) of DVL2 by immunoblot. (B) Activation of Notch1 in OCI-Ly1 cells expressing different DVL2 isoforms co-cultured with OP9 or OP9-DL1 cells for 48 hours assessed by immunoblot. (C) Expression of the Notch target gene HES1 in OCI-Ly1 cells described in Figure 8A co-cultured with either OP9 or OP9-DL1 cells was measured by qRT-PCR. Red line indicates mean. See also Figure S7.

References

    1. Adiconis X, Borges-Rivera D, Satija R, DeLuca DS, Busby MA, Berlin AM, Sivachenko A, Thompson DA, Wysoker A, Fennell T, et al. Comparative analysis of RNA sequencing methods for degraded or low-input samples. Nat Methods. 2013;10:623–629. - PMC - PubMed
    1. Alsafadi S, Houy A, Battistella A, Popova T, Wassef M, Henry E, Tirode F, Constantinou A, Piperno-Neumann S, Roman-Roman S, et al. Cancer-associated SF3B1 mutations affect alternative splicing by promoting alternative branchpoint usage. Nat Commun. 2016;7:10615. - PMC - PubMed
    1. Bieging KT, Mello SS, Attardi LD. Unravelling mechanisms of p53-mediated tumour suppression. Nat Rev Cancer. 2014;14:359–370. - PMC - PubMed
    1. Brooks AN, Choi PS, de Waal L, Sharifnia T, Imielinski M, Saksena G, Pedamallu CS, Sivachenko A, Rosenberg M, Chmielecki J, et al. A pan-cancer analysis of transcriptome changes associated with somatic mutations in U2AF1 reveals commonly altered splicing events. PLoS One. 2014;9:e87361. - PMC - PubMed
    1. Brooks AN, Yang L, Duff MO, Hansen KD, Park JW, Dudoit S, Brenner SE, Graveley BR. Conservation of an RNA regulatory map between Drosophila and mammals. Genome Res. 2011;21:193–202. - PMC - PubMed

MeSH terms