. 2016 Oct 28;2(10):e1601273.
doi: 10.1126/sciadv.1601273. eCollection 2016 Oct.

Serine one-carbon catabolism with formate overflow

Affiliations

Serine one-carbon catabolism with formate overflow

Johannes Meiser et al. Sci Adv. .

Abstract

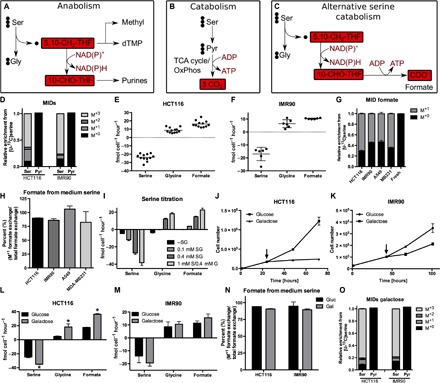
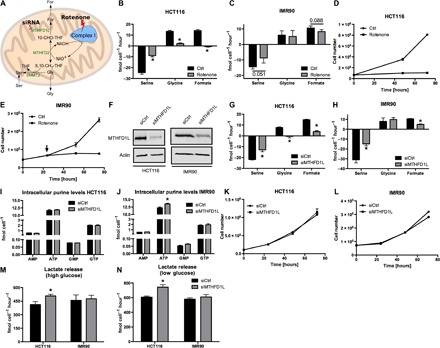
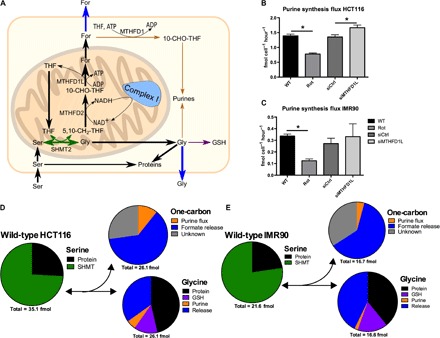
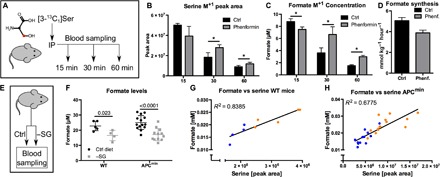
Serine catabolism to glycine and a one-carbon unit has been linked to the anabolic requirements of proliferating mammalian cells. However, genome-scale modeling predicts a catabolic role with one-carbon release as formate. We experimentally prove that in cultured cancer cells and nontransformed fibroblasts, most of the serine-derived one-carbon units are released from cells as formate, and that formate release is dependent on mitochondrial reverse 10-CHO-THF synthetase activity. We also show that in cancer cells, formate release is coupled to mitochondrial complex I activity, whereas in nontransformed fibroblasts, it is partially insensitive to inhibition of complex I activity. We demonstrate that in mice, about 50% of plasma formate is derived from serine and that serine starvation or complex I inhibition reduces formate synthesis in vivo. These observations transform our understanding of one-carbon metabolism and have implications for the treatment of diabetes and cancer with complex I inhibitors.

Keywords: Serine metabolism; folate metabolism; metformin; mitochondria metabolism; one-carbon metabolism; overflow metabolism.


Figures

Fig. 1
Fig. 1. Serine catabolism is induced upon energy stress.
(A) Current model of serine metabolism to support purine synthesis. dTMP, deoxythymidine monophosphate. (B) Current model of serine catabolism. (C) Postulated model of serine one-carbon catabolism with formate overflow. OxPhos, oxidative phosphorylation. (D) MIDs of pyruvate and serine using [U-13C]serine as a tracer in HCT116 colorectal cancer cells and IMR90 human fibroblasts. (E and F) Absolute exchange rates of serine, glycine, and formate in (E) HCT116 and (F) IMR90 cells. Positive values indicate metabolite release and negative value uptake from cells. Each dot indicates an independent experiment (performed with three cultures per condition). (G) MID of extracellular formate using [U-13C]serine as a tracer in HCT116, IMR90, A549, and MDA-MB231 cells. (H) Percentage of formate from medium serine. (I) Serine, glycine, and formate exchange rates at different medium serine concentrations in HCT116 cells (as indicated). S, serine; G, glycine. (J and K) Proliferation of (J) HCT116 and (K) IMR90 cells upon galactose. The arrow indicates start of galactose treatment. (L and M) Absolute exchange rates of serine, glycine, and formate in (L) HCT116 and (M) IMR90 cells upon galactose. (N) Percentage of formate from medium serine in HCT116 and IMR90 cells upon glucose and galactose. (O) MIDs of pyruvate and serine using [U-13C]serine as a tracer in HCT116 and IMR90 cells in galactose medium. Data are presented as means ± SD (n = 3 cultures representative of at least two independent experiments), except for (E) and (F) (see above). *P < 0.05 by Welch’s t test.
Fig. 2
Fig. 2. Serine catabolism is linked to mitochondria.
(A) Model illustrating mitochondrial one-carbon metabolism and its potential dependency on complex I. (B and C) Absolute exchange rates of serine, glycine, and formate in (B) HCT116 and (C) IMR90 cells upon rotenone. (D and E) Proliferation of (D) HCT116 and (E) IMR90 cells upon rotenone. (F) Western blot confirming knockdown of MTHFD1L in HCT116 and IMR90 cells. (G and H) Absolute exchange rates of serine, glycine, and formate in (G) HCT116 and (H) IMR90 cells upon MTHFD1L knockdown. (I and J) Absolute intracellular purine levels in (I) HCT116 and (J) IMR90 cells upon MTHFD1L knockdown. GMP, guanosine monophosphate; GTP, guanosine triphosphate. (K and L) Proliferation of (K) HCT116 and (L) IMR90 cells upon MTHFD1L knockdown. (M and N) Lactate release rates of HCT116 and IMR90 cells upon MTHFD1L knockdown under (M) high-glucose (17 mM) and (N) low-glucose (5.5 mM) conditions. Data are presented as means ± SD (n = 3 cultures representative of at least two independent experiments), except for (F) (one culture). *P < 0.05 by Welch’s t test.
Fig. 3
Fig. 3. Formate efflux exceeds anabolic one-carbon demands.
(A) Model summarizing major cellular serine–derived fluxes in mammalian cells. (B and C) Absolute purine synthesis flux in (B) HCT116 and (C) IMR90 cells. (D and E) Pie charts representing fluxes of serine, glycine, and one-carbon moieties in (D) HCT116 and (E) IMR90 cells under normal conditions. The numbers underneath the pie chart represent the summed contribution of all sinks reported in the pie chart above (per cell per hour). We note that these pie charts just reflect the average measurements [see (B) and (C) and fig. S3 (A to D) for the measurement errors of each specific contribution]. SHMT, serine hydroxymethyltransferase. Data are presented as means ± SD (n = 3 cultures representative of at least two independent experiments). *P < 0.05 by Welch’s t test.
Fig. 4
Fig. 4. Serum formate depends on serine catabolism in vivo.
(A) Model illustrating the setup to trace serine-derived formate formation in vivo. (B) Abundance of serine M+1 isotopologues in plasma, 15, 30, and 60 min after injection with or without phenformin. (C) Concentration of formate M+1 isotopologue in plasma, 15, 30, and 60 min after injection with or without phenformin. (D) Estimated serine-derived formate synthesis rate in phenformin-treated or phenformin-untreated mice (see text for reported CIs). (E) Model illustrating the experimental setup for serine/glycine (−SG) starvation, to measure its effect on serum formate level. (F) Formate concentration in the serum of serine- and glycine-starved mice [3 weeks starvation in WT mice (n ≥ 5) and in APCmin mice at clinical end point (n ≥ 12)]. We note the exclusion of one outlier in the 3-week setup (see fig. S4, D and E). (G and H) Correlation between serine and formate levels in (G) WT and in (E) APCmin mice in respect to serine/glycine starvation. Data are presented as means ± SD [(B to D) n = 4 mice per condition and time point]. *P < 0.05 by Welch’s t test.

References

    1. Tibbetts A. S., Appling D. R., Compartmentalization of mammalian folate-mediated one-carbon metabolism. Annu. Rev. Nutr. 30, 57–81 (2010). - PubMed
    1. Locasale J. W., Serine, glycine and one-carbon units: Cancer metabolism in full circle. Nat. Rev. Cancer 13, 572–583 (2013). - PMC - PubMed
    1. Allen R. W., Moskowitz M., Arrest of cell growth in G1 phase of cell cycle by serine deprivation. Exp. Cell Res. 116, 127–137 (1978). - PubMed
    1. Rowe P. B., Sauer D., Fahey D., Craig G., Mccairns E., One-carbon metabolism in lectin-activated human-lymphocytes. Arch. Biochem. Biophys. 236, 277–288 (1985). - PubMed
    1. Maddocks O. D. K., Berkers C. R., Mason S. M., Zheng L., Blyth K., Gottlieb E., Vousden K. H., Serine starvation induces stress and p53-dependent metabolic remodelling in cancer cells. Nature 493, 542−546 (2013). - PMC - PubMed