. 2016 Nov 7:6:36250.
doi: 10.1038/srep36250.

The transgenerational inheritance of autism-like phenotypes in mice exposed to valproic acid during pregnancy

Affiliations

The transgenerational inheritance of autism-like phenotypes in mice exposed to valproic acid during pregnancy

Chang Soon Choi et al. Sci Rep. .

Abstract

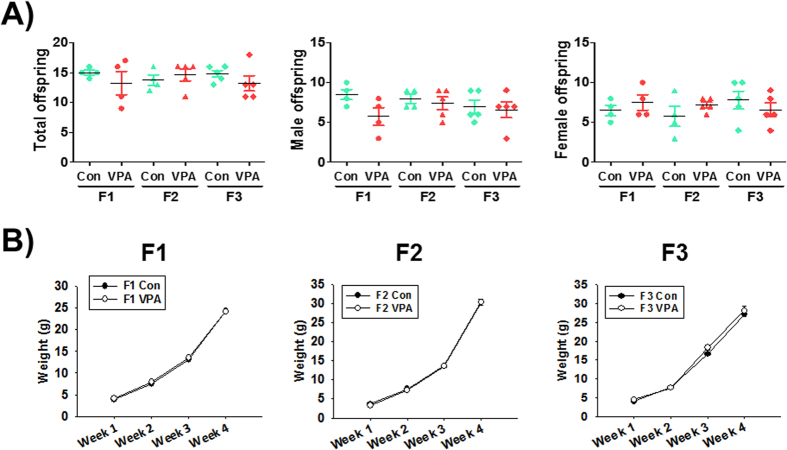
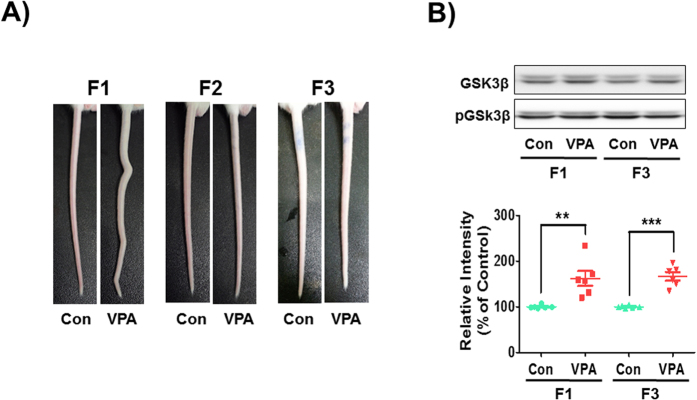
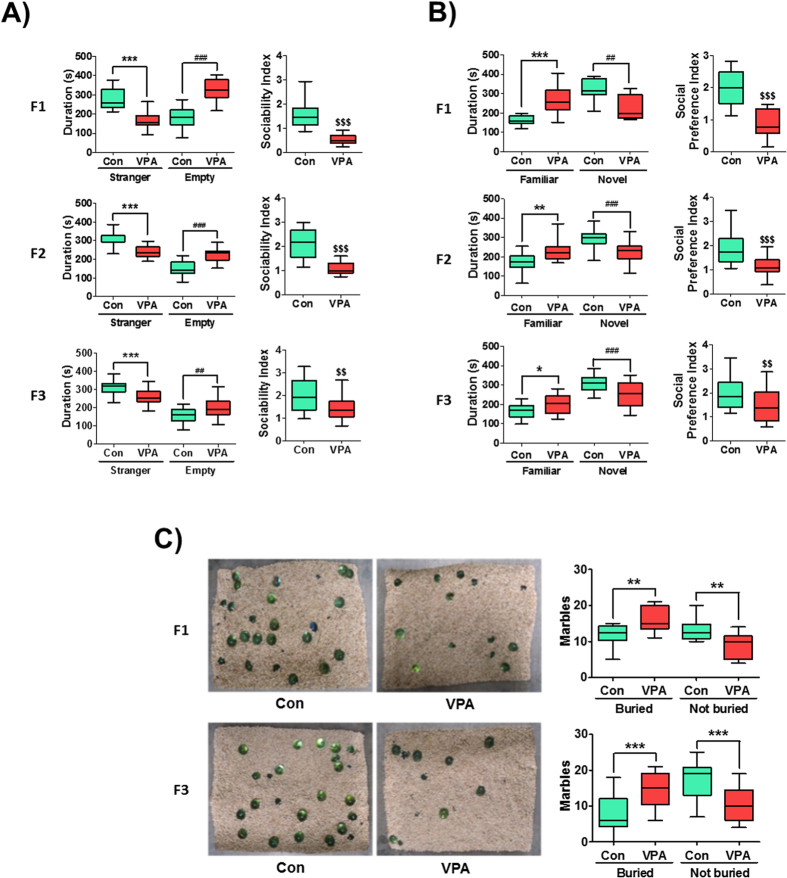
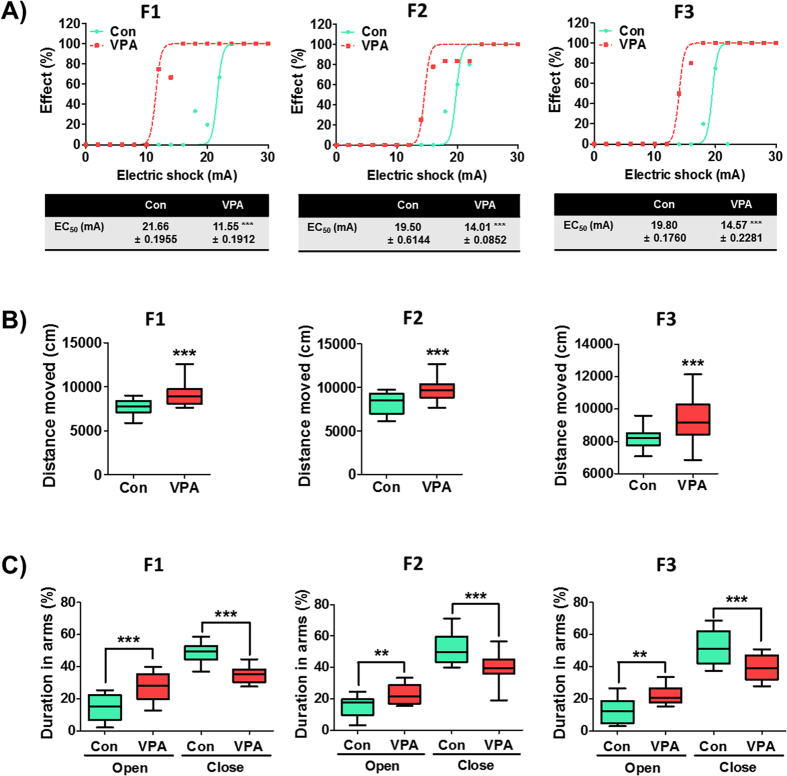
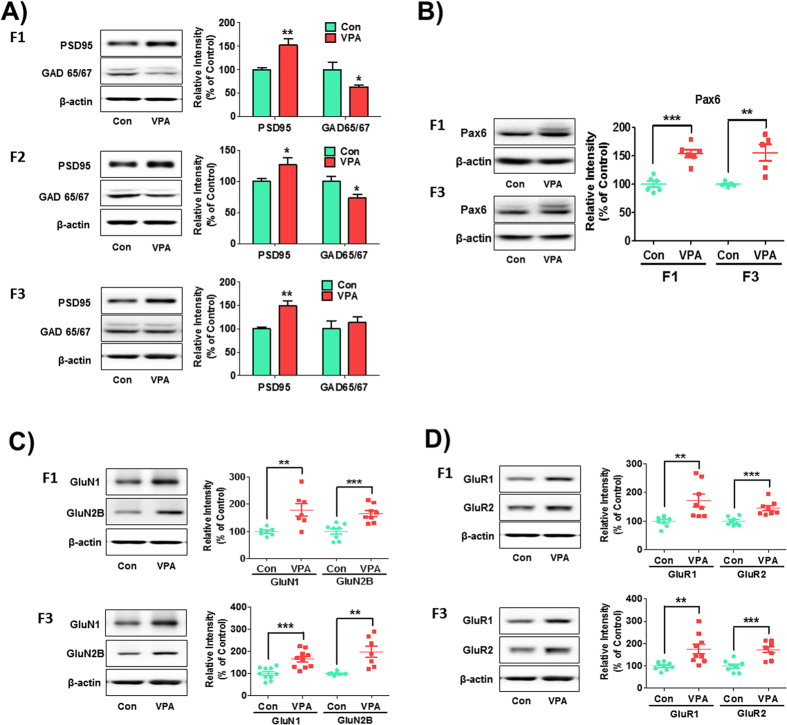
Autism spectrum disorder (ASD) is a heterogeneously pervasive developmental disorder in which various genetic and environmental factors are believed to underlie its development. Recently, epigenetics has been suggested as a novel concept for ASD aetiology with a proposition that epigenetic marks can be transgenerationally inherited. Based on this assumption of epigenetics, we investigated the transgenerational inheritance of ASD-like behaviours and their related synaptic changes in the VPA animal model of ASD. The first generation (F1) VPA-exposed offspring exhibited autistic-like impaired sociability and increased marble burying. They also showed increased seizure susceptibility, hyperactivity and decreased anxiety. We mated the VPA-exposed F1 male offspring with naïve females to produce the second generation (F2), and then similarly mated the F2 to deliver the third generation (F3). Remarkably, the autism-like behavioural phenotypes found in F1 persisted to the F2 and F3. Additionally, the frontal cortices of F1 and F3 showed some imbalanced expressions of excitatory/inhibitory synaptic markers, suggesting a transgenerational epigenetic inheritance. These results open the idea that E/I imbalance and ASD-like behavioural changes induced by environmental insults in mice can be epigenetically transmitted, at least, to the third generation. This study could help explain the unprecedented increase in ASD prevalence.


Figures

Figure 1
Figure 1. Transgenerational effect of VPA in litter size and body weights of exposed mice.
The number of live pups in each litter and in every generation were measured at postnatal day 7. Body weights of control and VPA-exposed mice in every generation were measured from postnatal day 7 to 28. Pups number (A) and body weights (B) were not significantly different between the control and VPA-exposed group for each generation. All data are expressed as the mean ± S.E.M. (n = 4–5 litters per group and generation).
Figure 2
Figure 2. Neural tube defects by VPA exposure and its transgenerational effect.
(A) Malformations of tail structure occurred in F1 VPA-exposed mice, but not in the F2 and F3. (B) Protein levels of phosphorylated-GSK3β were examined using Western blot in F1 and F3 generation mice frontal cortex at embryonic day 14. All data are expressed as the mean ± S.E.M. (n = 12 mice randomly selected from 6 litters per group and per generation). **p < 0.01, ***p < 0.001 vs. control group as revealed by post-hoc Bonferroni’s comparisons.
Figure 3
Figure 3. Transgenerational effect of ASD-like behaviors in VPA-exposed mice.
(A) VPA exposure reduced the sociability of F1, F2 and F3 mice. The duration of stay (left panel) in stranger 1 (S1) side and empty side was shown in the graph. Sociability index (SI, right panel) was calculated as the ratio of time spent in stranger 1 side over empty side. ***p < 0.001 vs. control groups in S1 side; ##p < 0.01, ###p < 0.001 vs. control groups in empty side; $$p < 0.01, $$$p < 0.001 vs. control groups in SI as revealed by post-hoc Bonferroni’s comparisons (F1: n = 15 for Con and 17 for VPA; F2: n = 15 for Con and 20 for VPA; F3: n = 29 for Con and 20 for VPA; all mice were randomly selected from 6 litters per group and per generation). (B) VPA exposure reduced the social preference in F1, F2 and F3 mice. The duration of stay in familiar side (stranger 1, S1) and novel side (stranger 2, S2) was shown in the graph. Social preference index (SPI, right panel) was calculated as the ratio of time spent in S2 side over S1 side. *p < 0.05, **p < 0.01, ***p < 0.001 vs. control group in S1 side; ##p < 0.01, ###p < 0.001 vs. control groups in S2 side; $$p < 0.01, $$$p < 0.001 vs. control group in SPI as revealed by post-hoc Bonferroni’s comparisons. The animals used for this experiment is the same with the sociability test. (C) VPA exposure increased the repetitive behaviors in F1 and F3 mice as determined by the marble burying test. **p < 0.01, ***p < 0.001 vs. control group in each generation as revealed by post-hoc Bonferroni’s comparisons. (F1: n = 10 for Con and 9 for VPA; F3: n = 20 for Con and 20 for VPA; all mice were randomly selected from 6 litters per group and per generation).
Figure 4
Figure 4. Prenatal VPA exposure induces a transgenerational effect on accompanying symptoms of ASD.
(A) Increased sensitivity to electroshock stimulation in F1, F2 and F3 VPA-exposed mice. The CC50 of VPA groups in each generation were significantly lower than that of their respective controls (***p < 0.001). The tables show the actual values of CC50 with upper and lower confidence limits. (F1: n = 14 for Con and 12 for VPA; F2: n = 12 for Con and 17 for VPA; F3: n = 20 for Con and 30 for VPA; all mice were randomly selected from 6 litters per group and per generation). (B) Hyperactivity of VPA-exposed mice in F1, F2 and F3 generations determined by the open field test. The total distance moved was significantly increased in VPA groups of each generation. (F1: n = 29 for Con and 32 for VPA; F2: n = 24 for Con and 22 for VPA; F3: n = 34 for Con and 65 for VPA; all mice were randomly selected from 6 litters per group and per generation). (C) The anti-anxiety behaviors of VPA-exposed mice in each generation were investigated in the elevated plus maze. The percentages of time spent in the open arms were significantly increased in the VPA groups of each generation. (F1: n = 13 for Con and 10 for VPA; F2: n = 19 for Con and 14 for VPA; F3: n = 10 for Con and 15 for VPA; all mice were randomly selected from 6 litters per group and per generation). All data are expressed using box plot diagram. **p < 0.01, ***p < 0.001 vs. control group of each generation as revealed by post-hoc Bonferroni’s comparisons.
Figure 5
Figure 5. Increased expression of excitatory postsynaptic proteins in F1, F2 and F3 VPA-exposed mice.
Western blot analysis was performed using brain lysates from control and VPA-exposed mice of each generation at 4 weeks (A) for PSD95 [F1: n = 6 for Con and 5 for VPA; F2: n = 14 per group; F3: n = 5 for Con and 6 for VPA; all were randomly selected from 5–6 litters per group and per generation], and GAD 65/67 [F1: n = 8 per group; F2: n = 29 for Con and 24 for VPA; F3: n = 5 for Con and 6 for VPA; all were randomly selected from 5–6 litters per group and per generation]) and at E14 (B) for Pax6 [F1: n = 6 per group; F3: n = 5 per group; all were randomly selected from 5–6 litters per group and per generation]). Protein levels of NMDA (C) and AMPA (D) receptors were examined in the frontal cortex of F1 and F3 VPA-exposed mice offspring at postnatal week 4. To analyze the abnormalities in NMDA receptors, the protein levels of GluN1 (F1: n = 7 per group; F3: n = 10 per group; all were randomly selected from 6 litters per group and per generation) and GluN2B (F1: n = 8 per group; F3: n = 7 per group; all were randomly selected from 6 litters per group and per generation) were examined by Western blot. For AMPA receptors, the protein levels of GluR1 (F1: n = 8 per group; F3: n = 9 per group; all were randomly selected from 6 litters per group and per generation) and GluR2 (F1: n = 8 per group; F3: n = 8 per group; all were randomly selected from 6 litters per group and per generation) were examined. Cropped representative blots were shown for each protein of interest along with quantitative graphs of image analyses calculated as the percentage of expression relative to control groups normalized as 100%. *p < 0.05, **p < 0.01, ***p < 0.001 vs. control group as revealed by post-hoc Bonferroni’s comparisons.

References

    1. American Psychiatric Association. The diagnostic and statistical manual of mental disorders: DSM 5. bookpointUS. (Oxon, 2013).
    1. Home C. Prevalence of Autism Spectrum Disorder Among Children Aged 8 Years—Autism and Developmental Disabilities Monitoring Network, 11 Sites, United States, 2010 (2014). - PubMed
    1. Bailey A. et al. Autism as a strongly genetic disorder: evidence from a British twin study. Psychol Med 25, 63–77 (1995). - PubMed
    1. Folstein S. & Rutter M. Genetic influences and infantile autism. Nature 265, 726–728 (1977). - PubMed
    1. Steffenburg S. et al. A twin study of autism in Denmark, Finland, Iceland, Norway and Sweden. J Child Psychol Psychiatry 30, 405–416 (1989). - PubMed

Publication types