. 2016 Nov 7:7:13324.
doi: 10.1038/ncomms13324.

Saponin-based adjuvants induce cross-presentation in dendritic cells by intracellular lipid body formation

Affiliations

Saponin-based adjuvants induce cross-presentation in dendritic cells by intracellular lipid body formation

Martijn H den Brok et al. Nat Commun. .

Abstract

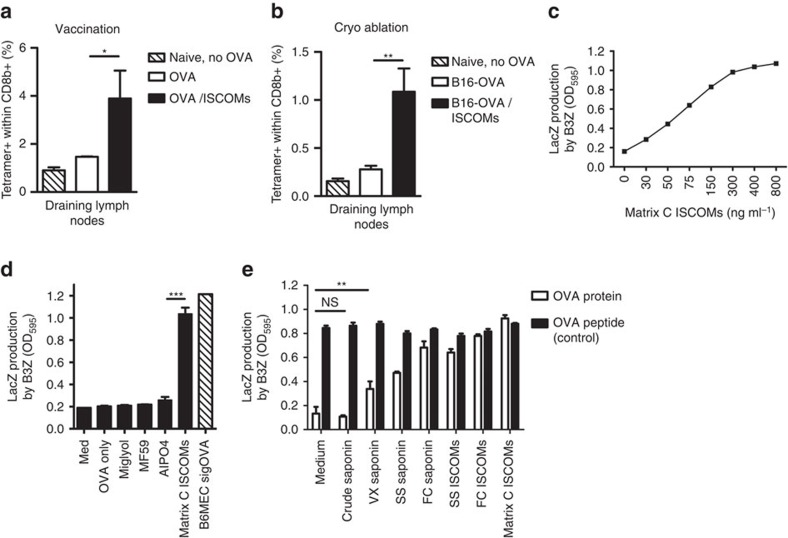
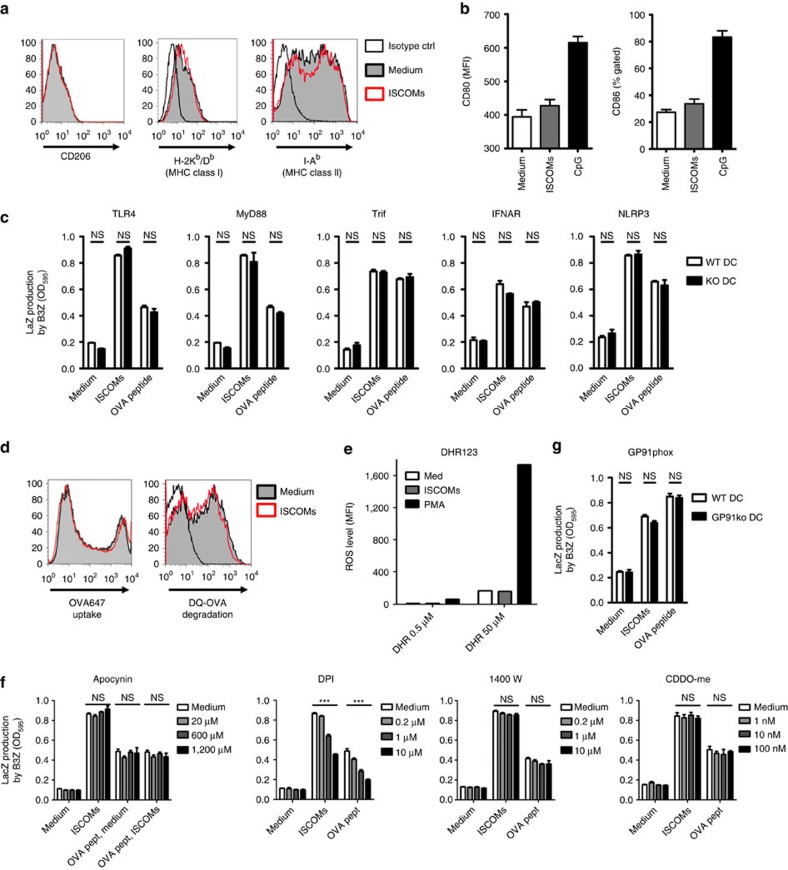
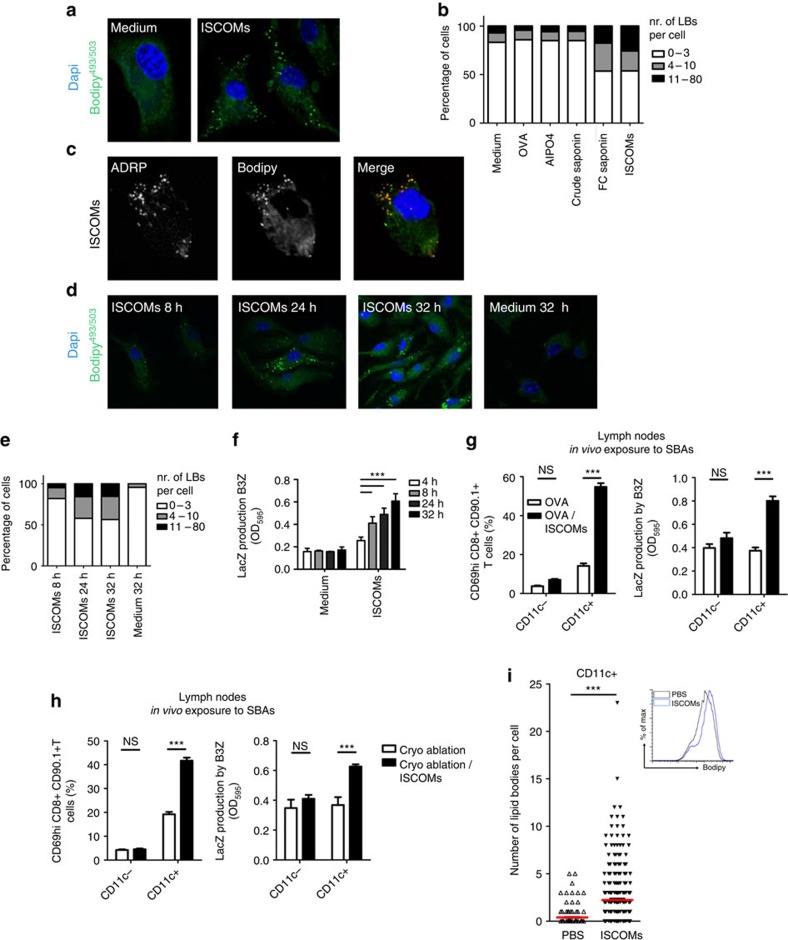
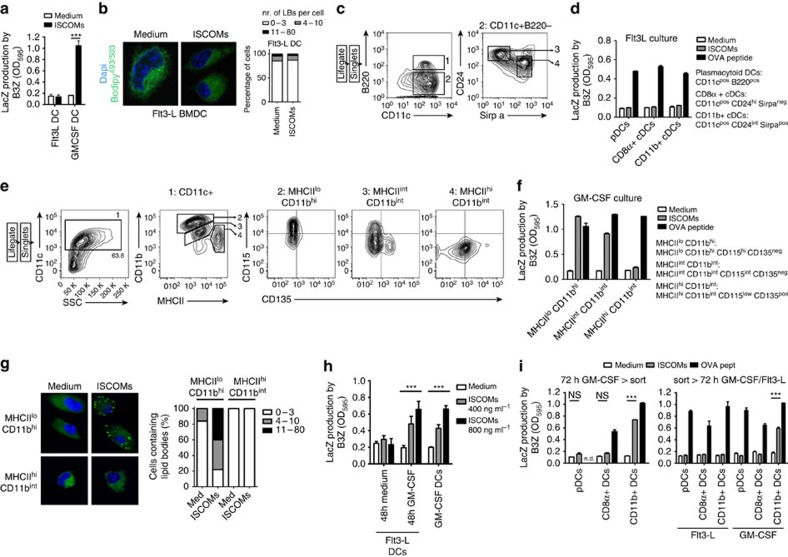
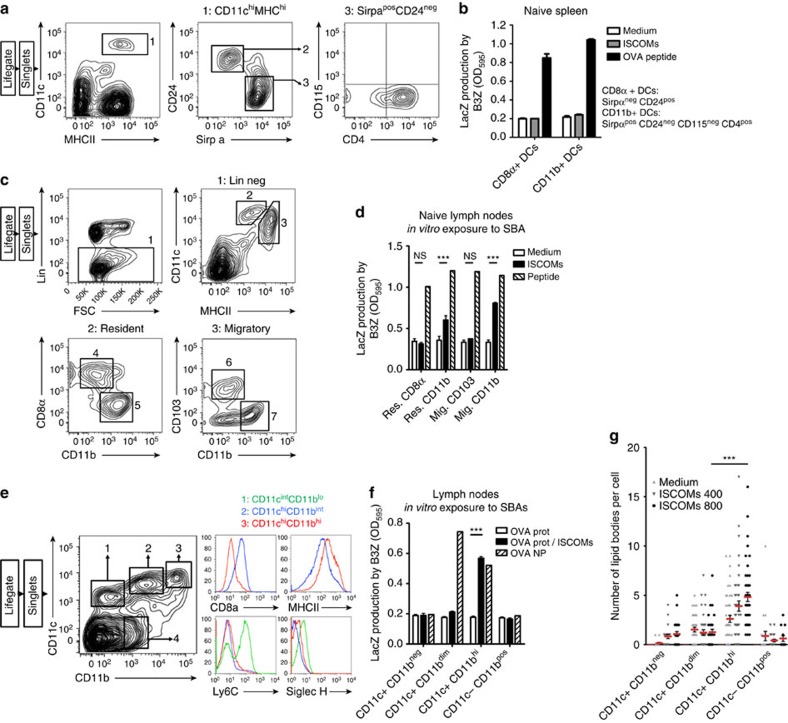
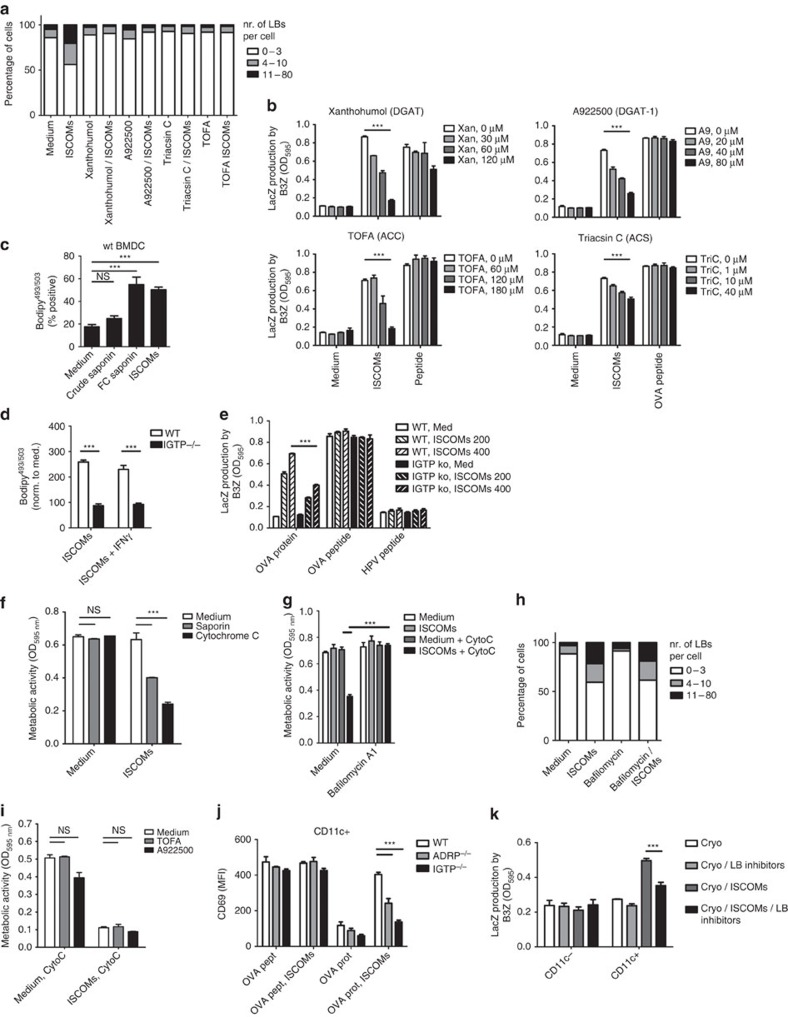
Saponin-based adjuvants (SBAs) are being used in animal and human (cancer) vaccines, as they induce protective cellular immunity. Their adjuvant potency is a factor of inflammasome activation and enhanced antigen cross-presentation by dendritic cells (DCs), but how antigen cross-presentation is induced is not clear. Here we show that SBAs uniquely induce intracellular lipid bodies (LBs) in the CD11b+ DC subset in vitro and in vivo. Using genetic and pharmacological interference in models for vaccination and in situ tumour ablation, we demonstrate that LB induction is causally related to the saponin-dependent increase in cross-presentation and T-cell activation. These findings link adjuvant activity to LB formation, aid the application of SBAs as a cancer vaccine component, and will stimulate development of new adjuvants enhancing T-cell-mediated immunity.


Figures

Figure 1
Figure 1. Saponin-based adjuvants induce cross-presentation in dendritic cells.
(a,b) Tetramer staining of OVA specific T cells in draining lymph nodes, 10 days following s.c. injection of 20 μg OVA and/or 30 μg ISCOMs (a, vaccination), or 7 days following co-treatment of established B16OVA melanomas (5–8 mm diameter) with in situ tumour ablation and 30 μg peritumourally injected ISCOMs (b, Cryo-ablation). (c,d) In vitro B3Z cross-presentation assays demonstrating a concentration-dependent increase in cross-presentation of OVA, only when Matrix C ISCOMs was added. GM-CSF-cultured BMDCs were exposed to the indicated compounds and 80 μg ml−1 OVA protein for 5 h, washed and co-cultured o/n with B3Z cells, which produce β-galactosidase upon recognition of the OVA peptide in Kb. Data in (d) are excerpts from larger titrations. For the non-reactive adjuvants the maximum concentration used is shown (1.5 μl ml−1), for the ISCOMs the concentration shown is 400 ng ml−1. (e) In vitro cross-presentation after 5 h exposure to 400 ng ml−1 of various SBAs or controls. This contains a crude saponin mixture not purified for immunoactive fractions, commercially available immunoactive saponin fractions (VX, SS and FC) and ISCOM structures made with these saponins according to an ‘open access' protocol. Passive peptide loading with OVA Kb peptides was used to demonstrate viability and/or equal MHC-I levels. Similar results were obtained in two to three independent experiments. Statistical analysis was done using a one or two-way ANOVA with post hoc Bonferroni or Tukey tests.
Figure 2
Figure 2. SBA-induced cross-presentation is independent of co-stimulation or ROS.
(a) FACS analysis of surface markers CD206 (mannose receptor), MHC-I, and MHC-II. GM-CSF BMDCs were exposed for 5 h to ISCOMs or medium, and processed for FACS staining. Open black lines represent the corresponding isotype controls. Filled grey lines show the medium-treated cells, while the open red lines are the ISCOM treated samples. (b) FACS analysis of DC maturation markers CD80 and CD86 after 18 h stimulation with ISCOMs or 1 μg ml−1 CpG. (c) Bone-marrow of indicated knockout mice was used to generate GM-CSF BMDCs. Cells were exposed for 5 h to medium or ISCOMs, washed and co-cultured o/n with B3Z cells. External peptide pulsing (5 pg ml−1, 30 min) was used to control for viability and/or MHC-I levels. (d) Antigen uptake and processing as analysed by FACS. BMDCs were given 0.25 mg ml−1 OVA coupled to the fluorophore Alexa647, or 1 μg ml−1 DQ-OVA, during the 5 h exposure time to medium or ISCOMs. DQ-OVA will start to fluoresce once degraded. (e) Total cellular reactive oxygen species (ROS) were measured using the DHR123 probe. GM-CSF cultured BMDCs were plated in serum-free medium and pretreated for 10 min with 0.5 or 50 μM dihydrorhodamine 123. Next, ISCOMs or 1 μg ml−1 PMA was added and cells were incubated for 45 min before analysis by FACS. (f) In vitro cross-presentation in the presence of NADPH oxidase inhibitors. Indicated compounds and concentrations were added during the 5 h exposure period to ISCOMs. (g) In vitro cross-presentation using Gp91phox−/− bonemarrow DCs. Data in (e) represent single values in titration, whereas the other data show means from triplicates with s.e.m. Data are representative figures from two to three individual experiments. Statistical analyses were performed using two way ANOVA with post hoc Bonferroni tests.
Figure 3
Figure 3. SBAs induce in vitro and in vivo lipid bodies in correlation with cross-presentation.
(ac) GM-CSF-cultured BMDCs following 5 h exposure to the indicated adjuvants were fixed and stained with the LB probe Bodipy493/503. Nuclei were counterstained with DAPI, and cells were analysed by confocal microscopy. (a) CLSM image showing SBA-induced LBs. (b) Quantification of lipid bodies following exposure to OVA alone, AlPO4, non-immunoactive saponin, FC saponin, or ISCOMs. Numbers of lipid bodies per cell were obtained from 90–150 cells found in 15 randomly taken CLSM images, and divided over three strata. (c) LB staining with counterstaining for ADRP (df) 32 h time-course showing concomitant increases in LB numbers (d,e) and cross-presentation (f). (g,h) In vitro cross-presentation assay on isolated lymph node CD11c+ DCs using OT-I cells (left) or B3Z cells (right) as a readout. (g) Three hundred microgram endotoxin-free OVA protein was injected s.c. on the femur of WT C57Bl/6 mice, with or without 30 μg ISCOMs. Twelve hours later, draining lymph nodes were harvested from which CD11c+ cells were isolated using MACS beads. Next, these cells were co-cultured with the reporter cells. CD69 levels on CD8+CD90.1+ OT-I cells were measured after 1 day, while B3Z cells were analysed after 2 days. (h) Established B16OVA melanomas (5–8 mm diameter) were injected i.t. with a booster shot of OVA (20 μg), after which they were treated with in situ tumour ablation and 30 μg peritumourally injected ISCOMs. 12 h later draining lymph nodes were harvested from which CD11c+ cells were isolated using MACS beads. Next, these cells were co-cultured with the reporter cells like in g. (i) Quantification of LBs per cell using CLSM (left) or FACS (right), on ex vivo CD11c+ cells as treated and isolated under (g). All data were reproduced in two to three independent experiments. Statistical analyses were performed using two-way ANOVA with post hoc Bonferroni tests, or Student's t-test for i.
Figure 4
Figure 4. Responsiveness to SBAs in vitro is unique to CD11b+ DCs with monocytic origin.
(a) In vitro cross-presentation assay using GM-CSF- or Flt3-L-propagated DCs. (b) Confocal images with LB quantifications from Flt3-L-generated BMDCs exposed for 5 h to medium or ISCOMs. (c) Gating strategy of Flt3-L DCs. Sorted populations are gate 1 (pDCs), gate 3 (CD8α+ DCs) and gate 4 (CD11b+ DCs). (d) In vitro cross-presentation assay using the populations as sorted under c. (e) Gating strategy of GM-CSF DCs. Sorted populations are gate 2 (MHCIIlo CD11bhi), gate 3 (MHCIIint CD11bint) and gate 4 (MHCIIhi CD11bint). (f) In vitro cross-presentation assay using the populations as sorted under e. (g) CLSM image and LB quantification of populations as sorted under e, after 5 h exposure to ISCOMs or medium. (h) In vitro cross-presentation assay on Flt3-L- or GM-CSF-cultured bonemarrow DCs. In the 10 day Flt3-L cultures, medium was supplemented for the last 48 h with 20 ng ml−1 GM-CSF or medium. (i) In vitro cross-presentation assays on Flt3-L-cultured DCs, receiving GM-CSF for 72 h after the end of culture. In the left panel the entire day 10 cultures were supplemented with GM-CSF for another 72 h, after which the resulting populations were sorted (Supplementary Fig. 8). In the right panel the day 10 cultures were sorted, after which the individual populations were treated with fresh Flt3-L or GM-CSF. All data were reproduced in two to three independent experiments. Statistical analyses were performed using two-way ANOVA with post hoc Bonferroni tests.
Figure 5
Figure 5. Lymph node CD11b+ DCs uniquely possess the ability to respond to SBAs in vivo.
(a) Gating strategy for naive splenocytes. Sorted populations are gate 2 (CD8α+ DCs) and gate 3 (CD11b+ DCs). (b) In vitro cross-presentation assay using the populations as sorted under a. (c) Gating strategy for naïve lymph nodes. Lin- was defined as B220- and Ly6G-. Sorted populations are gate 4 (LN resident CD8α+ DCs), gate 5 (LN resident CD11b+ DCs), gate 6 (LN migratory CD103 DCs), and gate 7 (LN migratory CD11b+ DCs). (d) In vitro cross-presentation assay using the populations as sorted under c. (eg) Mice were injected with Flt3-L excreting B16 melanomas to expand endogenous DC pools. After 12 days, pooled lymph nodes were harvested and subjected to FACS sorting. (e) Gating strategy, in which sorted populations are gates 1 to 4. Right panels show additional stainings on populations 1 to 3. (f) In vitro cross-presentation assay using populations as sorted under e. Sorted cells were exposed for 5 h to the indicated compounds (ISCOMs 800 ng ml−1, OVA 300 μg ml−1, PLGA nano-particles corresponding to 30 μg ml−1 OVA). (g) LB quantification in populations as sorted under e. All data were reproduced in two independent experiments. Statistical analyses were performed using two-way ANOVA with post hoc Bonferroni tests.
Figure 6
Figure 6. SBA-induced cross-presentation is dependent on LB formation.
(a) LB quantification as measured by CLSM in cells treated for 5 h with the indicated LB inhibitors: (Xanthohumol: 85 μM, A922500: 40 μM, Triacsin C: 10 μM, TOFA: 120 μM). (b) In vitro cross-presentation assays in the presence of the indicated LB inhibitors (inhibited enzymes in brackets). (c,d) Flowcytometry-based analysis of LB content. Wild-type (c), or Igtp+/+ and Igtp−/− (d) BMDCs were exposed to 800 ng ml−1 non-immunoactive saponin, FC saponin, ISCOMs or 250 ng ml−1 IFNγ for 5 h, washed, and stained with Bodipy493-503. (e) In vitro cross-presentation assay using IGTP knockout DCs. (f) Metabolic activity/viability (MTT) assay used to demonstrate cytosolic translocation of indicated toxins. (g) MTT assay showing endosomal acidification is needed for cytosolic translocation. Bafilomycin A1, (at 100 nM) is an inhibitor of endosomal v-ATPase, and thus endosomal acidification. (h) Quantification of LB induction in the presence of ISCOMs and Bafilomycin A1. (i) MTT assay showing that inhibition of LB induction does not abrogate cytosolic translocation. During the exposure to ISCOMs/Cyt C, the LB inhibitors TOFA (120 μM) and A922500 (60 μM) were added. (j) In vitro OT-I cross-presentation assay on isolated LN DCs from OVA protein or peptide-vaccinated wild-type, Igtp−/−, or Adrp−/− mice. (k) B16-OVA tumour bearing mice were treated with cryo-ablation, directly followed by peritumoural injection of 30 μg ISCOMs. A mixture of xanthohumol (500 μg) and A922500 (150 μg) was injected peritumourally, four hrs before ablation and directly after the ablation. 12 h later, draining LN CD11c+ cells were isolated that entered the cross-presentations assays. LacZ content in B3Z cells was analysed after 2 days. All data represent means with s.e.m., except for d where data represent mean MFI values normalized to medium values. Similar data were obtained in two to three independent experiments. Statistical analyses were done using ANOVA with post hoc Bonferroni tests.

References

    1. Kensil C. R., Patel U., Lennick M. & Marciani D. Separation and characterization of saponins with adjuvant activity from Quillaja saponaria Molina cortex. J. Immunol. 146, 431–437 (1991). - PubMed
    1. Lorent J. H., Quetin-Leclercq J. & Mingeot-Leclercq M. P. The amphiphilic nature of saponins and their effects on artificial and biological membranes and potential consequences for red blood and cancer cells. Org. Biomol. Chem. 12, 8803–8822 (2014). - PubMed
    1. Morein B., Sundquist B., Hoglund S., Dalsgaard K. & Osterhaus A. Iscom, a novel structure for antigenic presentation of membrane proteins from enveloped viruses. Nature 308, 457–460 (1984). - PubMed
    1. Lovgren Bengtsson K., Morein B. & Osterhaus A. D. ISCOM technology-based Matrix M adjuvant: success in future vaccines relies on formulation. Expert Rev. Vaccines 10, 401–403 (2011). - PubMed
    1. Maraskovsky E. et al.. Development of prophylactic and therapeutic vaccines using the ISCOMATRIX adjuvant. Immunol. Cell Biol. 87, 371–376 (2009). - PubMed

Publication types

MeSH terms