. 2016 Nov 7:6:36493.
doi: 10.1038/srep36493.

Big genomics and clinical data analytics strategies for precision cancer prognosis

Affiliations

Big genomics and clinical data analytics strategies for precision cancer prognosis

Ghim Siong Ow et al. Sci Rep. .

Abstract

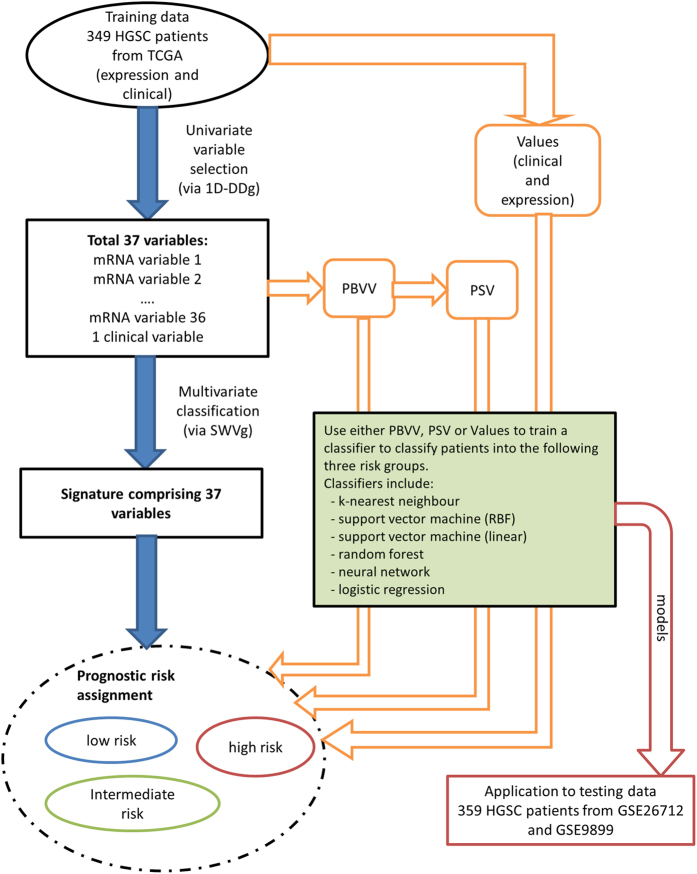
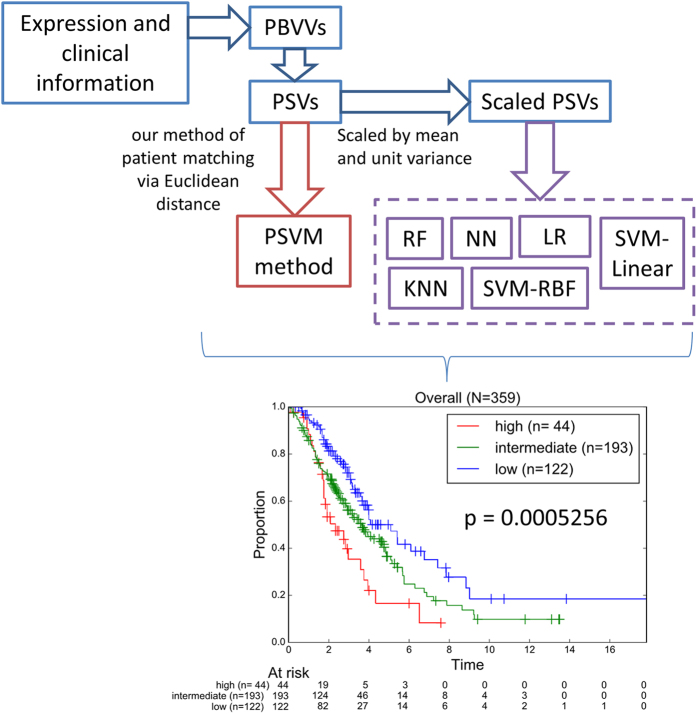
The field of personalized and precise medicine in the era of big data analytics is growing rapidly. Previously, we proposed our model of patient classification termed Prognostic Signature Vector Matching (PSVM) and identified a 37 variable signature comprising 36 let-7b associated prognostic significant mRNAs and the age risk factor that stratified large high-grade serous ovarian cancer patient cohorts into three survival-significant risk groups. Here, we investigated the predictive performance of PSVM via optimization of the prognostic variable weights, which represent the relative importance of one prognostic variable over the others. In addition, we compared several multivariate prognostic models based on PSVM with classical machine learning techniques such as K-nearest-neighbor, support vector machine, random forest, neural networks and logistic regression. Our results revealed that negative log-rank p-values provides more robust weight values as opposed to the use of other quantities such as hazard ratios, fold change, or a combination of those factors. PSVM, together with the classical machine learning classifiers were combined in an ensemble (multi-test) voting system, which collectively provides a more precise and reproducible patient stratification. The use of the multi-test system approach, rather than the search for the ideal classification/prediction method, might help to address limitations of the individual classification algorithm in specific situation.


Figures

Figure 1
Figure 1. Flow chart of analyses performed in this study.
HGSC patients from TCGA were used as the training data (comprising expression and clinical information). Univariate variable selection method (1D-DDg) was used to identify 37 variables which could independently stratify patients into low or high-risk. For each patient in the training cohort, the overall risk group (low, intermediate or high-risk) was summarized and assigned based on the SWVg method. Each patient can be represented by either its expression vector, PBVV or PSV. Each of the vector types was used as the variable vectors in machine learning algorithms such as k-nearest neighbour, support vector machine, random forest, neural network or logistic regression. Each of the models was assessed via 10-fold cross validation. The model was applied to an independent testing dataset comprising of 359 HGSC patients.
Figure 2
Figure 2. Correlation (non-diagonal plots) and distribution plots (diagonal plots) for the different weights across 37 variables.
Weight (B) inverse P; Weight (C) negative log P; Weight (D) hazard ratio; Weight (E) negative log P X HR; Weight (F) negative log P + HR. The p-values were assessed via the Wald test and the hazard ratios of the individual variables were assessed via the Cox Proportional Hazards model.
Figure 3
Figure 3
(A) Training classification of the TCGA via SWVg method with different weight parameters. (B) Testing classification of the GSE26712 and GSE9899 patient cohorts via matching to the nearest reference patient from the training cohort. Weight (A) constant weight; Weight (B) inverse P; Weight (C) negative log P; Weight (D) hazard ratio; Weight (E) negative log P X HR; Weight (F) negative log P + HR. The p-values were assessed via the Wald test and the hazard ratios of the individual variables were assessed via the Cox Proportional Hazards model.
Figure 4
Figure 4. Training, validation and testing of the classifier.
(A) Mean accuracies of the ten-fold cross validation of our method (PSVM) as well as for each machine learning algorithm when applied to TCGA training cohort comprising 349 HGSC patients. The vertical bars represent the standard deviation of the accuracy values. The PSVM method is based on un-scaled PSV variables whereas the classical machine learning techniques were based on scaled PSV variables. Classification curves of the testing dataset from (B) our PSVM method, in comparison with other classical machine learning algorithms including (C) k-nearest neighbor, (D) support vector machine (RBF kernel), (E) support vector machine (linear kernel), (F) random forest, (G) neural network and (H) logistic regression. The p-values were assessed via log-rank test. Abbreviations: OURS – our method; KNN – k-nearest neighbor; SVM-RBF – support vector machine with radial basis function kernel; SVM-linear – support vector machine with linear kernel; RF – random forest; NN – neural network; LR – logistic regression.
Figure 5
Figure 5. Kaplan-Meier plots of patients’ classification from the independent test cohort.
The grouping information was obtained from the combination of grouping information from our PSVM method (derived from un-scaled PSVs) and the five machine learning techniques (KNN, SVM-RBF, SVM-linear, RF, NN, LR, trained from scaled PSVs).

References

    1. Panahiazar M., Taslimitehrani V., Jadhav A. & Pathak J. Empowering Personalized Medicine with Big Data and Semantic Web Technology: Promises, Challenges, and Use Cases. Proc IEEE Int Conf Big Data 2014, 790–795, doi: 10.1109/BigData.2014.7004307 (2014). - DOI - PMC - PubMed
    1. Viceconti M., Hunter P. & Hose R. Big data, big knowledge: big data for personalized healthcare. IEEE J Biomed Health Inform 19, 1209–1215, doi: 10.1109/JBHI.2015.2406883 (2015). - DOI - PubMed
    1. Raghupathi W. & Raghupathi V. Big data analytics in healthcare: promise and potential. Health Inf Sci Syst 2, 3, doi: 10.1186/2047-2501-2-3 (2014). - DOI - PMC - PubMed
    1. Hofker M. H., Fu J. & Wijmenga C. The genome revolution and its role in understanding complex diseases. Biochim Biophys Acta 1842, 1889–1895, doi: 10.1016/j.bbadis.2014.05.002 (2014). - DOI - PubMed
    1. Li J. et al.. Identification of high-quality cancer prognostic markers and metastasis network modules. Nature communications 1, 34, doi: 10.1038/ncomms1033 (2010). - DOI - PMC - PubMed

Publication types