

DMS-MaPseq for genome-wide or targeted RNA structure probing in vivo
- PMID: 27819661
- PMCID: PMC5508988
- DOI: 10.1038/nmeth.4057
DMS-MaPseq for genome-wide or targeted RNA structure probing in vivo
Abstract
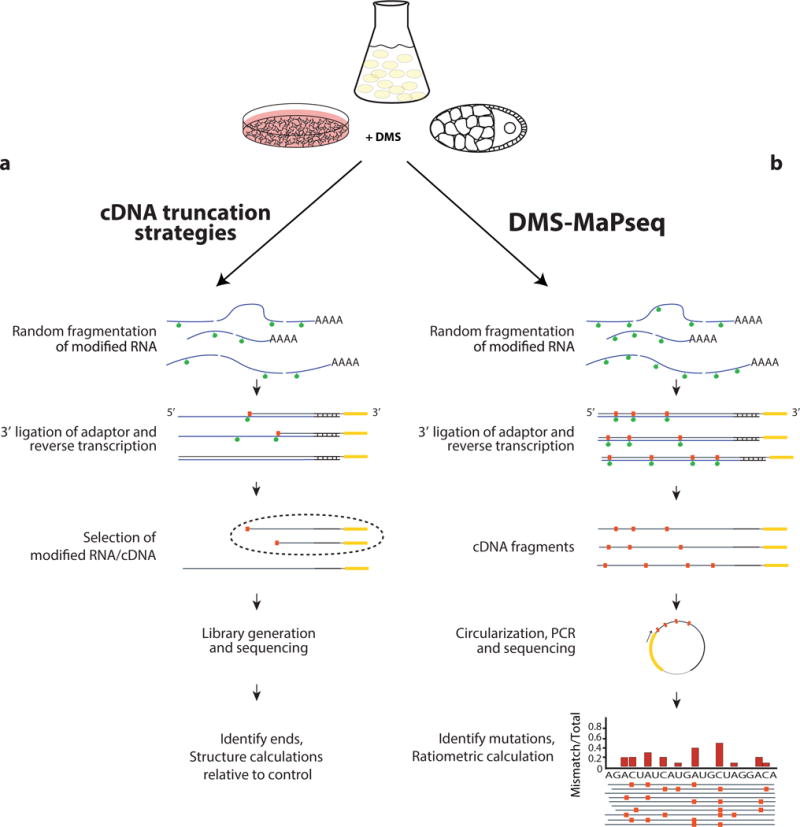
Coupling of structure-specific in vivo chemical modification to next-generation sequencing is transforming RNA secondary structure studies in living cells. The dominant strategy for detecting in vivo chemical modifications uses reverse transcriptase truncation products, which introduce biases and necessitate population-average assessments of RNA structure. Here we present dimethyl sulfate (DMS) mutational profiling with sequencing (DMS-MaPseq), which encodes DMS modifications as mismatches using a thermostable group II intron reverse transcriptase. DMS-MaPseq yields a high signal-to-noise ratio, can report multiple structural features per molecule, and allows both genome-wide studies and focused in vivo investigations of even low-abundance RNAs. We apply DMS-MaPseq for the first analysis of RNA structure within an animal tissue and to identify a functional structure involved in noncanonical translation initiation. Additionally, we use DMS-MaPseq to compare the in vivo structure of pre-mRNAs with their mature isoforms. These applications illustrate DMS-MaPseq's capacity to dramatically expand in vivo analysis of RNA structure.
Conflict of interest statement
Thermostable group II intron reverse transcriptase (TGIRT) enzymes and methods for their use are the subject of patents and patent applications that have been licensed by the University of Texas and East Tennessee State University to InGex, LLC. A.M.L. and the University of Texas are minority equity holders in InGex, LLC and receive royalty payments from the sale of TGIRT enzymes and the licensing of intellectual property. The other authors declare no competing financial interests.
Figures
Similar articles
-
Genome-wide probing RNA structure with the modified DMS-MaPseq in Arabidopsis.Methods. 2019 Feb 15;155:30-40. doi: 10.1016/j.ymeth.2018.11.018. Epub 2018 Nov 29. Methods. 2019. PMID: 30503825
-
In Vivo RNA Structure Probing with DMS-MaPseq.Methods Mol Biol. 2022;2404:299-310. doi: 10.1007/978-1-0716-1851-6_16. Methods Mol Biol. 2022. PMID: 34694616
-
Viral RNA structure analysis using DMS-MaPseq.Methods. 2020 Nov 1;183:68-75. doi: 10.1016/j.ymeth.2020.04.001. Epub 2020 Apr 3. Methods. 2020. PMID: 32251733 Free PMC article. Review.
-
DMS-MaPseq for Genome-Wide or Targeted RNA Structure Probing In Vitro and In Vivo.Methods Mol Biol. 2021;2254:219-238. doi: 10.1007/978-1-0716-1158-6_13. Methods Mol Biol. 2021. PMID: 33326078
-
Probing RNA structure in vivo.Curr Opin Struct Biol. 2019 Dec;59:151-158. doi: 10.1016/j.sbi.2019.07.008. Epub 2019 Sep 13. Curr Opin Struct Biol. 2019. PMID: 31521910 Free PMC article. Review.
Cited by
-
A compact regulatory RNA element in mouse Hsp70 mRNA.NAR Mol Med. 2024 Jan 29;1(1):ugae002. doi: 10.1093/narmme/ugae002. eCollection 2024 Jan. NAR Mol Med. 2024. PMID: 38318492 Free PMC article.
-
Comprehensive in-vivo secondary structure of the SARS-CoV-2 genome reveals novel regulatory motifs and mechanisms.bioRxiv [Preprint]. 2020 Jul 10:2020.07.10.197079. doi: 10.1101/2020.07.10.197079. bioRxiv. 2020. Update in: Mol Cell. 2021 Feb 4;81(3):584-598.e5. doi: 10.1016/j.molcel.2020.12.041. PMID: 32676598 Free PMC article. Updated. Preprint.
-
Structure-based screening for functional non-coding RNAs in fission yeast identifies a factor repressing untimely initiation of sexual differentiation.Nucleic Acids Res. 2022 Oct 28;50(19):11229-11242. doi: 10.1093/nar/gkac825. Nucleic Acids Res. 2022. PMID: 36259651 Free PMC article.
-
Manganese Ions Individually Alter the Reverse Transcription Signature of Modified Ribonucleosides.Genes (Basel). 2020 Aug 18;11(8):950. doi: 10.3390/genes11080950. Genes (Basel). 2020. PMID: 32824672 Free PMC article.
-
Cycloaddition enabled mutational profiling of 5-vinyluridine in RNA.Chem Commun (Camb). 2023 Mar 14;59(22):3257-3260. doi: 10.1039/d3cc00043e. Chem Commun (Camb). 2023. PMID: 36815680 Free PMC article.
References
Online Methods References
-
- Zubradt M, et al. Genome-wide DMS-MaPseq for in vivo RNA structure determination. Protoc Exch. 2016 http://dx.doi.org/10.1038/protex.2016.068. - DOI
-
- Zubradt M, et al. Target-specific DMS-MaPseq for in vivo RNA structure determination. Protoc Exch. 2016 http://dx.doi.org/10.1038/protex.2016.069. - DOI
Publication types
MeSH terms
Substances
Grants and funding
LinkOut - more resources
Full Text Sources
Other Literature Sources
Molecular Biology Databases
