. 2016 Dec;34(12):1256-1263.
doi: 10.1038/nbt.3704. Epub 2016 Nov 7.

Measurement of bacterial replication rates in microbial communities

Affiliations

Measurement of bacterial replication rates in microbial communities

Christopher T Brown et al. Nat Biotechnol. 2016 Dec.

Abstract

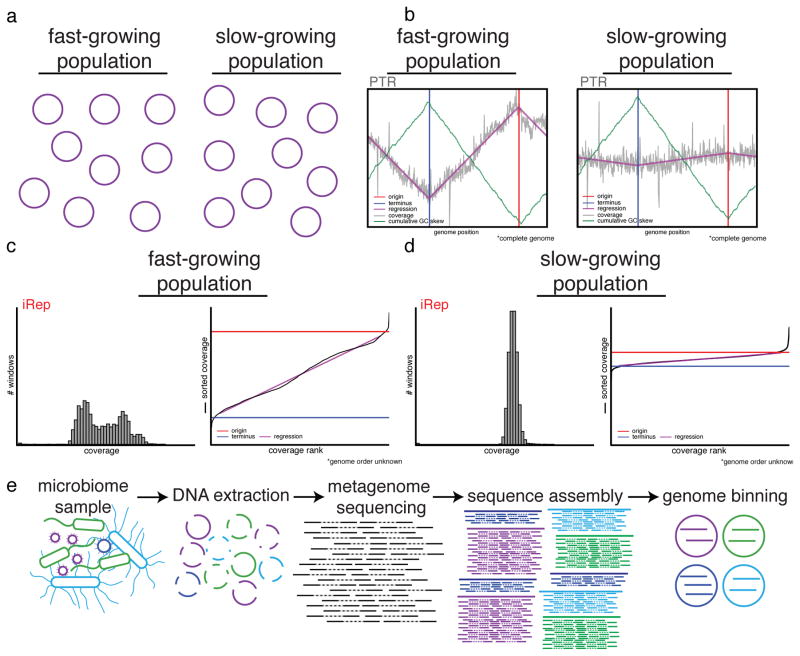
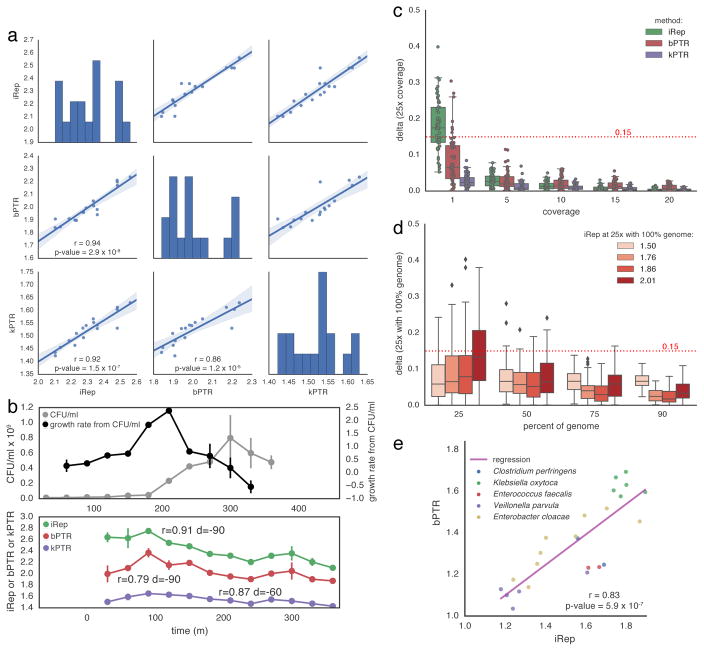
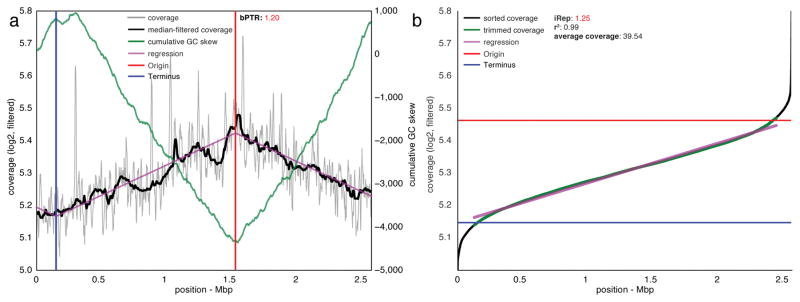
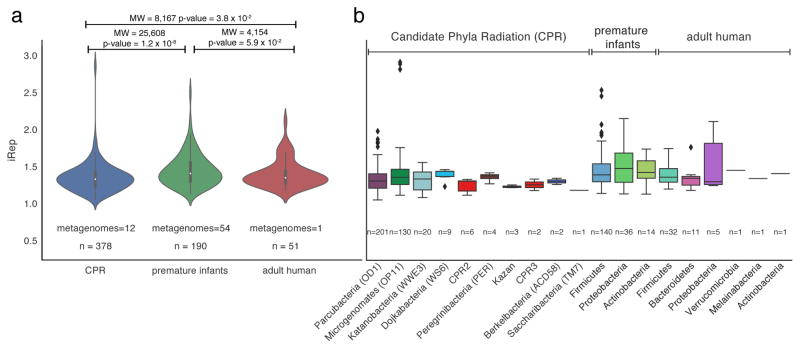
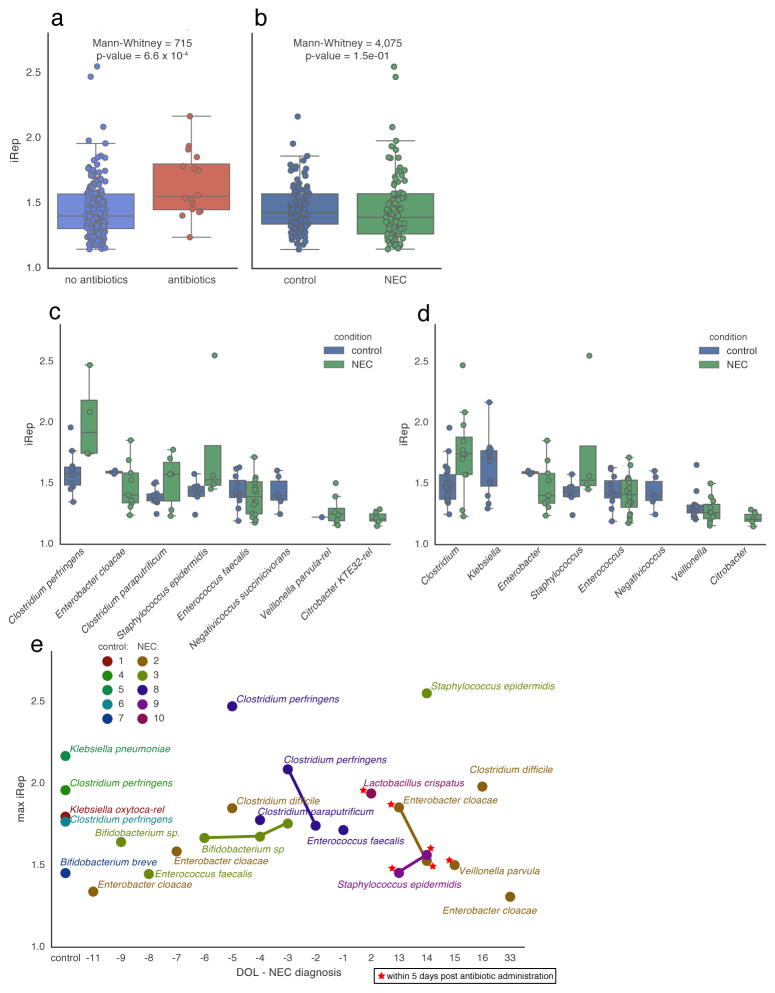
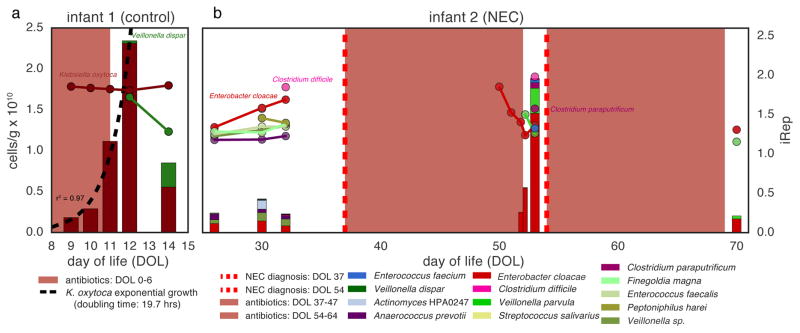
Culture-independent microbiome studies have increased our understanding of the complexity and metabolic potential of microbial communities. However, to understand the contribution of individual microbiome members to community functions, it is important to determine which bacteria are actively replicating. We developed an algorithm, iRep, that uses draft-quality genome sequences and single time-point metagenome sequencing to infer microbial population replication rates. The algorithm calculates an index of replication (iRep) based on the sequencing coverage trend that results from bi-directional genome replication from a single origin of replication. We apply this method to show that microbial replication rates increase after antibiotic administration in human infants. We also show that uncultivated, groundwater-associated, Candidate Phyla Radiation bacteria only rarely replicate quickly in subsurface communities undergoing substantial changes in geochemistry. Our method can be applied to any genome-resolved microbiome study to track organism responses to varying conditions, identify actively growing populations and measure replication rates for use in modeling studies.


Conflict of interest statement

Competing Financial Interests

The authors declare no competing financial interests.

Figures

Figure 1
Figure 1. iRep determines replication rates for bacteria using genome-resolved metagenomics
(a) Populations of bacteria undergoing rapid cell division differ from slowly growing populations in that the individual cells of a growing population are more actively in the process of replicating their genomes (purple circles). (b) Differences in genome copy number across a population of replicating cells can be determined based on sequencing read coverage over complete genome sequences. The ratio between the coverage at the origin (“peak”) and terminus (“trough”) of replication (PTR) relates to the growth rate of the population. The origin and terminus can be determined based on cumulative GC skew. (c–d) If no complete genome sequence is available, it is possible to calculate the replication rate based on the distribution of coverage values across a draft-quality genome using the iRep method. Coverage is first calculated across overlapping segments of genome fragments. Growing populations will have a wider distribution of coverage values compared with stable populations (histograms). These values are ordered from lowest to highest, and linear regression is used to evaluate the coverage distribution across the genome in order to determine the coverage values associated with the origin and terminus of replication. iRep is calculated as the ratio of these values. (e) Genome-resolved metagenomics involves DNA extraction from a microbiome sample followed by DNA sequencing, assembly, and genome binning. Binning is the grouping together of assembled genome fragments that originated from the same genome. This can be done based on shared characteristics of each fragment, such as sequence composition, taxonomic affiliation, or abundance.
Figure 2
Figure 2. iRep is an accurate measure of in situ replication rates
(a) iRep, bPTR, and kPTR measurements made for cultured Lactobacillus gasseri were compared (r = Pearson’s r value), showing strong agreement between all methods. (b) Colony forming unit (CFU) counts were available for a subset of these samples, and used to calculate growth rates (n = 2). All methods were highly correlated with CFU-derived rates after first accounting for the delay between start of genome replication and observable change in population size (as noted previously). Replication rates from CFU data were adjusted by variable amounts before calculating correlations with sequencing-based rates (best correlation shown; d = time adjustment). CFU data are plotted with a −90 minute offset. (c) Using the L. gasseri data, minimum coverage requirements were determined for each method by first measuring the replication rate at 25× coverage, and then comparing to values calculated after simulating lower coverage. This shows that ≥5× coverage is required. (d) The minimum required genome fraction for iRep was determined by conducting 100 random fragmentations and subsets of the L. gasseri genome. Sequencing was subset to 5× coverage before calculating iRep to show the combined affect of low coverage and missing genomic information. With ≥75% of a genome sequence, most iRep measurements are accurate ±0.15. (e) iRep and bPTR measurements were calculated using five genome sequences assembled from premature infant metagenomes, showing that these methods are in agreement in the context of microbiome sequencing data.
Figure 3
Figure 3. iRep and bPTR calculations agree for a novel Deltaproteobacterium sampled from groundwater
(a) bPTR was calculated after determining the origin and terminus of replication based on regression to coverage calculated across the genome. Coverage was calculated for 10 Kbp windows sampled every 100 bp (see Online Methods). The ratio between the coverage at the origin and terminus was determined after applying a median filter. The cumulative GC skew pattern confirms the genome assembly and locations of the origin and terminus of replication. (b) iRep was determined by first calculating coverage over 5 Kbp windows sampled every 100 bp, and then the resulting values were sorted. High and low coverage windows were removed, and then the slope of the remaining (trimmed) values was determined and used to evaluate the coverage at the origin and terminus of replication: iRep was calculated as the ratio of these values. (r2 was calculated between trimmed data and the linear regression).
Figure 4
Figure 4. Replication rates were determined for Candidate Phyla Radiation (CPR) and human microbiome-associated organisms
iRep values were measured and compared across studies (a; MW = Mann-Whitney, n = number of measured replication rates), and compared based on taxonomic affiliation (b).
Figure 5
Figure 5. Elevated replication rates are associated with antibiotic administration and were detected prior to onset of necrotizing enterocolitis (NEC) in premature infants
iRep distributions were compared (a) between samples collected during or within five days after antibiotic administration and samples from other time points, and (b) between samples collected from NEC and control infants. (c–d) Comparison of iRep values measured for different species (c) and genera (d) sampled from NEC and control infants (shown are taxa with ≥5 observations from either group). (e) iRep for the fastest growing organism observed for each control infant, and for the fastest growing organism from each day of life (DOL) sampled for each NEC infant, reported relative to NEC diagnosis. High replication rates for members of the genus Clostridium were detected in infants surveyed prior to NEC diagnosis.
Figure 6
Figure 6. Absolute abundance (bars, left axis) and iRep (scatter plot, right axis) values for bacteria associated with two premature infants
The five days following antibiotic administration are indicated using a color gradient. (a) Exponential growth was determined by regression to K. oxytoca absolute abundance values. (b) Infant 2 was diagnosed with two cases of necrotizing enterocolitis (NEC) during the study period.

References

    1. Bremer H, Churchward G. An examination of the Cooper-Helmstetter theory of DNA replication in bacteria and its underlying assumptions. J Theor Biol. 1977;69:645–654. - PubMed
    1. Skovgaard O, Bak M, Løbner-Olesen A, Tommerup N. Genome-wide detection of chromosomal rearrangements, indels, and mutations in circular chromosomes by short read sequencing. Genome Research. 2011;21:1388–1393. - PMC - PubMed
    1. Prescott DM, Kuempel PL. Bidirectional replication of the chromosome in Escherichia coli. Proc Natl Acad Sci USA. 1972;69:2842–2845. - PMC - PubMed
    1. Wake RG. Visualization of reinitiated chromosomes in Bacillus subtilis. J Mol Biol. 1972;68:501–509. - PubMed
    1. Sernova NV, Gelfand MS. Identification of replication origins in prokaryotic genomes. Briefings in Bioinformatics. 2008;9:376–391. - PubMed

MeSH terms