

The Consistency in Macronutrient Oxidation and the Role for Epinephrine in the Response to Fasting and Overfeeding
- PMID: 27820654
- PMCID: PMC5413106
- DOI: 10.1210/jc.2016-3006
The Consistency in Macronutrient Oxidation and the Role for Epinephrine in the Response to Fasting and Overfeeding
Abstract
Context: In humans, dietary vs intraindividual determinants of macronutrient oxidation preference and the role of the sympathetic nervous system (SNS) during short-term overfeeding and fasting are unclear.
Objective: To understand the influence on metabolic changes of diet and SNS during 24 hours of overfeeding.
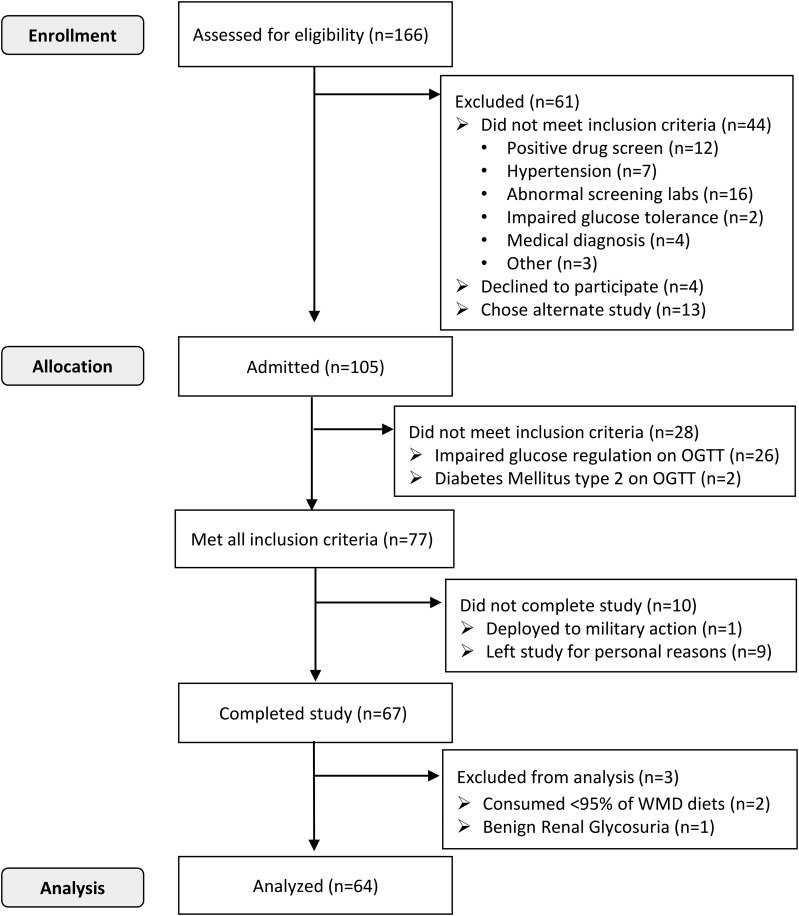
Design, setting, participants, and interventions: While residing on a clinical research unit, 64 participants with normal glucose regulation were assessed during energy balance, fasting, and four 24-hour overfeeding diets, given in random order. The overfeeding diets contained 200% of energy requirements and varied macronutrient proportions: (1) standard (50% carbohydrate, 20% protein, and 30% fat); (2) 75% carbohydrate; (3) 60% fat; and (4) 3% protein.
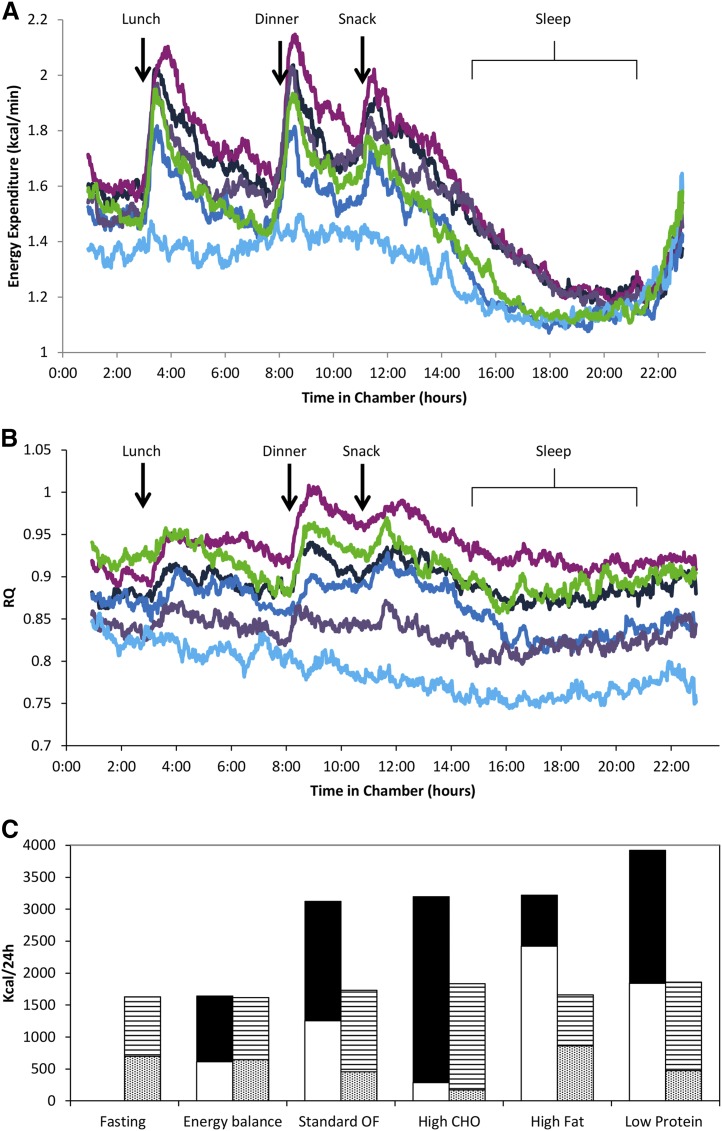
Main outcome measures: Twenty-four-hour energy expenditure (EE) and macronutrient oxidation rates were measured in an indirect calorimeter during the dietary interventions, with concomitant measurement of urinary catecholamines and free cortisol.
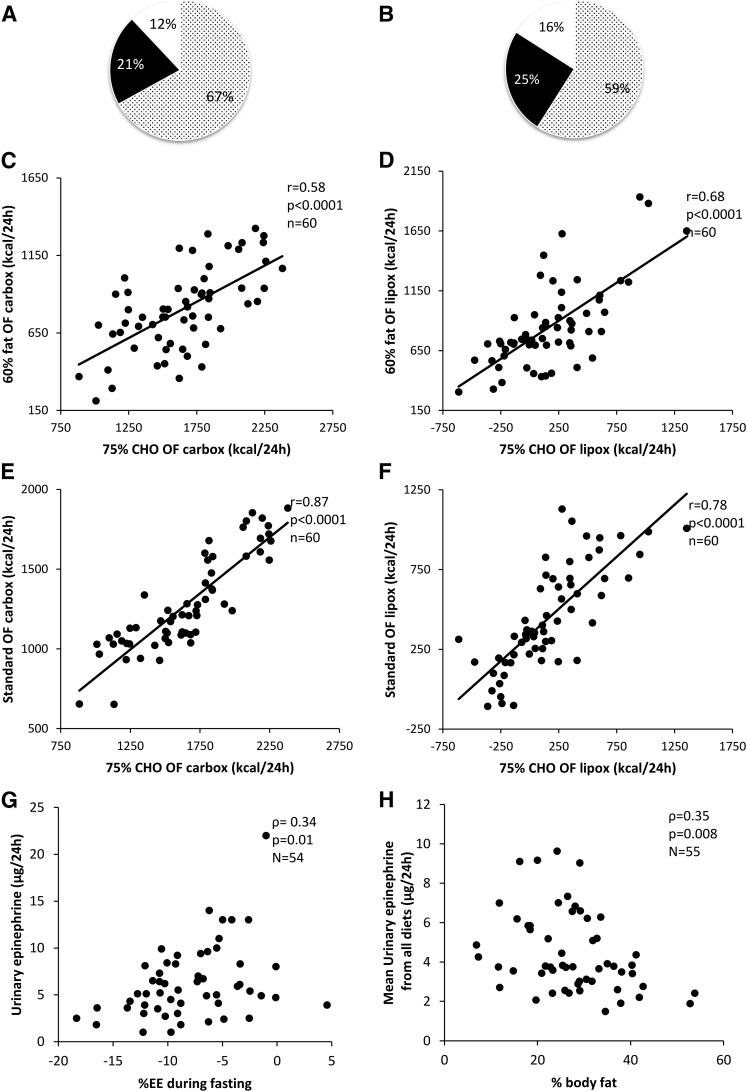
Results: EE decreased with fasting (-7.7% ± 4.8%; P < 0.0001) and increased with overfeeding. The smallest increase occurred during consumption of the diet with 3% protein (2.7% ± 4.5%; P = 0.001) and the greatest during the diet with 75% carbohydrate (13.8 ± 5.7%; P < 0.0001). Approximately 60% of macronutrient oxidation was determined by diet and 20% by intrinsic factors (P < 0.0001). Only urinary epinephrine differed between fasting and overfeeding diets (Δ = 2.25 ± 2.9 µg/24h; P < 0.0001). During fasting, higher urinary epinephrine concentrations correlated with smaller reductions in EE (ρ = 0.34; P = 0.01).
Conclusions: Independent from dietary macronutrient proportions, there is a strong individual contribution to fuel preference that remains consistent across diets. Higher urinary epinephrine levels may reflect the importance of epinephrine in maintaining EE during fasting.
Trial registration: ClinicalTrials.gov NCT00523627.
Copyright © 2017 by the Endocrine Society
Figures
References
-
- Apfelbaum M, Bostsarron J, Lacatis D. Effect of caloric restriction and excessive caloric intake on energy expenditure. Am J Clin Nutr. 1971;24(12):1405–1409. - PubMed
-
- Weyer C, Vozarova B, Ravussin E, Tataranni PA. Changes in energy metabolism in response to 48 h of overfeeding and fasting in Caucasians and Pima Indians. Int J Obes Relat Metab Disord. 2001;25(5):593–600. - PubMed
-
- Welle SL, Seaton TB, Campbell RG. Some metabolic effects of overeating in man. Am J Clin Nutr. 1986;44(6):718–724. - PubMed
Publication types
MeSH terms
Substances
Associated data
LinkOut - more resources
Full Text Sources
Other Literature Sources
Medical
