. 2016 Nov 7;17(1):880.
doi: 10.1186/s12864-016-3195-z.

Visualizing tumor evolution with the fishplot package for R

Affiliations

Visualizing tumor evolution with the fishplot package for R

Christopher A Miller et al. BMC Genomics. .

Abstract

Background: Massively-parallel sequencing at depth is now enabling tumor heterogeneity and evolution to be characterized in unprecedented detail. Tracking these changes in clonal architecture often provides insight into therapeutic response and resistance. In complex cases involving multiple timepoints, standard visualizations, such as scatterplots, can be difficult to interpret. Current data visualization methods are also typically manual and laborious, and often only approximate subclonal fractions.

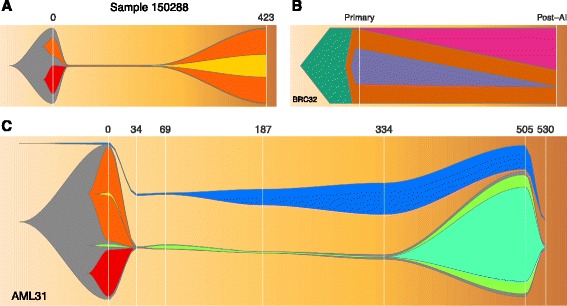
Results: We have developed an R package that accurately and intuitively displays changes in clonal structure over time. It requires simple input data and produces illustrative and easy-to-interpret graphs suitable for diagnosis, presentation, and publication.

Conclusions: The simplicity, power, and flexibility of this tool make it valuable for visualizing tumor evolution, and it has potential utility in both research and clinical settings. The fishplot package is available at https://github.com/chrisamiller/fishplot .


Figures

Fig. 1
Fig. 1
Visualizing tumor evolution with the fishplot package. Panel a A case of primary and relapsed AML. Panel b A breast cancer before and after neoadjuvant aromatase inhibitor therapy. Panel c An AML with complex clonal structure and 7 timepoints

References

    1. Miller CA, White BS, Dees ND, Griffith M, Welch JS, Griffith OL, et al. SciClone: inferring clonal architecture and tracking the spatial and temporal patterns of tumor evolution. PLoS Comput Biol. 2014;10:e1003665. doi: 10.1371/journal.pcbi.1003665. - DOI - PMC - PubMed
    1. Roth A, Khattra J, Yap D, Wan A, Laks E, Biele J, et al. PyClone: statistical inference of clonal population structure in cancer. Nat Methods. 2014;11:396–8. doi: 10.1038/nmeth.2883. - DOI - PMC - PubMed
    1. Deshwar AG, Vembu S, Yung CK, Jang GH, Stein L, Morris Q. PhyloWGS: reconstructing subclonal composition and evolution from whole-genome sequencing of tumors. Genome Biol. 2015;16:35. doi: 10.1186/s13059-015-0602-8. - DOI - PMC - PubMed
    1. Oesper L, Mahmoody A, Raphael BJ. THetA: inferring intra-tumor heterogeneity from high-throughput DNA sequencing data. Genome Biol. 2013;14:R80. doi: 10.1186/gb-2013-14-7-r80. - DOI - PMC - PubMed
    1. Qiao Y, Quinlan AR, Jazaeri AA, Verhaak RG, Wheeler DA, Marth GT. SubcloneSeeker: a computational framework for reconstructing tumor clone structure for cancer variant interpretation and prioritization. Genome Biol. 2014;15:443. doi: 10.1186/s13059-014-0443-x. - DOI - PMC - PubMed

Publication types

LinkOut - more resources