. 2017 Jan;205(1):317-332.
doi: 10.1534/genetics.116.189985. Epub 2016 Nov 7.

Inferring Heterozygosity from Ancient and Low Coverage Genomes

Affiliations

Inferring Heterozygosity from Ancient and Low Coverage Genomes

Athanasios Kousathanas et al. Genetics. 2017 Jan.

Abstract

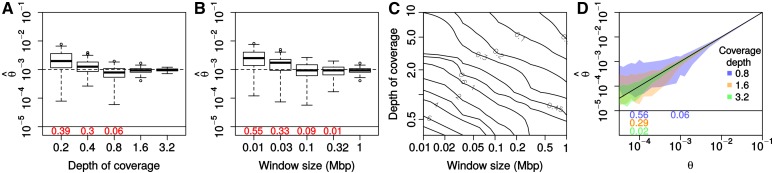
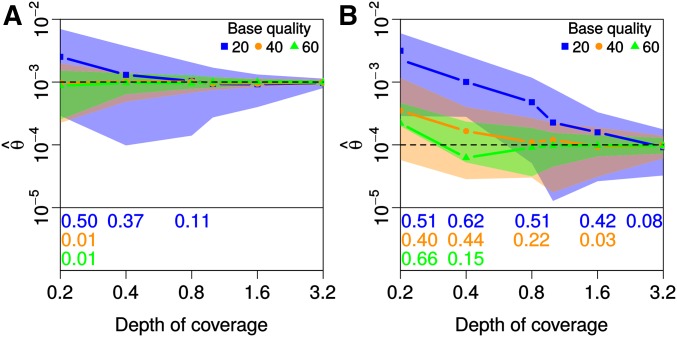
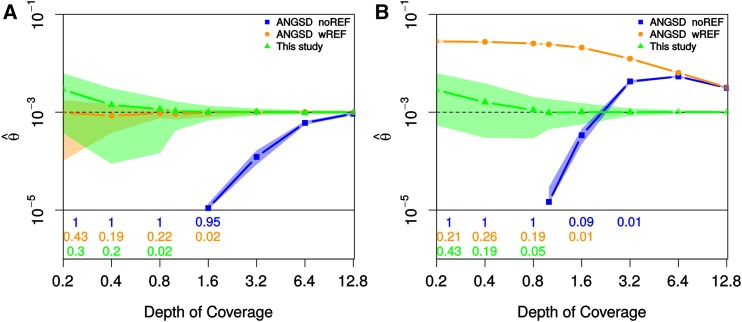
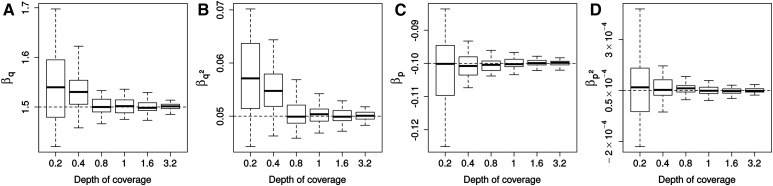
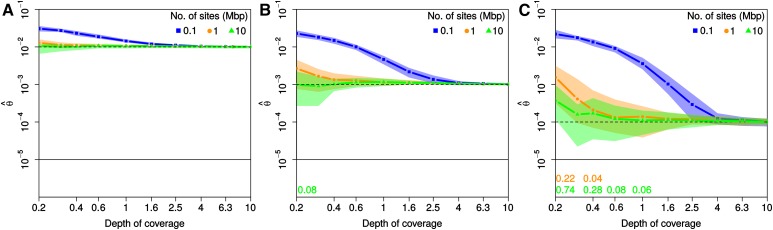
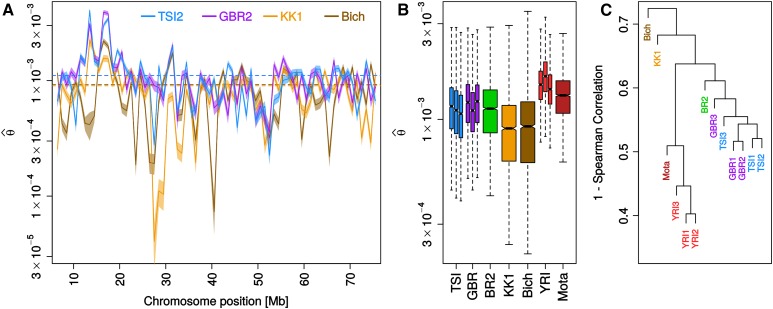
While genetic diversity can be quantified accurately from high coverage sequencing data, it is often desirable to obtain such estimates from data with low coverage, either to save costs or because of low DNA quality, as is observed for ancient samples. Here, we introduce a method to accurately infer heterozygosity probabilistically from sequences with average coverage [Formula: see text] of a single individual. The method relaxes the infinite sites assumption of previous methods, does not require a reference sequence, except for the initial alignment of the sequencing data, and takes into account both variable sequencing errors and potential postmortem damage. It is thus also applicable to nonmodel organisms and ancient genomes. Since error rates as reported by sequencing machines are generally distorted and require recalibration, we also introduce a method to accurately infer recalibration parameters in the presence of postmortem damage. This method does not require knowledge about the underlying genome sequence, but instead works with haploid data (e.g., from the X-chromosome from mammalian males) and integrates over the unknown genotypes. Using extensive simulations we show that a few megabasepairs of haploid data are sufficient for accurate recalibration, even at average coverages as low as [Formula: see text] At similar coverages, our method also produces very accurate estimates of heterozygosity down to [Formula: see text] within windows of about 1 Mbp. We further illustrate the usefulness of our approach by inferring genome-wide patterns of diversity for several ancient human samples, and we found that 3000-5000-year-old samples showed diversity patterns comparable to those of modern humans. In contrast, two European hunter-gatherer samples exhibited not only considerably lower levels of diversity than modern samples, but also highly distinct distributions of diversity along their genomes. Interestingly, these distributions were also very different between the two samples, supporting earlier conclusions of a highly diverse and structured population in Europe prior to the arrival of farming.

Keywords: ancient DNA; base recalibration; heterozygosity; low coverage; postmortem damage.


Figures

Figure 1
Figure 1
Power to infer θ from low coverage data. Results from sets of 100 simulations with PMD for different average coverage, window size, and true θ values. (A) Estimated θ^ in windows of 1 Mbp as a function of average coverage. (B) Estimated θ^ as a function of window size and fixed average coverage of 1×. (C) Accuracy of estimating θ=103 quantified as the median relative error (|1θ^/θ|) over replicates indicated by contour lines as a function of both coverage and window size. (D) True vs. estimated θ for different average coverages (see color legend). Polygons indicate the 95% quantile of estimated θ^ values among all replicates. The diagonal black line indicates the expectation for perfect estimation. In (A, B, and D), replicates resulting in a θ^<105 are not shown, but their fraction across replicates are printed below the horizontal black line.
Figure 2
Figure 2
Effect of sequencing quality on power to estimate θ. Results from sets of 100 simulations to assess the power to estimate θ of 104 and 103 for (A) and (B), respectively, for different average base qualities distributed normally with mean 20, 40, or 60, and a SD of 4.5, but truncated at 0. Polygon shapes indicate the 95% confidence interval for estimated θ^ over all replicates, excluding those resulting in θ^<105 (the fraction excluded are printed below the horizontal black line). All simulations were conducted with PMD, and the true PMD probability functions were used during the estimation.
Figure 3
Figure 3
Performance comparison with ANGSD. Results from sets of 100 simulations with (A) or without (B) PMD, comparing the performance of the method presented in this study and ANGSD in inferring θ. ANGSD was run either with the reference sequence provided (ANGSD_wREF) or without (ANGSD_noREF), in which case the major and minor alleles were first inferred in an additional step. For all simulations, we further assumed that base qualities were distributed normally, with μQ=20 and σQ=4.5, but truncated at 0. Polygon shapes indicate the 95% confidence interval for estimated θ^, but excluding replicates resulting in θ^<105. The fraction of replicates excluded are printed below the horizontal black line. When applying our method in simulations conducted with PMD, we provided the true PMD probability patterns during the estimation.
Figure 4
Figure 4
Accuracy in inferring recalibration parameters. Results from sets of 100 simulations are shown where sequence data from a haploid 1 Mbp region was simulated assuming a uniform distribution of observed quality scores (U[5,60]) that were then transformed to true qualities according to Equation 12, with βq=1.5,βq2=0.05,βp=0.1, βq2=5105, and all context coefficients at 1.0. All simulations were conducted with PMD, and the true PMD probability patterns were used during the estimation. The coverage values refer to the diploid regions of the simulated genome.
Figure 5
Figure 5
Accuracy in estimating θ using the full pipeline. Results from sets of 50 simulations, each consisting of data from a haploid as well as a diploid region used to conduct recalibration and inference of θ, respectively. The data sets in (A, B, and C) were simulated with different true values of θ, which are indicated with the dashed lines, and were 102, 103 and 104, respectively. Each data set was simulated with PMD as well as distorted base quality scores according to Equation 12, with βq=1.5, βq2=0.05, βp=0.1, and βq2=5105. In addition, these simulations also included context effects in that sequencing errors were simulated to result 1.5 times more often in a C or G than in an A or T. The average coverage indicated is for the diploid data, while the haploid data were simulated with half the coverage. Line segments and polygons correspond to the median and the 90% quantile of all estimated θ^ within the set of simulations, respectively.
Figure 6
Figure 6
Local diversity in ancient and modern humans. (A) Heterozygosity (θ) inferred in 1 Mb windows along the first 75 Mbp of chromosome 1 (excluding windows closer than 5 Mbp of the telomere) for two modern Europeans (TSI2 and GBR2), and two ancient European hunter-gatherers (KK1 and Bich). Solid lines indicate the MLE estimate, shading indicates the 95% confidence intervals and dashed lines the genome-wide median for each sample. (B) Distribution of estimates θ^ in 1 Mbp windows across the first 22 chromosomes of each sample. (C) Similarity in the pattern of θ along the genome visualized by hierarchical clustering using 1 − Spearman correlation as distance.

References

    1. Barnett D. W., Garrison E. K., Quinlan A. R., Strömberg M. P., Marth G. T., 2011. Bamtools: a C++ API and toolkit for analyzing and managing BAM files. Bioinformatics 27: 1691–1692. - PMC - PubMed
    1. Briggs A., Stenzel U., 2007. Patterns of damage in genomic DNA sequences from a Neandertal. Proc. Natl. Acad. Sci. USA 104: 14616–14621. - PMC - PubMed
    1. Bryc K., Patterson N., Reich D., 2013. A novel approach to estimating heterozygosity from low-coverage genome sequence. Genetics 195: 553–561. - PMC - PubMed
    1. Cabanski C. R., Cavin K., Bizon C., Wilkerson M. D., Parker J. S., et al. , 2012. ReQON: a bioconductor package for recalibrating quality scores from next-generation sequencing data. BMC Bioinformatics 13: 221. - PMC - PubMed
    1. Dempster A. A., Laird N. N., Rubin D. D. B., 1977. Maximum likelihood from incomplete data via the EM algorithm. J. R. Stat. Soc. B 39: 1–38.

Publication types