. 2017 Jan 1;77(1):27-40.
doi: 10.1158/0008-5472.CAN-16-1359. Epub 2016 Nov 7.

Dietary Emulsifier-Induced Low-Grade Inflammation Promotes Colon Carcinogenesis

Affiliations

Dietary Emulsifier-Induced Low-Grade Inflammation Promotes Colon Carcinogenesis

Emilie Viennois et al. Cancer Res. .

Abstract

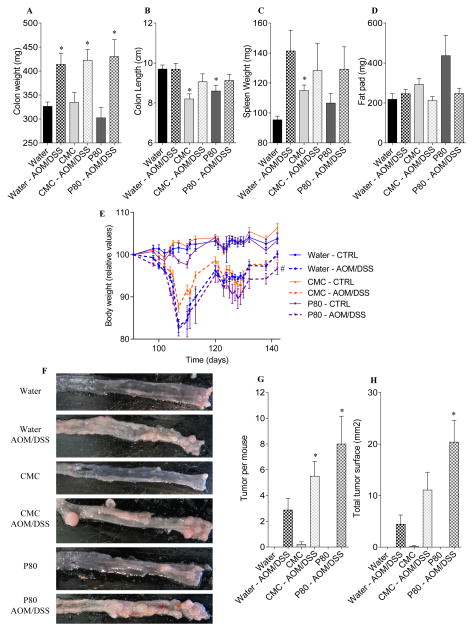
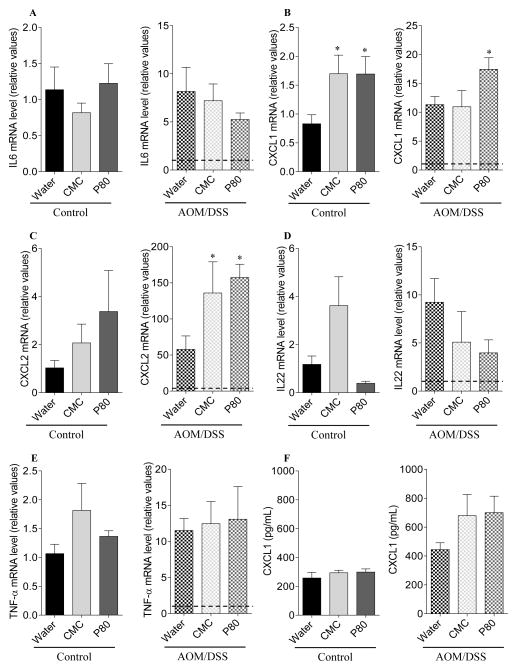
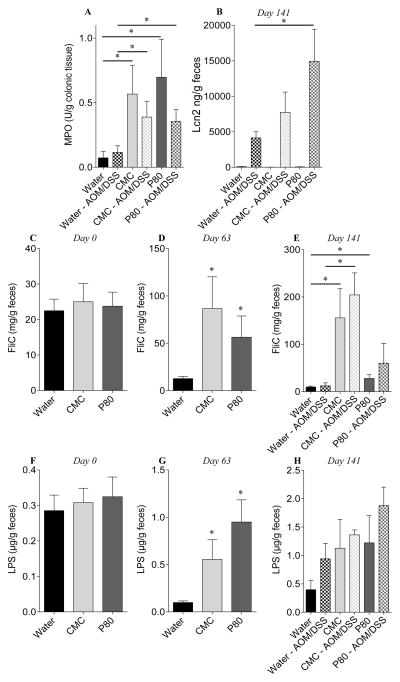
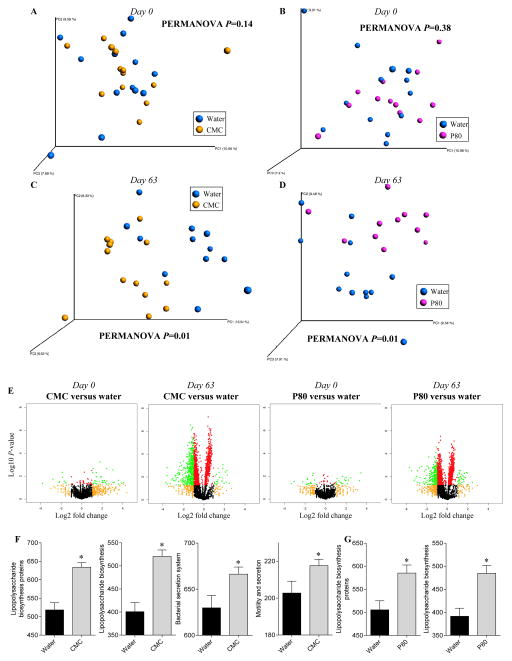
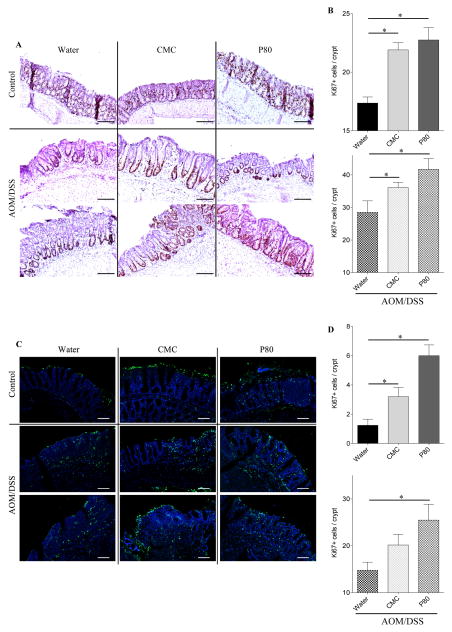
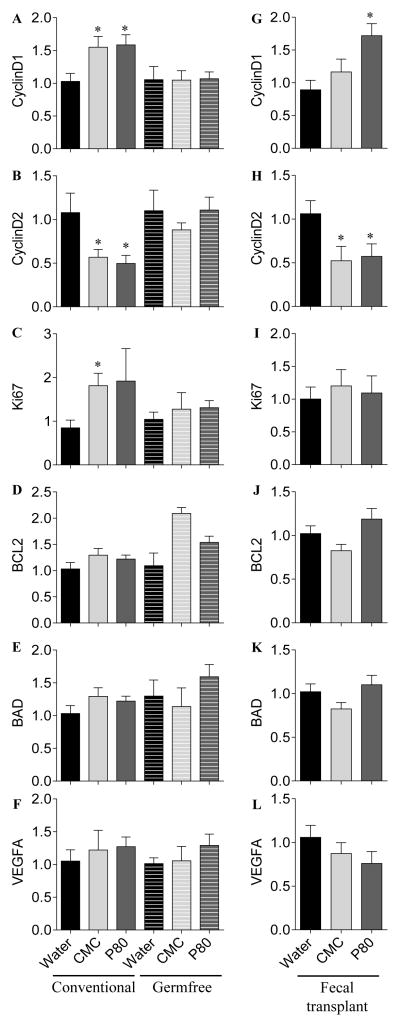
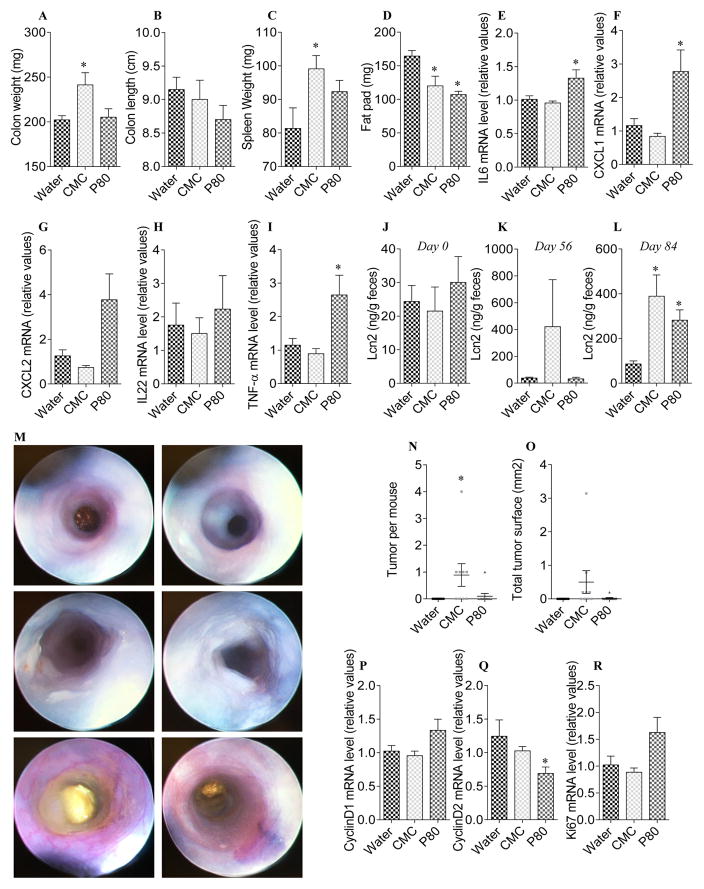
The increased risks conferred by inflammatory bowel disease (IBD) to the development of colorectal cancer gave rise to the term "colitis-associated cancer" and the concept that inflammation promotes colon tumorigenesis. A condition more common than IBD is low-grade inflammation, which correlates with altered gut microbiota composition and metabolic syndrome, both present in many cases of colorectal cancer. Recent findings suggest that low-grade inflammation in the intestine is promoted by consumption of dietary emulsifiers, a ubiquitous component of processed foods, which alter the composition of gut microbiota. Here, we demonstrate in a preclinical model of colitis-induced colorectal cancer that regular consumption of dietary emulsifiers, carboxymethylcellulose or polysorbate-80, exacerbated tumor development. Enhanced tumor development was associated with an altered microbiota metagenome characterized by elevated levels of lipopolysaccharide and flagellin. We found that emulsifier-induced alterations in the microbiome were necessary and sufficient to drive alterations in major proliferation and apoptosis signaling pathways thought to govern tumor development. Overall, our findings support the concept that perturbations in host-microbiota interactions that cause low-grade gut inflammation can promote colon carcinogenesis. Cancer Res; 77(1); 27-40. ©2016 AACR.


Conflict of interest statement

none.

Figures

Figure 1
Figure 1. Dietary emulsifiers promote colitis-associated cancer
WT mice were exposed to drinking water containing CMC or P80 (1.0%) for 13 weeks. Mice were then injected intraperitoneally with AOM (10 mg/kg body weight), maintained for 7 days, and then subjected to a two-cycle DSS treatment (each cycle consisted of 7 days of 2.5% DSS and 14 days of H2O). (A) colon weights, (B) colon lengths, (C) spleen weights, (D) fat-pad mass, (E) Body weight over time, (F) representative colon samples from each experimental group at the end of the AOM/DSS protocol, (G) number of tumor per mouse, (H) total tumor surface determined using a dissecting microscope fitted with an ocular micrometer. Data are the means +/− S.E.M. (n=5–8). Significance was determined using t-test (* indicates p<0.05) or two-way group ANOVA corrected for multiple comparisons with a Bonferroni test (# indicates statistical significance).
Figure 2
Figure 2. Dietary emulsifiers promote intestinal inflammation and carcinogenesis
Analysis of (A) IL-6, (B) CXCL1, (C) CXCL2, (D) IL-22 and (E) TNF-α mRNA expression by q-RT-PCR in the colon following emulsifier treatment and following the induction of colonic neoplasia. (F) Analysis of serum CXCL1 level by ELISA following emulsifier treatment and following the induction of colonic neoplasia. Data are the means +/− S.E.M. (n=5–8). Significance was determined using t-test (* indicates p<0.05).
Figure 3
Figure 3. Dietary emulsifiers favor a pro-inflammatory microbiota
(A) Colonic myeloperoxidase (MPO) levels, (B) fecal Lcn2 concentration at day 141, and (CH) bioactive levels of fecal flagellin (FliC, CE) and LPS (FH) assayed with TLR5 and TLR4 reporter cells, respectively, at day 0 (C, F), day 63 (D, G) and day 126 (E, H). Data are the means +/− S.E.M. (n=5–8). Significance was determined using t-test (* indicates p<0.05).
Figure 4
Figure 4. Profound metagenome alteration following CMC and P80 consumption
WT mice were exposed to drinking water containing CMC or P80 (1.0%) for 13 weeks. PICRUSt (Phylogenetic Investigation of Communities by Reconstruction of Unobserved States) was used to predict the metagenomes, subsequently analyzed by principal coordinates analysis of the beta diversity using binary jaccard method at day 0 (A–B) and day 63 (C–D). (E) Kyoto Encyclopedia of genes and genomes (KEGG) pathways were visualized on a volcano plot. From left to right: water-treated versus CMC-treated at day0; water-treated versus CMC-treated at day63; water-treated versus P80-treated at day0; water-treated versus P80-treated at day63. For each KEGG identifier, the difference in abundance between the two groups is indicated in log2 fold change on x-axis (with positive values corresponding to an increase in emulsifier-treated group compare to water-treated group, and negative values corresponding to a decrease in emulsifier-treated group compare to water-treated group), and significance between the two groups is indicated by log10 p-value on the y-axis. Red dots correspond to KEGG identifiers with a p-value <0.05 between emulsifier-treated and water-treated groups. Orange dots correspond to KEGG identifiers with at least a 2-fold decreased or increased abundance in emulsifier-treated group compare to water-treated group. Green dots correspond to KEGG identifiers with at least a 2-fold decreased or increased abundance in emulsifier-treated group compare to water-treated group and with a p-value <0.05. (F–G) Predicted metagenomes were categorized at level 3 of the KEGG pathways, and pathways involved in lipopolysaccharide biosynthesis, secretion system synthesis and motility were graphed. Data are the means +/− S.E.M. (n=5–8). Significance was determined using t-test (* indicates p<0.05).
Figure 5
Figure 5. Dietary emulsifiers alter epithelial cell proliferation and apoptosis during colitis-associated cancer development
(A–B) Epithelial cell proliferation was analyzed by immunohistochemistry using the proliferation marker Ki67 in colonic tissue sections. (A) Representative images of Ki67 staining. Scale bar, 200μm. (B) Ki67+ cells were counted and averaged per crypt. (C–D) Epithelial cell apoptosis was analyzed by terminal deoxynucleotidyl transferase deoxyuridine triphosphate nick-end labeling (TUNEL). (C) Representative confocal images of TUNEL assay: TUNEL, green; DNA, blue. Scale bar, 25μm. (D) TUNEL+ DAPI+ cells were counted and averaged per crypt. Data are the means +/− S.E.M. (n=5–8). Significance was determined using t-test (* indicates p<0.05).
Figure 6
Figure 6. Dietary emulsifiers alter epithelial cell proliferation and apoptosis in a microbiota-dependent manner
Conventional and germfree Swiss-Webster WT mice were exposed to drinking water containing CMC or P80 (1.0%) for 13 weeks. Intestinal microbiota from conventional Swiss-Webster WT mice exposed to drinking water containing CMC or P80 (1.0%) for 13 weeks were transplanted to germfree Swiss-Webster WT mice. Analysis of (A and G) CyclinD1, (B and H) CyclinD2, (C and I) Ki67, (D and J) BCL2, (E and K) BAD and (F and L) VEGFA mRNA expression by q-RT-PCR in the colon following emulsifier treatment under germfree conditions (1st column, A–F) and following microbiota transplantation (2nd column, G–L).
Figure 7
Figure 7. Dietary emulsifiers promote intestinal inflammation and carcinogenesis in the absence of DSS
WT mice were exposed to drinking water containing CMC or P80 (1.0%) for 12 weeks. Mice were injected intraperitoneally with AOM (10 mg/kg body weight) weekly for a total of 7 injections. (A) Colon weights, (B) colon lengths, (C) spleen weights and (D) fat-pad mass. (E–I) Analysis of (E) IL-6, (F) CXCL1, (G) CXCL2, (H) IL-22 and (I) TNF-α mRNA expression by q-RT-PCR in colons of emulsifier-AOM treated mice. (J–L) Fecal Lcn2 concentration at day 0 (J), 56 (K) and 84 (L). (M) Representative colonoscopy from each experimental group at the end of the protocol. (N) Number of tumor per mouse and (O) total tumor surface determined using a dissecting microscope fitted with an ocular micrometer. (P–R) Analysis of (P) CyclinD1, (Q) CyclinD2 and (R) Ki67 mRNA expression by q-RT-PCR in colons of emulsifier-AOM treated mice. Data are the means +/− S.E.M. (n=10). Significance was determined using t-test (* indicates p<0.05).

References

    1. Weir HK, Thun MJ, Hankey BF, Ries LA, Howe HL, Wingo PA, et al. Annual report to the nation on the status of cancer, 1975–2000, featuring the uses of surveillance data for cancer prevention and control. J Natl Cancer Inst. 2003;95(17):1276–99. - PubMed
    1. Merlin D, Si-Tahar M, Sitaraman SV, Eastburn K, Williams I, Liu X, et al. Colonic epithelial hPepT1 expression occurs in inflammatory bowel disease: transport of bacterial peptides influences expression of MHC class 1 molecules. Gastroenterology. 2001;120(7):1666–79. - PubMed
    1. Wojtal KA, Eloranta JJ, Hruz P, Gutmann H, Drewe J, Staumann A, et al. Changes in mRNA expression levels of solute carrier transporters in inflammatory bowel disease patients. Drug Metab Dispos. 2009;37(9):1871–7. - PubMed
    1. Eaden JA, Abrams KR, Mayberry JF. The risk of colorectal cancer in ulcerative colitis: a meta-analysis. Gut. 2001;48(4):526–35. - PMC - PubMed
    1. Ahmadi A, Polyak S, Draganov PV. Colorectal cancer surveillance in inflammatory bowel disease: the search continues. World J Gastroenterol. 2009;15(1):61–6. - PMC - PubMed

Publication types

MeSH terms

LinkOut - more resources