. 2017 Jan 1;77(1):41-52.
doi: 10.1158/0008-5472.CAN-16-1383. Epub 2016 Nov 7.

Heterogeneous Stromal Signaling within the Tumor Microenvironment Controls the Metastasis of Pancreatic Cancer

Affiliations

Heterogeneous Stromal Signaling within the Tumor Microenvironment Controls the Metastasis of Pancreatic Cancer

Agnieszka A Rucki et al. Cancer Res. .

Abstract

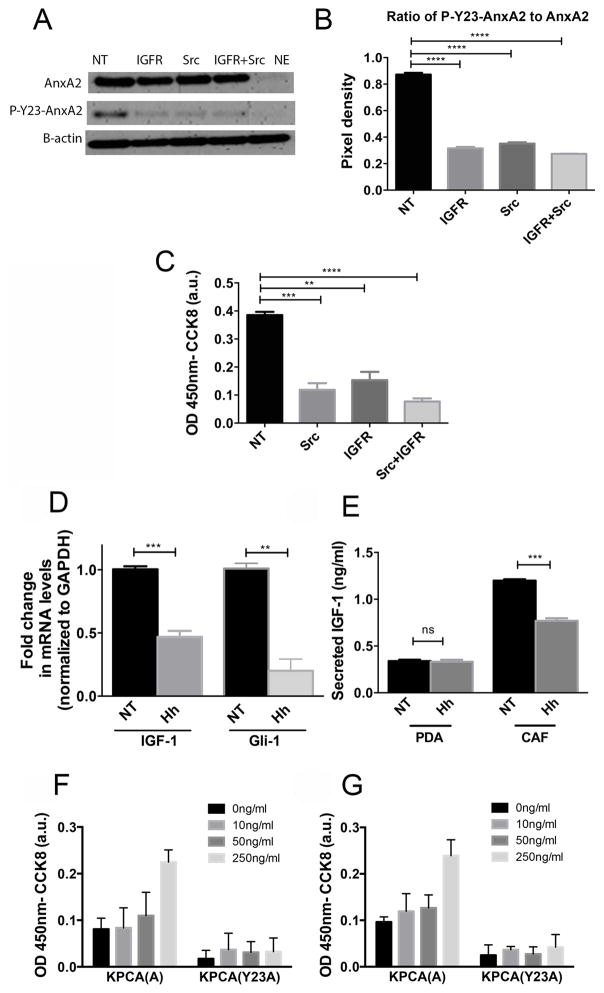
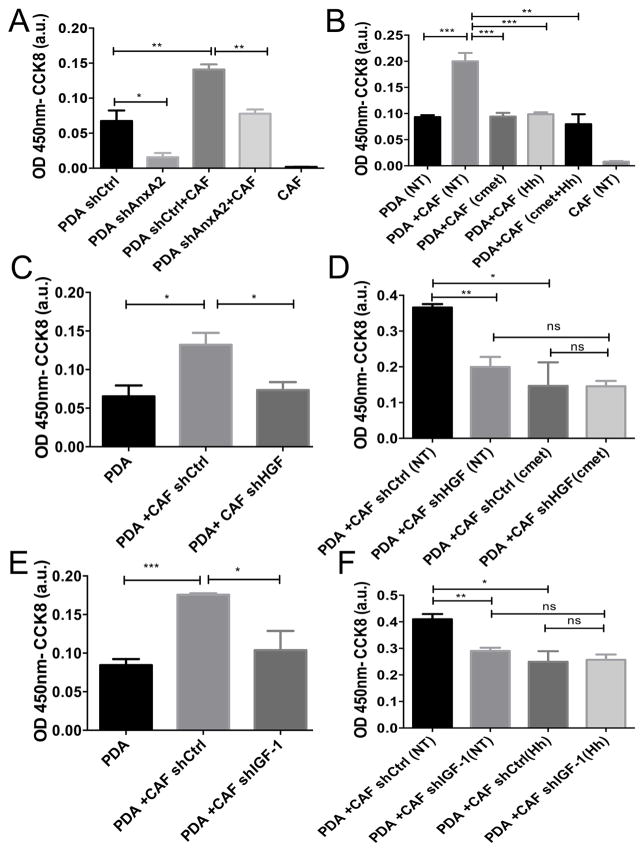
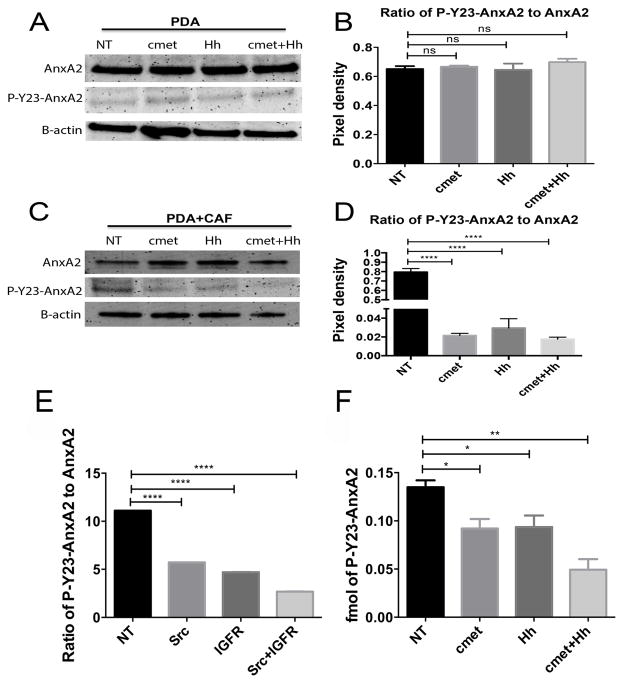
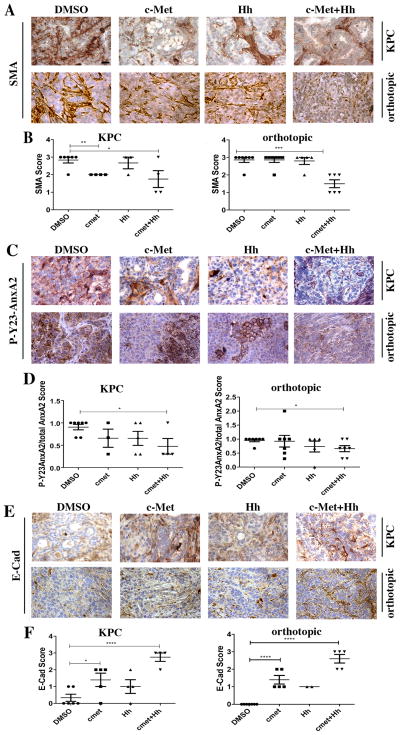
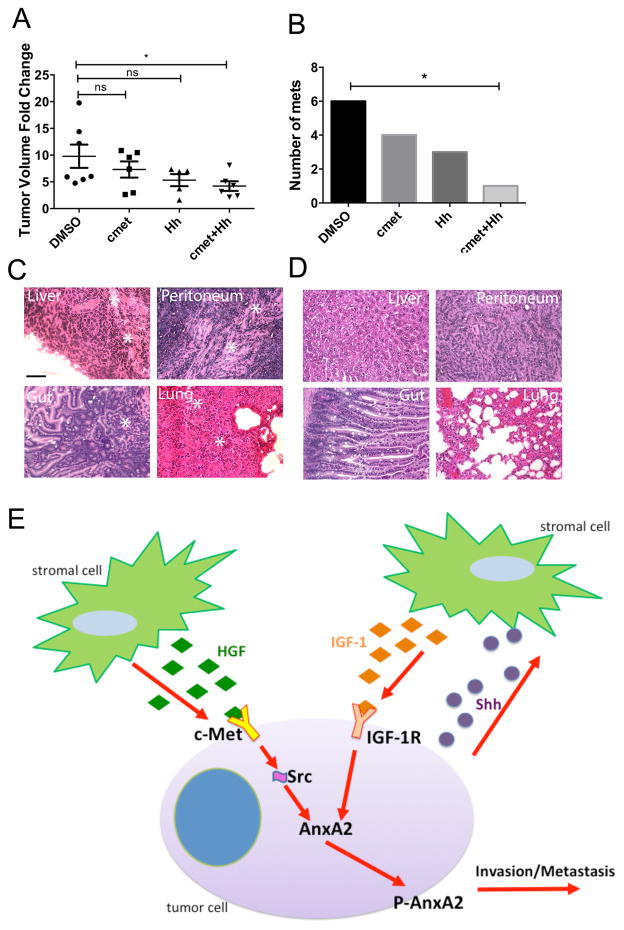
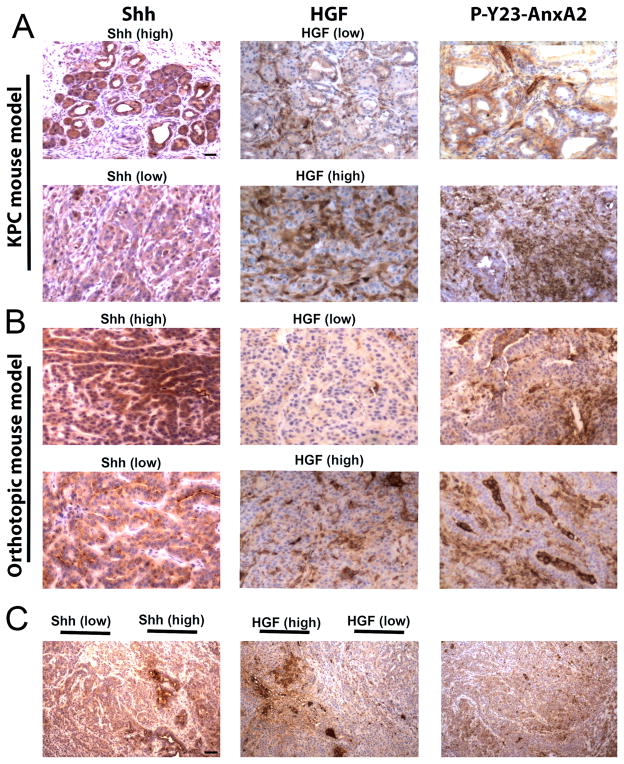
Understanding how stromal signals regulate the development of pancreatic ductal adenocarcinoma (PDAC) may suggest novel therapeutic interventions in this disease. In this study, we assessed the metastatic role of stromal signals suggested to be important in the PDAC microenvironment. Src and IGF-1R phosphorylated the prometastatic molecule Annexin A2 (AnxA2) at Y23 and Y333 in response to stromal signals HGF and IGF-1, respectively, and IGF-1 expression was regulated by the Sonic Hedgehog (Shh) pathway. Both Shh and HGF were heterogeneously expressed in PDAC stroma, and only dual inhibition of these pathways could significantly suppress AnxA2 phosphorylation, PDAC growth, and metastasis. Taken together, our results illuminate tumor-stromal interactions, which drive metastasis, and provide a mechanism-based rationale for a stroma-directed therapy for PDAC. Cancer Res; 77(1); 41-52. ©2016 AACR.


Conflict of interest statement

of Potential Conflict of Interests: No relevant conflicts of interest to disclose.

Figures

Figure 1
Figure 1. Inhibition of Src and IGF-1R kinases results in decreased phosphorylation of AnxA2 at Tyrosine 23 on the cell surface of human PDAC cells and subsequent decrease in PDAC invasion while stromal factors, IGF-1 and HGF, upstream of IGF-1R and Src kinases, enhance invasion of tumor cells in PDAC cells
A. Western blot of Panc10.05 human PDAC cells treated with IGF-1R inhibitor (1μM) and Src inhibitor (50 nM) for 60 minutes. AnxA2 was eluted off the surface of PDAC cells with EGTA as previously described (12,26). The levels of total surface AnxA2 and P-Y23-AnxA2 were quantified by Western blot. β-actin was used as a loading control. B. Quantification of relative expression of P-Y23-AnxA2 to total cell surface AnxA2(ratio) C. An invasion assay using PDAC cells treated with IGF-1R and/or Src inhibitors D. qRT-PCR analysis of IGF-1 and Gli-1(control) in hCAFs. The gene expression of IGF-1 and Gli1 was normalized to GAPDH and is shown as a fold change. E. IGF-1 secretion determined by ELISA from single cultures of PDACand hCAF, respectively. F and G. An invasion assay using murine KPCA (A) and KPCA (Y23A) PDAC cells was performed. Serum free media, rIGF-1(C) or rHGF (D) at depicted concentrations were added to the PDAC cell suspension prior to plating. Data are means ± SEM from three technical replicates and representative of at least duplicate experiments. NT-vehicle treatment, Hh-Hh inhibitor (NVP-LDE225 at 1μM) treatment, IGFR-NVP-AEW541 inhibitor, Src-dasatinib inhibitor. ns-not significant, *p<0.05, **p<0.01, ***p<0.001, ****p<0.0001(unpaired student’s t-test).
Figure 2
Figure 2. IGF-1 and HGF secreted by hCAFs regulate the invasion of human PDAC cells in an AnxA2 dependent manner
A. Invasion assays of PDAC cells transfected with control (shCtrl) or AnxA2 targeting shRNA (shAnxA2) in single culture (PDAC cells only) or in co-culture with hCAFs. B. Invasion assays of PDAC cells co-cultured with hCAFs (2:1 here and below) and treated with vehicle (NT), c-Met inhibitor (at 10pM), or Hh inhibitor (at 1μM). C. Invasion assays of PDAC cells co-cultured with hCAFs transfected with control (shCtrl) or HGF targeting shRNA (shHGF). D. Invasion assays of PDAC cells co-cultured with hCAFs transfected with control (shCtrl) or HGF targeting shRNA (shHGF) and treated with vehicle (NT) or c-Met inhibitor. E. Invasion assays of PDAC cells co-cultured with hCAFs transfected with control (shCtrl) or IGF-1 targeting shRNA (shIGF-1). F. Invasion assays of PDAC co-cultured with hCAFs transfected with control (shCtrl) or IGF-1 targeting shRNA (shIGF-1) and treated with vehicle (NT) or Hh inhibitor. Data are means ± SEM from 3 technical replicates and representative of at least 3 experiments. ns-not significant, *p<0.05, **p<0.01, ***p<0.001(unpaired student’s t-test).
Figure 3
Figure 3. IGF-1 and HGF secreted by hCAFs regulate AnxA2 phosphorylation of human PDAC cells
A. Western blot of AnxA2 and P-Y23-AnxA2 eluted from PDAC cells after 24 hours of treatment with the Hh inhibitor (at 1μM) and/or HGF/c-Met inhibitor (at 10pM) in reduced (5%) serum media. β-actin used as a loading control. B. Quantification of the Western blot from panel A and shown as the ratio of P-Y23-AnxA to AnxA2. C. Western blot of AnxA2 and P-Y23-AnxA2 eluted from the PDAC cells after co-culture with hCAFs in a contact independent manner using a transwell system. Cells were treated as in panel A but in full media. D. Quantification of the Western blot from panel C was performed as in panel B. Blots are representative of at least 3 experiments. E. Semi-quantitative analysis by mass spectrometry of P-Y23-AnxA2 in cell surface elution of single culture of PDAC cells after treatment with IGF-1R inhibitor and/or Src inhibitor in full serum media. Relative score of P-Y23-AnxA2(B) in total AnxA2 are shown. Note, AnxA2 and P-AnxA2 were scored separately with different units due to the different intensities of signals detected by mass spectrometry. F. Absolute-quantitative analysis of P-Y23-AnxA2 by mass spectrometry in cell surface elution of the PDAC cells after co-culture with hCAFs and treatment with Hh inhibitor and/or HGF/c-Met inhibitor. Data are means ± SEM from 3 technical replicates and representative of at least 2 experiments. NT-vehicle treatment, IGFR-NVP-AEW541 inhibitor, Src-dasatinib inhibitor, c-Met-INC280 treatment, Hh-NVP-LDE treatment. ns-not significant, *p<0.05, **p<0.01, ***p<0.001, ****p<0.0001(unpaired student’s t-test).
Figure 4
Figure 4. In vivo targeting of stromal signals in KPC and orthotopic mouse models of PDAC suppresses hCAF activation, AnxA2 phosphorylation, and the epithelial to mesenchymal transition (EMT)
Panels A, D, G show representative IHC of SMA, P-Y23-AnxA and E-Cadherin (E-Cad) on primary tumors from both KPC transgenic mice and orthotopic model treated with stromal inhibitors or vehicle (DMSO). Panels B, E, H show semi-quantitative analysis scores of KPC tumors and panels C, F, I of orthotopic tumors harvested from this study. Protein expression was semi-quantified with a score from 0 to 3(0 representing no expression and 3 representing high expression). Mice with primary tumors confirmed by ultrasound were used for this study (at least 7 per group (KPC) and at least 9 per group (orthotopic)). *p<0.05, **p<0.01, ***p<0.001, ****p<0.0001(unpaired student’s t-test). Positive staining is shown in brown. Scale bar, 20 μm.
Figure 5
Figure 5. Inhibition of stromal-neoplasm crosstalk leads to a decrease in primary PDAC growth and metastases formation in vivo
A. Fold change in primary tumor volume, calculated as end-point tumor volume/baseline tumor volume is shown. Mice were subjected to different treatments as indicated. DMSO-vehicle treatment. ns-not significant, *p<0.05, **p<0.01(unpaired student t-test). B. Summary of gross and histological quantification (combined) of all metastases (at least 7 mice per group). *p<0.05(Fisher’s exact test). C. Representative H&E images of metastases from the DMSO group were marked by *. D. Representative H&E images of normal tissues from the DMSO group. Scale bars for C and D, 200 μm. E. A working model showing dual stromal signaling pathways regulates a single pro-metastatic mechanism.
Figure 6
Figure 6. The stromal signals Shh and HGF are heterogeneously expressed in the tumor microenvironment of PDACs from different mouse models
A and B. Representative IHC images of primary tumors stained for expression of Shh, HGF, P-Y23-AnxA2 show intertumoral heterogeneity in Shh and HGF expression in KPC (A) and orthotopic mouse models (B), respectively. C. Representative IHC images from the KPC mice show intratumoral heterogeneity in the expression of Shh and HGF. Scale bars, 20 μm for A, B and 200 μm for C.

References

    1. Maitra A, Hruban RH. Pancreatic cancer. Annual review of pathology. 2008;3:157–88. - PMC - PubMed
    1. Rucki AA, Zheng L. Pancreatic cancer stroma: understanding biology leads to new therapeutic strategies. World journal of gastroenterology : WJG. 2014;20(9):2237–46. - PMC - PubMed
    1. Chu GC, Kimmelman AC, Hezel AF, DePinho RA. Stromal biology of pancreatic cancer. Journal of cellular biochemistry. 2007;101(4):887–907. - PubMed
    1. Berman DM, Karhadkar SS, Maitra A, Montes De Oca R, Gerstenblith MR, Briggs K, et al. Widespread requirement for Hedgehog ligand stimulation in growth of digestive tract tumours. Nature. 2003;425(6960):846–51. - PubMed
    1. Shinozaki S, Ohnishi H, Hama K, Kita H, Yamamoto H, Osawa H, et al. Indian hedgehog promotes the migration of rat activated pancreatic stellate cells by increasing membrane type-1 matrix metalloproteinase on the plasma membrane. Journal of cellular physiology. 2008;216(1):38–46. - PubMed

Publication types