. 2017 Jan;45(1):11-51.
doi: 10.1177/0192623316672074. Epub 2016 Nov 11.

Proceedings of the 2016 National Toxicology Program Satellite Symposium

Affiliations

Proceedings of the 2016 National Toxicology Program Satellite Symposium

Susan A Elmore et al. Toxicol Pathol. 2017 Jan.

Abstract

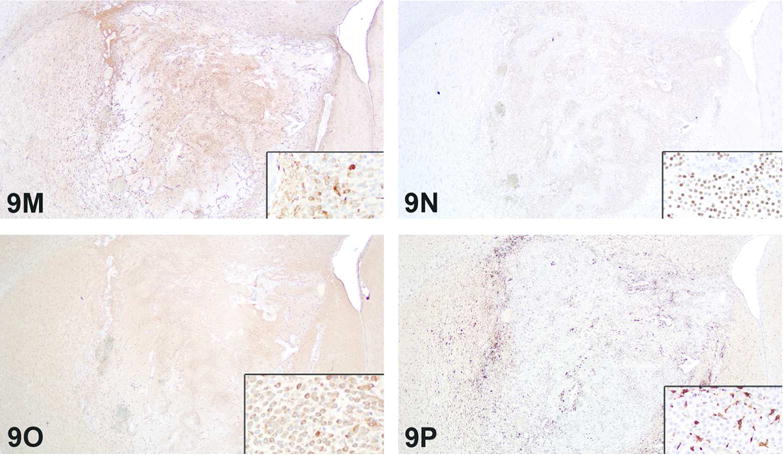
The 2016 annual National Toxicology Program Satellite Symposium, entitled "Pathology Potpourri" was held in San Diego, CA, at the Society of Toxicologic Pathology's (STP) 35th annual meeting. The goal of this symposium was to present and discuss challenging diagnostic pathology and/or nomenclature issues. This article presents summaries of the speakers' talks, along with select images that were used by the audience for voting and discussion. Some lesions and topics covered during the symposium included malignant glioma and histiocytic sarcoma in the rodent brain; a new statistical method designed for histopathology data evaluation; uterine stromal/glandular polyp in a rat; malignant plasma cell tumor in a mouse brain; Schwann cell proliferative lesions in rat hearts; axillary schwannoma in a cat; necrosis and granulomatous inflammation in a rat brain; adenoma/carcinoma in a rat adrenal gland; hepatocyte maturation defect and liver/spleen hematopoietic defects in an embryonic mouse; distinguishing malignant glioma, malignant mixed glioma, and malignant oligodendroglioma in the rat; comparison of mammary gland whole mounts and histopathology from mice; and discussion of the International Harmonization of Nomenclature and Diagnostic Criteria collaborations.

Keywords: INHAND; NTP Satellite Symposium; Rao-Scott Cochran-Armitage by Slices; abnormal mouse fetal development; adrenal gland carcinoma; brain plasma cell tumor; endometrial polyp; glioblastoma multiforme; malignant glioma; mammary gland whole mount; schwannoma.


Conflict of interest statement

The author(s) declared no potential conflicts of interest with respect to the research, authorship, and/or publication of this article.

Figures

Figure 1
Figure 1
A–C. Brain tumor from a 2-year-old Harlan Sprague Dawley male control rat presented in case 1. Figure A shows a low magnification H&E of the brain tumor that appears to arise unilaterally from and locally infiltrate the cerebral neuropil near the region of the optic chiasm with minimal distortion of the parenchyma (arrows). A higher magnification H&E of the neoplasm (B) shows that the cells are closely packed and fusiform with oval euchromatic nuclei and indistinct nucleoli. High magnification of the brain neoplasm with strongly positive cytoplasmic Iba1 immunohistochemical expression (C). Iba1 is a microglia/macrophage-specific calcium binding protein. D–F. Brain tumor from a treated male B6C3F1 mouse presented in case 2. The low magnification H&E image shows an expansile and compressive nodule apparently arising from the meninges along the ventral aspect of the brain stem (D). The mass is composed of round to ovoid cells with a moderate amount of eosinophilic cytoplasm, and some of the cells are surrounding medium-sized vessels of the meninges and brain (E). The neoplastic cells have strongly positive cytoplasmic immunoreactivity for the macrophage marker F480 (F).
Figure 1
Figure 1
A–C. Brain tumor from a 2-year-old Harlan Sprague Dawley male control rat presented in case 1. Figure A shows a low magnification H&E of the brain tumor that appears to arise unilaterally from and locally infiltrate the cerebral neuropil near the region of the optic chiasm with minimal distortion of the parenchyma (arrows). A higher magnification H&E of the neoplasm (B) shows that the cells are closely packed and fusiform with oval euchromatic nuclei and indistinct nucleoli. High magnification of the brain neoplasm with strongly positive cytoplasmic Iba1 immunohistochemical expression (C). Iba1 is a microglia/macrophage-specific calcium binding protein. D–F. Brain tumor from a treated male B6C3F1 mouse presented in case 2. The low magnification H&E image shows an expansile and compressive nodule apparently arising from the meninges along the ventral aspect of the brain stem (D). The mass is composed of round to ovoid cells with a moderate amount of eosinophilic cytoplasm, and some of the cells are surrounding medium-sized vessels of the meninges and brain (E). The neoplastic cells have strongly positive cytoplasmic immunoreactivity for the macrophage marker F480 (F).
Figure 2
Figure 2
A–B. Figure 2A shows example formatting of hypothetical data for use in RSCABS analyses conducted via StatCharrms software. The arrangement and naming of columns is somewhat flexible; for example, the column labeled “Replicate” in Figure A could just as easily be replaced by “Generation” or another useful category. The Microsoft Excel spreadsheets are saved as comma delimited files (.csv). Figure B demonstrates example results generated by RSCABS (partial results from data set #3). The column labeled “Response” contains the abbreviated diagnoses, “Treatment” represents the treatment group level, “Rscore” represents the severity grade, and “T-Value” indicates the direction of change (positive or negative). “P-values” indicate the treatment level(s) at which results are significant and also indicate the significant severity level(s).
Figure 3
Figure 3
A–C. Uterine polyp from a 2-year rat carcinogenicity assay presented as case 1. A large, non-encapsulated mass is present within the uterine lumen (A). Higher magnification (B) shows a number of endometrial glands throughout the stroma, some of which are dilated (asterisks). Figure C illustrates the deep invagination lined by keratinized stratified squamous epithelium. H&E. D. Comparison of features of rat glandular polyps (left panel) versus stromal polyps (right panel). There is dense fibrovascular stroma and a paucity of endometrial glands in the endometrial stromal polyp (right panel). H&E. E–G. A rat leiomyosarcoma presented as case 2. There is marked thickening of the uterine wall with compression of the lumen (E, asterisk). The higher magnification (F) illustrates the lumen (asterisk) lined by fragmented, hyperplastic stratified squamous epithelium. A higher magnification of the neoplasm (G) shows that it contains pleomorphic spindle cells cells with blunt-ended, “cigar-shaped” oval nuclei. H&E. H–J. Figure 3H illustrates a rat uterine malignant schwannoma presented as case 3. The neoplasm is poorly demarcated, unencapsulated and infiltrative (H). Higher magnifications show that there are randomly arranged, round to spindle shaped cells (I) and areas comprised of large, endothelial-lined cystic spaces in a poorly stained edematous matrix (J). H&E.
Figure 3
Figure 3
A–C. Uterine polyp from a 2-year rat carcinogenicity assay presented as case 1. A large, non-encapsulated mass is present within the uterine lumen (A). Higher magnification (B) shows a number of endometrial glands throughout the stroma, some of which are dilated (asterisks). Figure C illustrates the deep invagination lined by keratinized stratified squamous epithelium. H&E. D. Comparison of features of rat glandular polyps (left panel) versus stromal polyps (right panel). There is dense fibrovascular stroma and a paucity of endometrial glands in the endometrial stromal polyp (right panel). H&E. E–G. A rat leiomyosarcoma presented as case 2. There is marked thickening of the uterine wall with compression of the lumen (E, asterisk). The higher magnification (F) illustrates the lumen (asterisk) lined by fragmented, hyperplastic stratified squamous epithelium. A higher magnification of the neoplasm (G) shows that it contains pleomorphic spindle cells cells with blunt-ended, “cigar-shaped” oval nuclei. H&E. H–J. Figure 3H illustrates a rat uterine malignant schwannoma presented as case 3. The neoplasm is poorly demarcated, unencapsulated and infiltrative (H). Higher magnifications show that there are randomly arranged, round to spindle shaped cells (I) and areas comprised of large, endothelial-lined cystic spaces in a poorly stained edematous matrix (J). H&E.
Figure 4
Figure 4
A–D. Light microscopy features of a mass in the brain stem of a B6C3F1 female mouse from a 2-year toxicity/carcinogenicity bioassay. Low (A) magnification shows a fairly well–circumscribed mass with displacement of the brain stem. Cells are organized loosely in some areas and are more compacted in others. Figure B shows an area of compacted cells in which some cells are lining up along the basal lamina of capillaries (arrows). In other areas cells appear fairly uniform and are forming packets and rows (C). A higher magnification (D) shows a fairly uniform population of cells organized in packets and rows. The cells have large round nuclei with abundant amphophilic to eosinophilic cytoplasm. The nucleus tends to be centrally or eccentrically located with a perinuclear clear zone. H&E. E–G. Light microscopy features of a mass in the brain stem of a B6C3F1 female mouse from a 2-year toxicity/carcinogenicity bioassay, continued. Figure E is from an area of mass in which the cells are more loosely arranged. Cells appear round to oval and fairly uniform in size and shape. Cells can be seen adherent to the capillary basal lamina (arrows). Frequently, individualized cells often have an eosinophilic cytoplasm which appears slightly granular (F). Cells line up along and adhere to the basal lamina of capillaries (G). (H&E) H–K. Low and high magnifications of immunohistochemistry findings of the mass in the brain stem of a B6C3F1 female mouse from a 2-year toxicity/carcinogenicity bioassay, continued from 4A–G. Many of the cells within the mass are positive for cytoplasmic IgG (H&I) and IgM (J&K) although some cells are not staining. L–O. Electron micrographs of the mass in the brain stem of a B6C3F1 female mouse from a 2-year toxicity/carcinogenicity bioassay preserved in formalin. In Figure L there are densely-packed, fairly uniform round to oval cells with a round nucleus. Figure M shows abundant rough endoplasmic reticulum organized in stacks (asterisk), nucleoli, central euchromatin and a scant peripheral heterochromatin. In Figure N there is a stacked arrangement of rough endoplasmic reticulum and vesicles in the cytoplasm. A higher magnification image (O) shows the rough endoplasmic reticulum, secretory vesicles (arrows) and mitochondria. Note the lack of tight junctions, desmosomes/hemidesmosomes, cytoplasmic filaments or psammoma bodies.
Figure 4
Figure 4
A–D. Light microscopy features of a mass in the brain stem of a B6C3F1 female mouse from a 2-year toxicity/carcinogenicity bioassay. Low (A) magnification shows a fairly well–circumscribed mass with displacement of the brain stem. Cells are organized loosely in some areas and are more compacted in others. Figure B shows an area of compacted cells in which some cells are lining up along the basal lamina of capillaries (arrows). In other areas cells appear fairly uniform and are forming packets and rows (C). A higher magnification (D) shows a fairly uniform population of cells organized in packets and rows. The cells have large round nuclei with abundant amphophilic to eosinophilic cytoplasm. The nucleus tends to be centrally or eccentrically located with a perinuclear clear zone. H&E. E–G. Light microscopy features of a mass in the brain stem of a B6C3F1 female mouse from a 2-year toxicity/carcinogenicity bioassay, continued. Figure E is from an area of mass in which the cells are more loosely arranged. Cells appear round to oval and fairly uniform in size and shape. Cells can be seen adherent to the capillary basal lamina (arrows). Frequently, individualized cells often have an eosinophilic cytoplasm which appears slightly granular (F). Cells line up along and adhere to the basal lamina of capillaries (G). (H&E) H–K. Low and high magnifications of immunohistochemistry findings of the mass in the brain stem of a B6C3F1 female mouse from a 2-year toxicity/carcinogenicity bioassay, continued from 4A–G. Many of the cells within the mass are positive for cytoplasmic IgG (H&I) and IgM (J&K) although some cells are not staining. L–O. Electron micrographs of the mass in the brain stem of a B6C3F1 female mouse from a 2-year toxicity/carcinogenicity bioassay preserved in formalin. In Figure L there are densely-packed, fairly uniform round to oval cells with a round nucleus. Figure M shows abundant rough endoplasmic reticulum organized in stacks (asterisk), nucleoli, central euchromatin and a scant peripheral heterochromatin. In Figure N there is a stacked arrangement of rough endoplasmic reticulum and vesicles in the cytoplasm. A higher magnification image (O) shows the rough endoplasmic reticulum, secretory vesicles (arrows) and mitochondria. Note the lack of tight junctions, desmosomes/hemidesmosomes, cytoplasmic filaments or psammoma bodies.
Figure 5
Figure 5
A–D. Proliferative cardiac lesion from a control Harlan Sprague Dawley rat from an NTP 2-year toxicity and carcinogenicity bioassay that was presented as case 1. This was a hypercellular lesion that involved about one third of the entire right ventricular subendocardium, including papillary muscles. These images show papillary muscles with a population of proliferative cells that have oval to elongate basophilic nuclei and eosinophilic cytoplasm with deeply eosinophilic wavy extracellular material (A–D). The cells are subjacent to an intact endocardium and also infiltrate the underlying myocardium (C, arrow). Within the papillary muscles the proliferative cells surround and replace the normal myocardium (D). H&E. E–F. Proliferative cardiac lesions from control Harlan Sprague Dawley rats from an NTP 2-year toxicity and carcinogenicity bioassay that were presented as the second (E) and third (F) cases. Figure 5E is a small intramural cardiac lesion within the left ventricle. The cells had round to oval basophilic nuclei with eosinophilic to amphophilic cytoplasm. The cells are either spread out in rows, 2–8 cells thick, between cardiomyocytes or, in one focal area, 19 cells thick in the widest section (arrow). Figure 5F is another cardiac small lesion with cells similar in appearance to those in 5E. This lesion is both subjacent to the endocardium and within the myocardium of the papillary muscles. At the tip of the papillary muscle (F) there is myocardium replacement by these infiltrating cells as well as eosinophilic wavy extracellular material (arrows; elastic fibers). H&E. G–H. Classic cardiac Schwann cell hyperplasia from a 2-year-old control male Sprague Dawley rat. The noninvasive elongate cells lining the subendocardium are 1–4 cells thick (arrows). The elongate cells have faintly eosinophilic cytoplasm, indistinct cell borders and round, ovoid or slightly elongated nuclei. H&E. I–K. Examples of features of cardiac schwannomas. Figure I is a high magnification of a region of cardiac schwannoma with elastic fibers and collagen formation (arrow), produced by the neoplastic Schwann cells. Figure J is a high magnification of a region of cardiac schwannoma illustrating Anitschkow cells. Anitschkow cells have an ovoid nucleus and the chromatin is condensed toward the center of the nucleus, sometimes in a wavy rod-like pattern so that it resembles the shape of a caterpillar (J, arrows). Figure K is a high magnification of a cardiac schwannoma with an Antoni A pattern, characterized by nuclear palisading. H&E. L. Cardiac schwannoma with a presentation different from an endocardial or intramural schwannoma. This neoplastic lesion is proliferating around epicardial and intramural vessels with infiltration into the myocardium. H&E. M–P. Series of challenging cardiac proliferative lesions. Figure M is a small intramural cardiac Schwann cell lesion diagnosed as a schwannoma. There is infiltration and invasion with replacement of cardiomyocytes. Figures N (arrow; low magnification) and O (high magnification) depict an even smaller intramural cardiac lesion at the apex of the heart. This lesion has cells with similar features to that to Figure M and there is invasion with replacement of cardiomyocytes. Figure P shows another intramural lesion that infiltrates and invades the myocardium and in some areas surrounds and replaces cardiomyocytes (arrows). This lesion has cellular features similar to those of the lesions in Figures M–O. H&E.
Figure 5
Figure 5
A–D. Proliferative cardiac lesion from a control Harlan Sprague Dawley rat from an NTP 2-year toxicity and carcinogenicity bioassay that was presented as case 1. This was a hypercellular lesion that involved about one third of the entire right ventricular subendocardium, including papillary muscles. These images show papillary muscles with a population of proliferative cells that have oval to elongate basophilic nuclei and eosinophilic cytoplasm with deeply eosinophilic wavy extracellular material (A–D). The cells are subjacent to an intact endocardium and also infiltrate the underlying myocardium (C, arrow). Within the papillary muscles the proliferative cells surround and replace the normal myocardium (D). H&E. E–F. Proliferative cardiac lesions from control Harlan Sprague Dawley rats from an NTP 2-year toxicity and carcinogenicity bioassay that were presented as the second (E) and third (F) cases. Figure 5E is a small intramural cardiac lesion within the left ventricle. The cells had round to oval basophilic nuclei with eosinophilic to amphophilic cytoplasm. The cells are either spread out in rows, 2–8 cells thick, between cardiomyocytes or, in one focal area, 19 cells thick in the widest section (arrow). Figure 5F is another cardiac small lesion with cells similar in appearance to those in 5E. This lesion is both subjacent to the endocardium and within the myocardium of the papillary muscles. At the tip of the papillary muscle (F) there is myocardium replacement by these infiltrating cells as well as eosinophilic wavy extracellular material (arrows; elastic fibers). H&E. G–H. Classic cardiac Schwann cell hyperplasia from a 2-year-old control male Sprague Dawley rat. The noninvasive elongate cells lining the subendocardium are 1–4 cells thick (arrows). The elongate cells have faintly eosinophilic cytoplasm, indistinct cell borders and round, ovoid or slightly elongated nuclei. H&E. I–K. Examples of features of cardiac schwannomas. Figure I is a high magnification of a region of cardiac schwannoma with elastic fibers and collagen formation (arrow), produced by the neoplastic Schwann cells. Figure J is a high magnification of a region of cardiac schwannoma illustrating Anitschkow cells. Anitschkow cells have an ovoid nucleus and the chromatin is condensed toward the center of the nucleus, sometimes in a wavy rod-like pattern so that it resembles the shape of a caterpillar (J, arrows). Figure K is a high magnification of a cardiac schwannoma with an Antoni A pattern, characterized by nuclear palisading. H&E. L. Cardiac schwannoma with a presentation different from an endocardial or intramural schwannoma. This neoplastic lesion is proliferating around epicardial and intramural vessels with infiltration into the myocardium. H&E. M–P. Series of challenging cardiac proliferative lesions. Figure M is a small intramural cardiac Schwann cell lesion diagnosed as a schwannoma. There is infiltration and invasion with replacement of cardiomyocytes. Figures N (arrow; low magnification) and O (high magnification) depict an even smaller intramural cardiac lesion at the apex of the heart. This lesion has cells with similar features to that to Figure M and there is invasion with replacement of cardiomyocytes. Figure P shows another intramural lesion that infiltrates and invades the myocardium and in some areas surrounds and replaces cardiomyocytes (arrows). This lesion has cellular features similar to those of the lesions in Figures M–O. H&E.
Figure 6
Figure 6
A–F. Neuroblastoma-like schwannoma in the axillary subcutis of a cat. Photomicrograph of a cross section of the subcutaneous mass (A) and a higher magnification photomicrograph (B) of the mass with a focus on two morphologically distinct cellular arrangements. Figures C and D are higher magnification photomicrographs of the crescentic lobule (asterisk) in Figure 6B, which is composed of compact, spindle cells arranged in intersecting bundles. Higher magnification photomicrographs (E&F) of the larger portion of the mass demonstrate tightly packed, giant rosette-like structures that are similar to Homer-Wright rosettes. The rosette-like structures are composed of peripherally-stacked nuclei with centrally-oriented cytoplasmic processes that intermingle with a scaffold of collagen fibers. H&E.
Figure 7
Figure 7
A–D. Brain lesion in a Sprague Dawley rat from a two-year inhalation toxicity and carcinogenicity study presented as case 1. Low magnification view of brain with a unilateral lesion (A, arrows), characterized at the subgross level by pallor and increased cellularity, indicating loss of brain parenchyma, and cellular infiltration, respectively. Higher magnification image of the lesion shows numerous macrophages infiltrating the brain parenchyma as a component of the inflammatory response (B). There are occasional cholesterol clefts and numerous macrophages infiltrating the brain parenchyma (C). Figure 7D is a high magnification image showing numerous macrophages infiltrating the parenchyma. There is loss of brain parenchyma evidenced by increased pallor of the neuropil and presence of increased clear space. H&E. E–G. Immunohistochemical and immunofluorescence staining of the unilateral brain lesion from case 1. Figure E shows immunohistochemical staining for Iba1. Note the positive (brown) cytoplasmic staining of inflammatory cells (macrophages). Figure F shows immunohistochemical staining for GFAP. Note positive cytoplasmic (brown) staining of astrocytes, interpreted as a reactive response to the inflammation. Immunofluorescence staining (G) illustrates the GFAP (red) staining of reactive astrocytes and Iba1 (green) staining of the inflammatory cell infiltrate (macrophages). Nuclei are counterstained with DAPI (blue). H–J. Adrenal gland lesion in a Sprague Dawley rat from a two-year inhalation toxicity and carcinogenicity study presented as case 2. Note the compressive, well-demarcated neoplastic lesion in the cortex that appears to expand through the capsule (H). Compression of the surrounding adrenal cortex and adjacent medulla by the neoplasm is evident, with apparent expansion of the neoplasm through the adrenal capsule (I). Figure J is a view of adrenal gland where a component of the fibrous capsule is barely perceptible (arrows) and appears to partially encapsulate the neoplastic cells. Additional neoplastic cells are outside this extension and arranged in cords outside of the thick, fibrous capsule. H&E.
Figure 7
Figure 7
A–D. Brain lesion in a Sprague Dawley rat from a two-year inhalation toxicity and carcinogenicity study presented as case 1. Low magnification view of brain with a unilateral lesion (A, arrows), characterized at the subgross level by pallor and increased cellularity, indicating loss of brain parenchyma, and cellular infiltration, respectively. Higher magnification image of the lesion shows numerous macrophages infiltrating the brain parenchyma as a component of the inflammatory response (B). There are occasional cholesterol clefts and numerous macrophages infiltrating the brain parenchyma (C). Figure 7D is a high magnification image showing numerous macrophages infiltrating the parenchyma. There is loss of brain parenchyma evidenced by increased pallor of the neuropil and presence of increased clear space. H&E. E–G. Immunohistochemical and immunofluorescence staining of the unilateral brain lesion from case 1. Figure E shows immunohistochemical staining for Iba1. Note the positive (brown) cytoplasmic staining of inflammatory cells (macrophages). Figure F shows immunohistochemical staining for GFAP. Note positive cytoplasmic (brown) staining of astrocytes, interpreted as a reactive response to the inflammation. Immunofluorescence staining (G) illustrates the GFAP (red) staining of reactive astrocytes and Iba1 (green) staining of the inflammatory cell infiltrate (macrophages). Nuclei are counterstained with DAPI (blue). H–J. Adrenal gland lesion in a Sprague Dawley rat from a two-year inhalation toxicity and carcinogenicity study presented as case 2. Note the compressive, well-demarcated neoplastic lesion in the cortex that appears to expand through the capsule (H). Compression of the surrounding adrenal cortex and adjacent medulla by the neoplasm is evident, with apparent expansion of the neoplasm through the adrenal capsule (I). Figure J is a view of adrenal gland where a component of the fibrous capsule is barely perceptible (arrows) and appears to partially encapsulate the neoplastic cells. Additional neoplastic cells are outside this extension and arranged in cords outside of the thick, fibrous capsule. H&E.
Figure 8
Figure 8
A–D. Abnormal development of the liver in a conditional knockout (KO) embryo presented in case 1. Wild type (A&C) is compared to the KO (B&D). Compared to wild type (A), the size of the E13.5 conditional KO mouse liver was diminished (B). The E13.5 conditional KO mouse had a delay in hepatocellular maturation, and decreased hematopoiesis. Compared to wild type (C), hepatocytes contained large nuclei and abundant eosinophilic cytoplasm (D) and were often binucleate, which resembled hepatoblasts (immature developing hepatocytes) rather than hepatocytes. The hepatic sinusoids of the conditional KO mouse at E13.5 were markedly dilated and showed an obvious absence of erythropoietic islands (D) when compared to wild type animals (C). H&E. E–H. Abnormal development of the spleen in a conditional knockout (KO) embryo (F&H) compared to wild type (E&G) presented in case 2. The spleen (black arrow) of the E16.5 wild type mouse (E) contains large numbers of hematopoietic cells at various stages of differentiation (G, immature neutrophils, white arrows) while the spleen (black arrow) of the conditional KO mouse (F) only contains indistinct cells with darkly stained nuclei, mesenchymal cells and nucleated erythrocytes (H). H&E.
Figure 8
Figure 8
A–D. Abnormal development of the liver in a conditional knockout (KO) embryo presented in case 1. Wild type (A&C) is compared to the KO (B&D). Compared to wild type (A), the size of the E13.5 conditional KO mouse liver was diminished (B). The E13.5 conditional KO mouse had a delay in hepatocellular maturation, and decreased hematopoiesis. Compared to wild type (C), hepatocytes contained large nuclei and abundant eosinophilic cytoplasm (D) and were often binucleate, which resembled hepatoblasts (immature developing hepatocytes) rather than hepatocytes. The hepatic sinusoids of the conditional KO mouse at E13.5 were markedly dilated and showed an obvious absence of erythropoietic islands (D) when compared to wild type animals (C). H&E. E–H. Abnormal development of the spleen in a conditional knockout (KO) embryo (F&H) compared to wild type (E&G) presented in case 2. The spleen (black arrow) of the E16.5 wild type mouse (E) contains large numbers of hematopoietic cells at various stages of differentiation (G, immature neutrophils, white arrows) while the spleen (black arrow) of the conditional KO mouse (F) only contains indistinct cells with darkly stained nuclei, mesenchymal cells and nucleated erythrocytes (H). H&E.
Figure 9
Figure 9
A–D. Brain tumor from a Harlan Sprague Dawley rat from an NTP chronic dosed feed toxicity and carcinogenicity bioassay presented as case 1. This was a well-demarcated mass that unilaterally expands the caudate putamen (A) and is composed of two morphologically distinct populations of neoplastic cells (white arrow region in A, higher magnification in B; black arrowhead regions in A, higher magnification in C). Much of the tumor is composed of one morphology (A, white arrow and B) characterized by a moderately dense population of neoplastic cells with small round nuclei and scant to moderate cytoplasm and rare mitoses. The other morphology (A, black arrowheads and C) is less abundant and characterized by multiple regions of densely cellular neoplastic cells. In these regions, the cells are larger and polygonal with moderate amounts of eosinophilic cytoplasm and intervening hyalinized matrix. Multifocal areas of necrosis (A, black arrows; D, higher magnification) were also present. H&E. E–H. Immunohistochemical evaluation of the brain tumor from case 1 at low magnifications and insets with high magnifications for each panel. The majority of neoplastic cells are immunopositive for GFAP (E), Olig2 (F), and GS (G), although there are multifocal small regions which are GFAP negative. There are Iba1 immunopositive cells within and surrounding the tumor (H), but these cells were interpreted to be reactive microglial cells, isolating the tumor from the adjacent neural parenchyma. I–L. Brain tumor from a Harlan Sprague Dawley rat from an NTP chronic dosed feed toxicity and carcinogenicity bioassay presented in case 2. At low magnification (I), the tumor is well-demarcated from the adjacent neural parenchyma and is composed of a dense, relatively monomorphic, neoplastic cell population with small round nuclei with moderate cytoplasm and rare mitoses (I, inset). Multifocally, neoplastic cells palisade around necrotic foci (I, arrows; J, higher magnification). Endothelial proliferation creates distinct vascular garlands along the tumor periphery (K, black arrows). Additional low and high magnification images from a more rostral brain section represent neoplastic infiltration of the lateral ventricle (L), where these cells exhibit the classic “honeycomb” pattern (L, inset) associated with oligodendrogliomas. H&E. M–P. Immunohistochemical evaluation of the brain tumor from case 2 at low magnifications and insets with high magnifications for each panel. The majority of neoplastic cells were immunopositive for GFAP (M), Olig2 (N), and GS (O). There were Iba1 positive cells within and surrounding the tumor (P), which were interpreted to be reactive, rather than neoplastic, microglial cells.
Figure 9
Figure 9
A–D. Brain tumor from a Harlan Sprague Dawley rat from an NTP chronic dosed feed toxicity and carcinogenicity bioassay presented as case 1. This was a well-demarcated mass that unilaterally expands the caudate putamen (A) and is composed of two morphologically distinct populations of neoplastic cells (white arrow region in A, higher magnification in B; black arrowhead regions in A, higher magnification in C). Much of the tumor is composed of one morphology (A, white arrow and B) characterized by a moderately dense population of neoplastic cells with small round nuclei and scant to moderate cytoplasm and rare mitoses. The other morphology (A, black arrowheads and C) is less abundant and characterized by multiple regions of densely cellular neoplastic cells. In these regions, the cells are larger and polygonal with moderate amounts of eosinophilic cytoplasm and intervening hyalinized matrix. Multifocal areas of necrosis (A, black arrows; D, higher magnification) were also present. H&E. E–H. Immunohistochemical evaluation of the brain tumor from case 1 at low magnifications and insets with high magnifications for each panel. The majority of neoplastic cells are immunopositive for GFAP (E), Olig2 (F), and GS (G), although there are multifocal small regions which are GFAP negative. There are Iba1 immunopositive cells within and surrounding the tumor (H), but these cells were interpreted to be reactive microglial cells, isolating the tumor from the adjacent neural parenchyma. I–L. Brain tumor from a Harlan Sprague Dawley rat from an NTP chronic dosed feed toxicity and carcinogenicity bioassay presented in case 2. At low magnification (I), the tumor is well-demarcated from the adjacent neural parenchyma and is composed of a dense, relatively monomorphic, neoplastic cell population with small round nuclei with moderate cytoplasm and rare mitoses (I, inset). Multifocally, neoplastic cells palisade around necrotic foci (I, arrows; J, higher magnification). Endothelial proliferation creates distinct vascular garlands along the tumor periphery (K, black arrows). Additional low and high magnification images from a more rostral brain section represent neoplastic infiltration of the lateral ventricle (L), where these cells exhibit the classic “honeycomb” pattern (L, inset) associated with oligodendrogliomas. H&E. M–P. Immunohistochemical evaluation of the brain tumor from case 2 at low magnifications and insets with high magnifications for each panel. The majority of neoplastic cells were immunopositive for GFAP (M), Olig2 (N), and GS (O). There were Iba1 positive cells within and surrounding the tumor (P), which were interpreted to be reactive, rather than neoplastic, microglial cells.
Figure 10
Figure 10
A–F. Comparison of mammary gland whole mounts (A&D) to the formalin-fixed, H&E stained contralateral mammary glands (B&E) and the whole mount mammary glands that were then processed for histology (C&F). Case 1 (A–C) represents a case of perivascular inflammation. There is an increased opacity around ducts and stromal structures in the carmine stained mammary gland whole mount (A). Figure B is the contralateral mammary gland section with no histopathologic findings. Figure C is a low magnification H&E of the mammary gland prepared from the whole mount that shows clusters of mononuclear cells around the blood vessel and extending into the adjacent adipose tissue. Case 2 (D–F) represents a lobular hyperplasia. In figure D there is an increased opacity around ducts and stromal structures in the carmine stained mammary whole mount. Figure E is the contralateral mammary gland section with no histopathologic findings. Figure F is a low magnification H&E of the mammary gland prepared from the whole mount that shows enlargement of the lobule due to an increase in the number and size of cells (lobuloalveolar hyperplasia).
Figure 11
Figure 11
Overview of the process of sending INHAND nomenclature as published organ systems through the GESC, NCI-EVS representative and SEND CT Group to produce a final map and updated non-neoplastic codelist. INHAND = International Harmonization of Nomenclature and Diagnostic Criteria GESC = Global Editorial and Steering Committee NCI-EVS = National Cancer Institute-Enterprise Vocabulary Service SEND = Standard for the Exchange of Nonclinical Data CT = Controlled Terminology

References

    1. Adams ET, Auerbach S, Blackshear PE, Bradley A, Gruebbel MM, Little PB, Malarkey D, Maronpot R, McKay JS, Miller RA, Moore RR, Morrison JP, Nyska A, Ramot Y, Rao D, Suttie A, Wells MY, Willson GA, Elmore SA. Proceedings of the 2010 National Toxicology Program Satellite Symposium. Toxicol Pathol. 2011;39:240–66. - PMC - PubMed
    1. Alison RH, Elwell MR, Jokinen MP, Dittrich KL, Boorman GA. Morphology and classification of 96 primary cardiac neoplasms in Fischer 344 rats. Vet Pathol. 1987;24:488–94. - PubMed
    1. Bach U, Hailey JR, Hill GD, Kaufmann W, Latimer KS, Malarkey DE, Maronpot RM, Miller RA, Moore RR, Morrison JP, Nolte T, Rinke M, Rittinghausen S, Suttie AW, Travlos GS, Vahle JL, Willson GA, Elmore SA. Proceedings of the 2009 National Toxicology Program Satellite Symposium. Toxicol Pathol. 2010;38:9–36. - PMC - PubMed
    1. Bolon B. The case for developmental pathology and developmental pathologists. CRC Press; India: 2015. pp. 3–9.pp. 1–430.
    1. Bolon B, Carreira V. Pathology of the developing mouse from conception to weaning. In: Bolon B, editor. Pathology of the developing mouse: a systematic approach. CRC Press; Boca Raton: 2015. pp. 293–253.

Publication types

LinkOut - more resources