. 2017 Jan;173(1):536-551.
doi: 10.1104/pp.16.01549. Epub 2016 Nov 7.

VAMP721 Conformations Unmask an Extended Motif for K+ Channel Binding and Gating Control

Affiliations

VAMP721 Conformations Unmask an Extended Motif for K+ Channel Binding and Gating Control

Ben Zhang et al. Plant Physiol. 2017 Jan.

Abstract

Soluble N-ethylmaleimide-sensitive factor attachment protein receptor (SNARE) proteins play a major role in membrane fusion and contribute to cell expansion, signaling, and polar growth in plants. The SNARE SYP121 of Arabidopsis thaliana that facilitates vesicle fusion at the plasma membrane also binds with, and regulates, K+ channels already present at the plasma membrane to affect K+ uptake and K+-dependent growth. Here, we report that its cognate partner VAMP721, which assembles with SYP121 to drive membrane fusion, binds to the KAT1 K+ channel via two sites on the protein, only one of which contributes to channel-gating control. Binding to the VAMP721 SNARE domain suppressed channel gating. By contrast, interaction with the amino-terminal longin domain conferred specificity on VAMP721 binding without influencing gating. Channel binding was defined by a linear motif within the longin domain. The SNARE domain is thought to wrap around this structure when not assembled with SYP121 in the SNARE complex. Fluorescence lifetime analysis showed that mutations within this motif, which suppressed channel binding and its effects on gating, also altered the conformational displacement between the VAMP721 SNARE and longin domains. The presence of these two channel-binding sites on VAMP721, one also required for SNARE complex assembly, implies a well-defined sequence of events coordinating K+ uptake and the final stages of vesicle traffic. It suggests that binding begins with VAMP721, and subsequently with SYP121, thereby coordinating K+ channel gating during SNARE assembly and vesicle fusion. Thus, our findings also are consistent with the idea that the K+ channels are nucleation points for SNARE complex assembly.


Figures

Figure 1.
Figure 1.
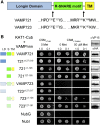
The longin and SNARE domains of VAMP721 interact with the KAT1 K+ channel. A, The longin domain (blue), the SNARE domain (R-SNARE motif; green), and the transmembrane domain (TM; yellow) are shown with sequence breaks used in the protein expression of VAMP721 and VAMP723 as shown. B, Diploid yeast expressing KAT1-Cub as bait with NubG-X fusions of different truncated VAMPs and controls (negative, NubG; positive, NubI) as prey were spotted onto different media as indicated. VAMP721 and VAMP723 were included for comparison. Cartoons (left) provide a guide to the expressed domains. Data are from one of three independent experiments. Growth on CSMLTUM was used to verify the presence of both bait and prey expression. CSMLTUMAH was used to verify adenine- and His-independent growth of the yeast diploids. The addition of 50 μm Met to CSMLTUMAH was used to verify interaction with KAT1-Cub expression suppressed. Yeast were dropped at 1 and 0.1 optical density at 600 nm (OD600) in each case. Incubation time was 24 h for the CSMLTUM plate and 72 h for CSMLTUMAH plates. Western-blot analysis (5 μg of total protein per lane) of the haploid yeast used in mating (right) used αHA antibody for the VAMP fusions and αVP16 antibody for the K+ channel fusions.
Figure 2.
Figure 2.
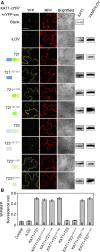
The longin and SNARE domains of VAMP721 interact with the KAT1 K+ channel in vivo. rBiFC analysis shows KAT1 interaction with VAMP721 and VAMP723 and with their truncations. Yellow fluorescent protein (YFP) and red fluorescent protein (RFP) fluorescence was collected from tobacco transformed using the pBiFCt-2in1-NC (Grefen and Blatt, 2012) 2in1 vector. A, Images are (left to right) YFP (rBiFC) fluorescence, RFP fluorescence, and bright field. Constructs (top to bottom) expressed KAT1-cYFP with the empty cassette (Control) or nYFP-X fusions with iLOV as a negative control and with VAMP721, VAMP723, and their truncations. Cartoons (left) provide a guide to the expressed domains. Immunoblot analysis used αHA and αmyc antibodies to verify fusion protein expression (right). Bar = 10 μm. B, rBiFC fluorescence signals from three independent experiments. Each bar represents the mean ± se of fluorescence intensity ratios of 10 images per experiment taken at random over the leaf surface. rBiFC signals were calculated as the mean fluorescence intensity ratio determined from each image set after subtracting the background fluorescence determined from an equivalent number of images taken from nontransformed tissues. Significance is indicated by letters at P < 0.01.
Figure 3.
Figure 3.
Coexpressing the SNARE, but not the longin domain, of VAMP721 suppresses KAT1 K+ current. A, Mean steady-state current-voltage curves recorded under voltage clamp in 30 mm K+ for each set of constructs with oocytes expressing water, VAMP721, and VAMP723 alone (black inverted triangles) and KAT1 alone (white circles) and with VAMP721 (black circles), VAMP723 (white squares), VAMP721Δ127-219 (black squares), VAMP721Δ1-126 (white diamonds), VAMP723Δ127-217 (black triangles), and VAMP723Δ1-126 (white hexagons). Data are means ± se of seven experiments. KAT1 and VAMP cRNAs were coinjected in a 1:4 ratio. Clamp cycles are as follows: holding voltage, −50 mV; voltage steps, 0 to −180 mV; and tail voltage, −50 mV. Representative current traces from one experiment are shown (insets). Solid curves are the results of joint, nonlinear least-squares fitting of the K+ currents (IK) to the Boltzmann function (Eq. 1). Best and visually satisfactory fittings were obtained allowing V1/2 and gmax to vary between curves while holding the voltage-sensitivity coefficient (δ) in common between curves. Scale bars = 10 μA (vertical) and 2 s (horizontal). B and C, Means ± se for the K+ channel-gating parameters V1/2 (B) and current amplitude at −160 mV (C) recorded from oocytes for the data shown in A. Parameters were derived from joint fittings to a Boltzmann function (Eq. 1). Significance is indicated by letters at P < 0.01. Immunoblots verifying VAMP (αHA antibody) and KAT1 (αmyc antibody) expression in oocytes collected after electrical recordings are shown below for one experiment with Ponceau S stain included as a loading control.
Figure 4.
Figure 4.
KAT1 interaction with mutants in the VAMP721Y57A background defines the interaction motif GHTFNY57LVExGxxY. Diploid yeast expressing KAT1-Cub as bait with NubG-X fusions of VAMP721Y57A and its double mutants and controls (negative, NubG; positive, NubI) as prey were spotted onto different media as indicated. VAMP721 and VAMP723 were included for comparison. Data are from one of three independent experiments. Growth on CSMLTUM was used to verify the presence of both bait and prey expression. CSMLTUMAH was used to verify adenine- and His-independent growth of the yeast diploids. The addition of 50 μm Met to CSMLTUMAH was used to verify interaction with KAT1-Cub expression suppressed. Yeast were dropped at 1 and 0.1 OD600 in each case. Incubation time was 24 h for the CSMLTUM plate and 72 h for CSMLTUMAH plates. Western-blot analysis (5 μg of total protein per lane) of the haploid yeast used in mating (right) used αHA antibody for the VAMP fusions and αVP16 antibody for the K+ channel fusions.
Figure 5.
Figure 5.
Mutants in the VAMP721Y57A background affecting KAT1 binding also suppress the K+ current. A, Mean steady-state current-voltage curves recorded under voltage clamp in 30 mm K+ for each set of constructs with oocytes expressing water and VAMP721 alone (black inverted triangles) and KAT1 alone (white circles) and with VAMP721 (black circles), VAMP721Y57D (white diamonds), VAMP721Y57A,F55A (white triangles), VAMP721Y57A,D61A (white inverted triangles), and VAMP721Y57A,Y65A (black squares). KAT1 and VAMP cRNAs were coinjected in a 1:4 ratio. Clamp cycles were as follows: holding voltage, −50 mV; voltage steps, 0 to −180 mV; and tail voltage, −50 mV. Solid curves are the results of joint, nonlinear least-squares fitting of the K+ currents (IK) to a Boltzmann function (Eq. 1). Best and visually satisfactory fittings were obtained allowing V1/2 and gmax to vary between curves while holding the voltage-sensitivity coefficient (δ) in common between curves. Scale bars = 5 μA (vertical) and 2 s (horizontal). B and C, Means ± se for the K+ channel-gating parameters V1/2 (B) and current amplitude at −160 mV (C) recorded from oocytes for the data shown in A. Parameters were derived from joint fittings to a Boltzmann function (Eq. 1). Significance is indicated by letters at P < 0.01. Immunoblots verifying VAMP (αHA antibody) and KAT1 (αmyc antibody) expression in oocytes collected after electrical recordings are shown below for one experiment with Ponceau S stain included as a loading control.
Figure 6.
Figure 6.
VAMP721 longin domain mutants affecting KAT1 binding are altered in longin-SNARE domain conformation. A, Schematic of the GFP-mCherry FRET pair pFRET-NcCg-DEST vector and conformational interpretations and FRET outputs for the VAMP721ΔC and VAMP721ΔC,Y57D constructs. LB, Left border; RB, right border. B, FRET analysis of mCherry and GFP fluorescence by sensitized emission. Images were collected from tobacco transiently transformed with pFRET-NcCg-DEST vector incorporating VAMP721ΔC, VAMP721ΔC,Y57A, VAMP721ΔC,Y57D, VAMP721ΔC,Y57A,F55A, VAMP721ΔC,Y57A,D61A, and VAMP721ΔC,Y57A,Y65A, including SYP121ΔC and SYP121ΔC,L185A,D186A as controls. Images are (left to right) mCherry acceptor fluorescence excited with 488-nm light (FRET), mCherry acceptor fluorescence excited with 552-nm light (acceptor reference signal), GFP fluorescence excited with 488-nm light (donor reference signal), and bright field. Bar = 20 μm. C, Mean ± se of FRET fluorescence ratios from three independent experiments for each of the constructs in B. Data are from each experiment determined from 10 images selected at random over the leaf surface. FRET ratios were calculated as the mean fluorescence intensity ratio [mCherry (488)/mCherry (552)] determined from each image set after subtracting the background fluorescence determined from images taken from nontransformed tissues and validated by acceptor bleaching (see Fig. 10). Data were normalized subsequently to the GFP (488) signal from each image. Significance at P < 0.01 is indicated by letters.
Figure 7.
Figure 7.
Fluorescence lifetime and photobleaching analyses show that VAMP721ΔC,Y57D affects the conformational spacing of the longin and SNARE domains. A, FRET fluorescence image analysis of GFP donor fluorescence lifetimes on transiently expressing VAMP721∆C and VAMP721∆C,Y57D with SYP121∆C and SYP121∆C,L185A,D186A as controls in the pFRET-NcCg-DEST vector in tobacco. FRET-FLIM data are means ± se with significance at P < 0.01 indicated by letters. Images (above) show pseudocolor-coded GFP fluorescence lifetimes. B, Analysis of GFP fluorescence lifetimes before and after photobleaching with 552-nm light with GFP-VAMP721∆C (a) and with GFP-VAMP721∆C,Y57D-mCherry (b) in the pFRET-NcCg-DEST vector. The photobleach area and line scans taken for analysis are indicated by the yellow squares and the white lines. Five images were recorded each before and after photobleaching. GFP fluorescence before (blue) and after (red) photobleaching along each line scan is shown in c and d. Bar = 20 μm. C, Means ± se of FRET efficiency from three independent photobleaching experiments calculated as the ratio (DaDb)/Da, where Da and Db are the mean GFP intensities after and before photobleaching, respectively. Significance at P < 0.01 is indicated by letters.
Figure 8.
Figure 8.
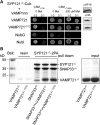
The single-site mutant VAMP721Y57D, which does not interact with the KAT1 channel, is able to bind its cognate SNARE partners and form the SNARE core complex. A, Yeast mbSUS assay using mOST4-SYP121ΔC as bait and VAMP721 or VAMP721Y57D as prey-alone controls (negative, NubG; positive, NubI). Data are from one of three independent experiments. Growth on CSMLTUM was used to verify the presence of both bait and prey expression. CSMLTUMAH was used to verify adenine- and His-independent growth of the yeast diploids. The addition of 500 μm Met to CSMLTUMAH was used to verify the interaction with suppressed KAT1-Cub expression. Yeast were dropped at 1 and 0.1 OD600. Incubation time was 24 h for CSMLTUM and 72 h for CSMLTUMAH. Western-blot analysis (5 μg of total protein per lane) of the haploid yeast with αHA antibody (VAMP fusions) and αVP16 antibody (SYP121ΔC) verified the expression of the various constructs (right). B, Coomassie Blue-stained gels showing proteins recovered in pull-down assays using SYP121ΔC-2PA as bait. Lanes are (left to right) the molecular mass marker, VAMP721ΔC and VAMP721ΔC,Y57D pull downs with only resin as bait, and pull downs with SNAP33Δ1-100 alone, SNAP33Δ1-100 + VAMP721ΔC, and SNAP33Δ1-100 + VAMP721ΔC,Y57D using SYP121ΔC-2PA as bait. Equivalent aliquots of the inputs VAMP721ΔC and VAMP721ΔC,Y57D are included (right). SYP121ΔC-2PA, SNAP33Δ1-100, and VAMP721ΔC bands are indicated. Proteins were purified, and prey proteins were added in a 5-fold excess to the baits as described previously (Karnik et al., 2013b, 2015).
Figure 9.
Figure 9.
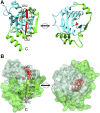
The predicted structure of VAMP721 in ribbon (A) and partially transparent surface (B) representations. Structural predictions were obtained with Phyre2 software (Kelley and Sternberg, 2009) using the structures of the yeast proteins SEC22 and YKT6 as well as VAMP7 from humans (Gonzalez et al., 2001; Tochio et al., 2001; Kent et al., 2012). A, Ribbon structural representation of VAMP721 without the C-terminal transmembrane anchor in side (left) and top (right) views. The top view is rotated 90° about the horizontal axis, with Gly-62 in front. The longin domain is shown in cyan and the SNARE domain in green Residues of the GHTFNY57LVExGxxY motif are indicated by the red β-sheet with the position of Tyr-57 indicated centrally in yellow. B, Transparent space-filling structural representation of VAMP721 as in A in side (left) and top (right) views. The top view is rotated 90° about the horizontal axis, with Gly-62 in front. The longin domain is shown in cyan and the SNARE domain in green Residues of the GHTFNY57LVExGxxY motif are indicated by the red β-sheet with the position of Tyr-57 indicated centrally in yellow.
Figure 10.
Figure 10.
Hypothetical model for K+ channel exchange between VAMP721 and SYP121 during vesicle fusion. This condensed sequence builds on current knowledge of SNARE complex formation, including the role for the Sec1/Munc18 protein SEC11 (Karnik et al., 2013b, 2015). For clarity, only the SNAREs SYP121 and VAMP721 are shown. A, Vesicle approach with VAMP721 leads to its binding with the K+ channel through both the longin and SNARE domains, facilitating the unwrapping of the SNARE domain. B, The unwrapped VAMP721-K+ channel complex recruits SYP121 and unlatches SEC11. Interaction between SYP121 and the K+ channel, and the release of the VAMP721 SNARE domain, promote channel activity. Not shown for clarity is the relatching of SEC11 to stabilize the SNARE complex for vesicle fusion. C, SNARE complex assembly drives the final stages of membrane fusion followed by release of the channel interaction in preparation for SNARE recycling.

References

    1. Aakre CD, Herrou J, Phung TN, Perchuk BS, Crosson S, Laub MT (2015) Evolving new protein-protein interaction specificity through promiscuous intermediates. Cell 163: 594–606 - PMC - PubMed
    1. Bassham DC, Blatt MR (2008) SNAREs: cogs and coordinators in signaling and development. Plant Physiol 147: 1504–1515 - PMC - PubMed
    1. Blatt MR, Grefen C (2014) Applications of fluorescent marker proteins in plant cell biology. Methods Mol Biol 1062: 487–507 - PubMed
    1. Bock JB, Matern HT, Peden AA, Scheller RH (2001) A genomic perspective on membrane compartment organization. Nature 409: 839–841 - PubMed
    1. Chapman S, Faulkner C, Kaiserli E, Garcia-Mata C, Savenkov EI, Roberts AG, Oparka KJ, Christie JM (2008) The photoreversible fluorescent protein iLOV outperforms GFP as a reporter of plant virus infection. Proc Natl Acad Sci USA 105: 20038–20043 - PMC - PubMed

Publication types

MeSH terms