. 2016 Nov 22;113(47):E7500-E7509.
doi: 10.1073/pnas.1608767113. Epub 2016 Nov 7.

Chemical and mechanical stimuli act on common signal transduction and cytoskeletal networks

Affiliations

Chemical and mechanical stimuli act on common signal transduction and cytoskeletal networks

Yulia Artemenko et al. Proc Natl Acad Sci U S A. .

Erratum in

Abstract

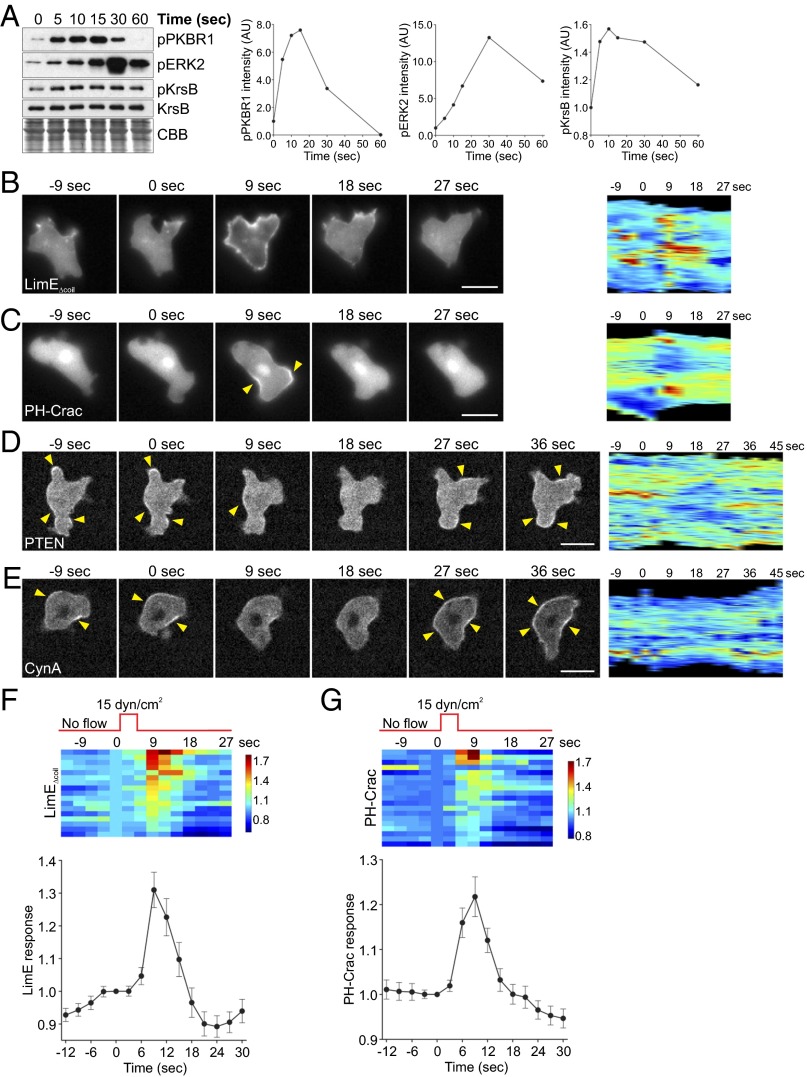
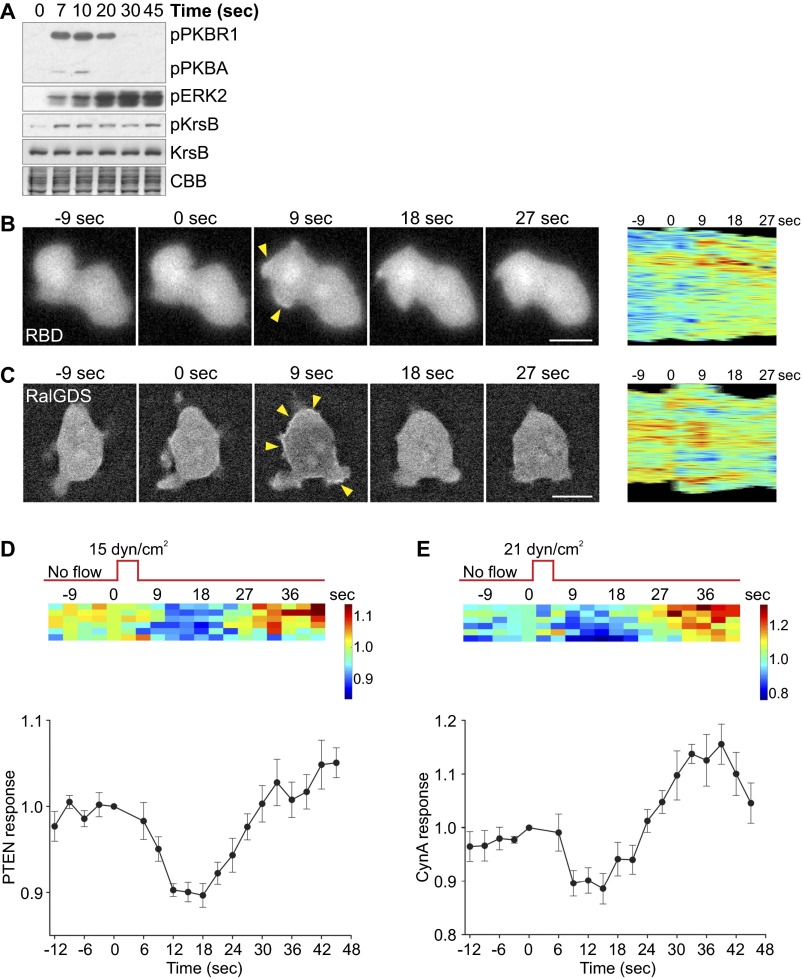
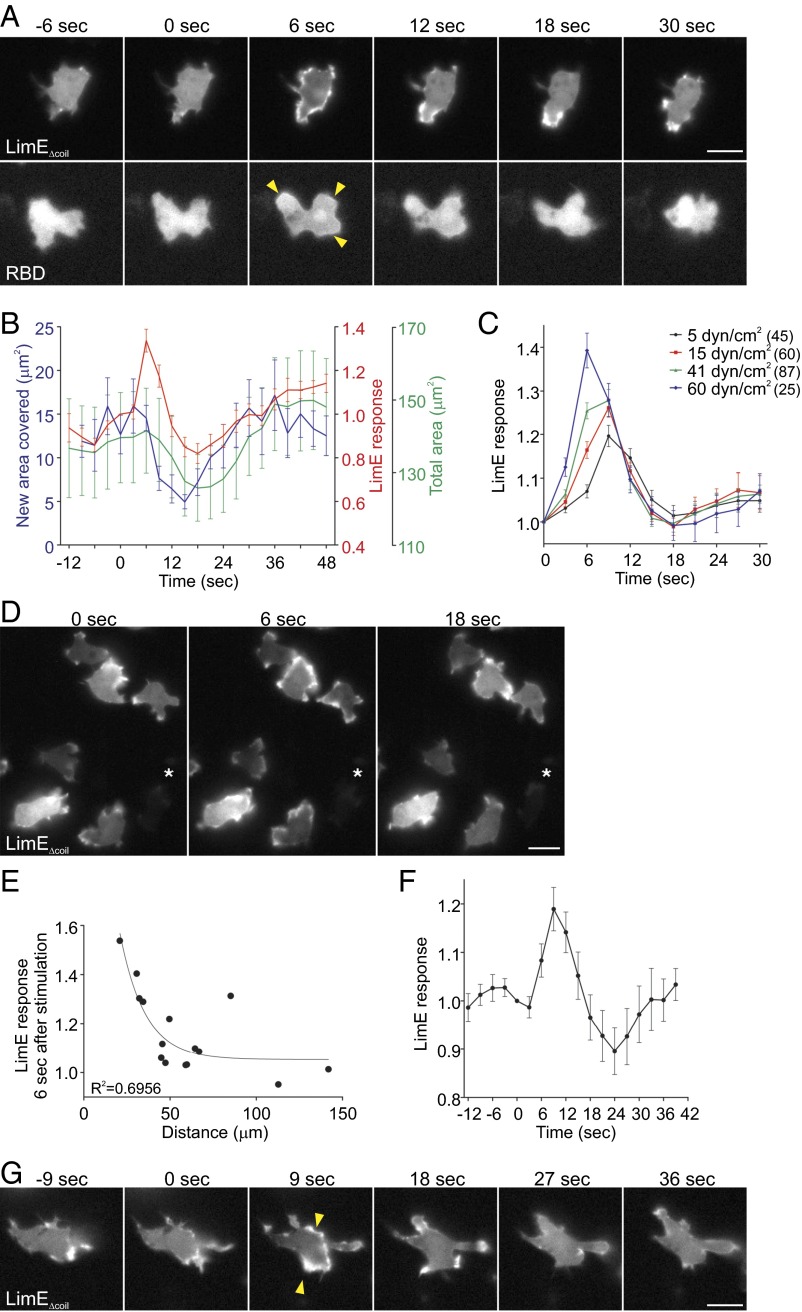
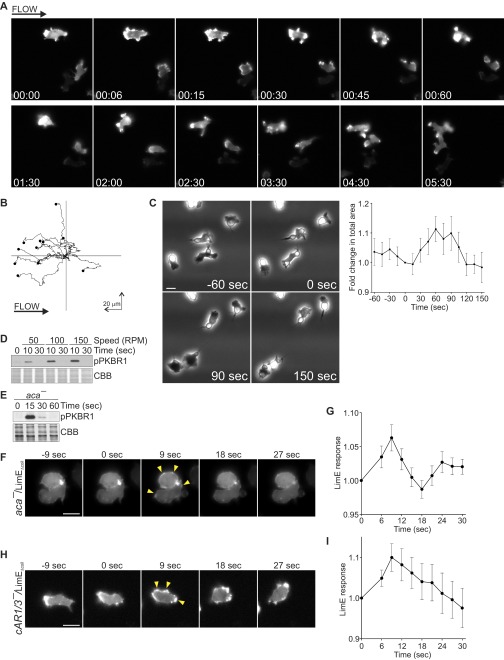
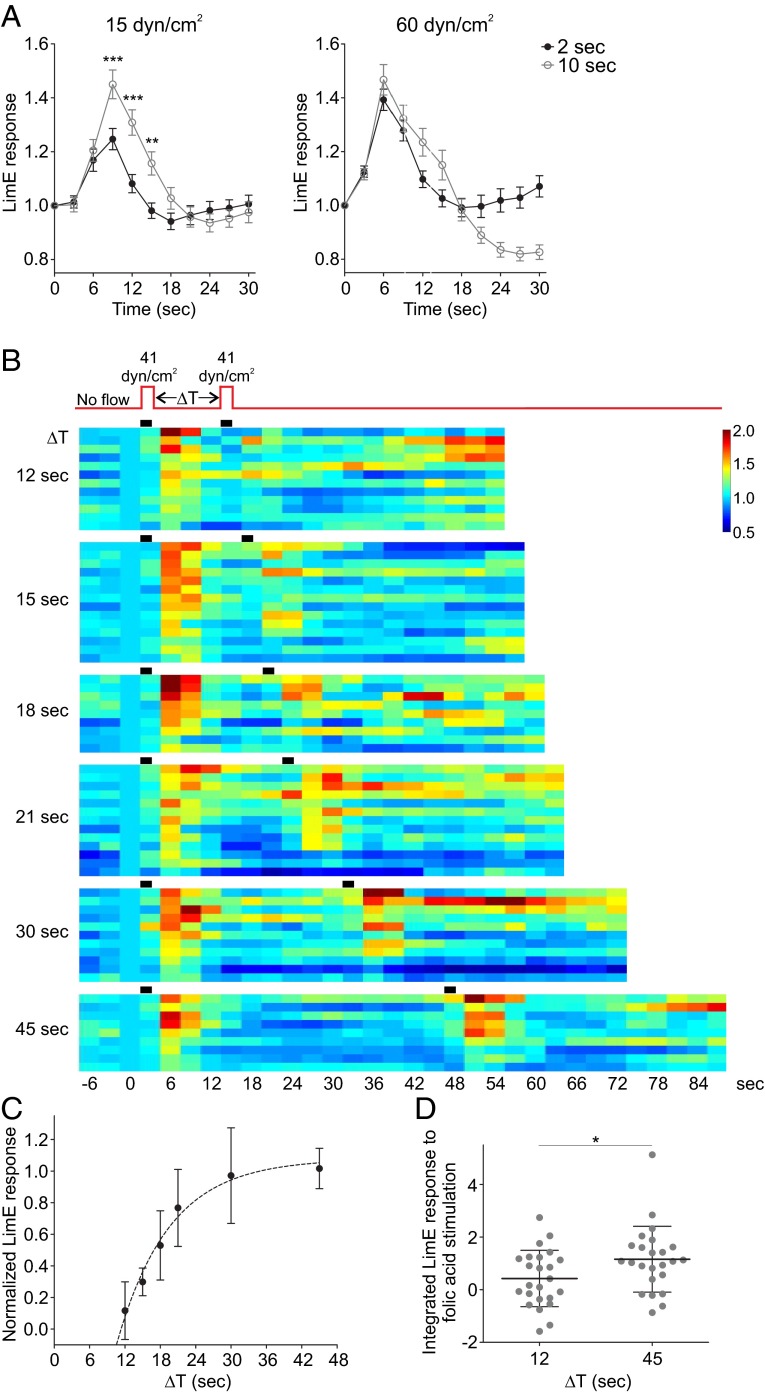
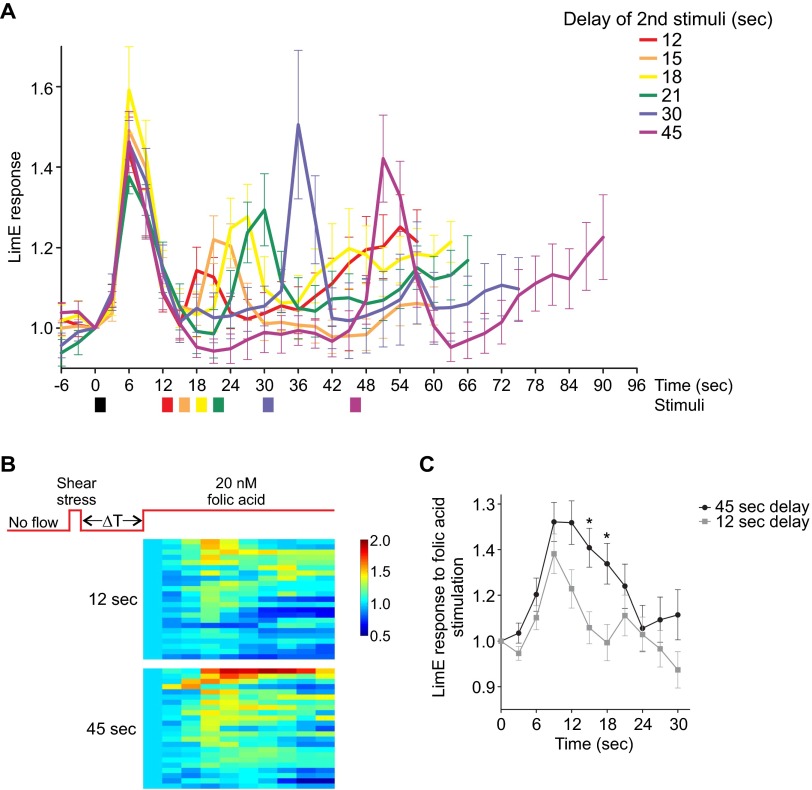
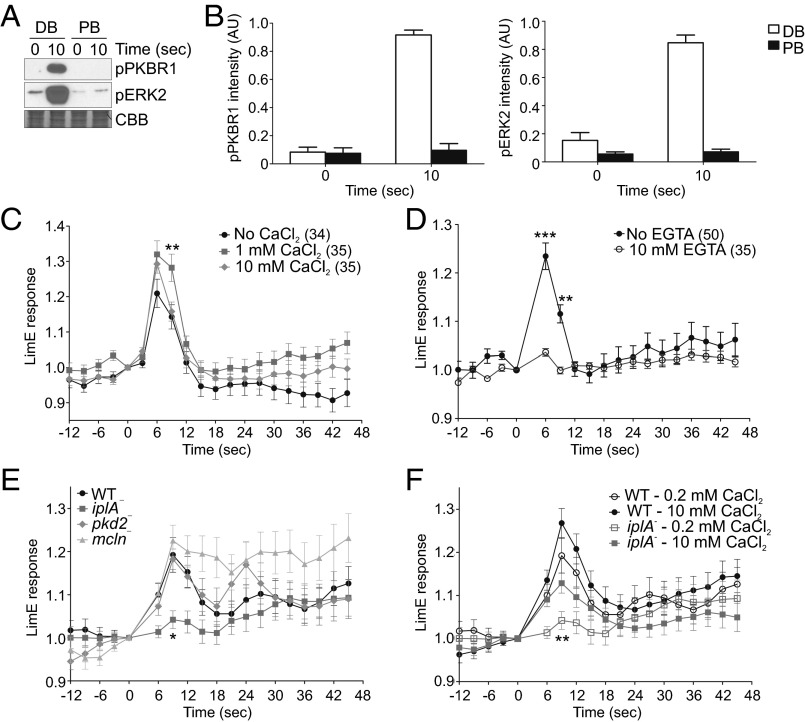
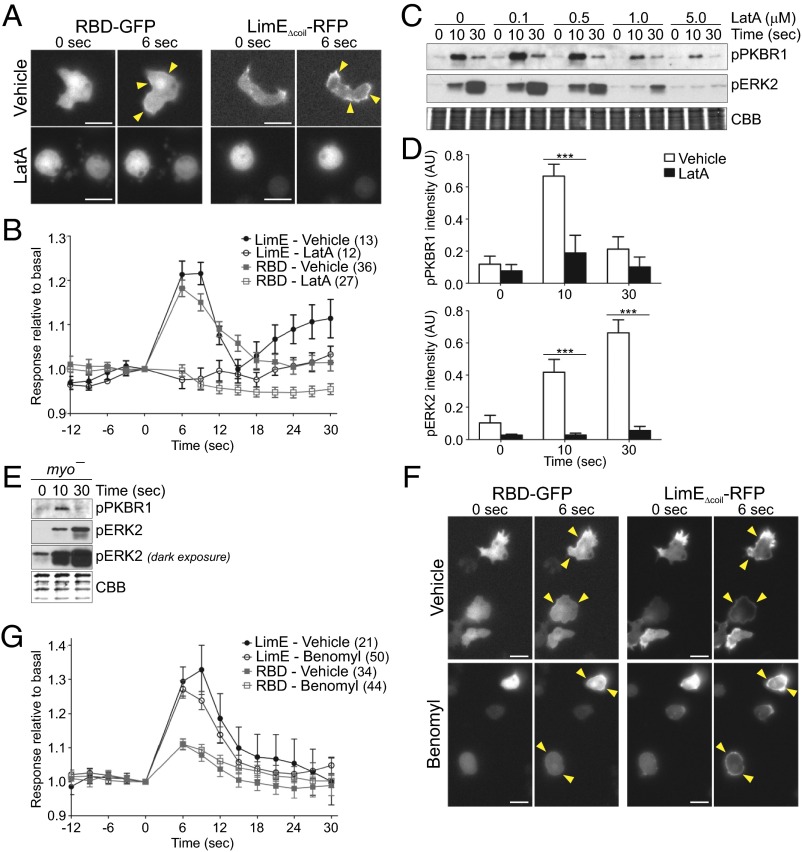
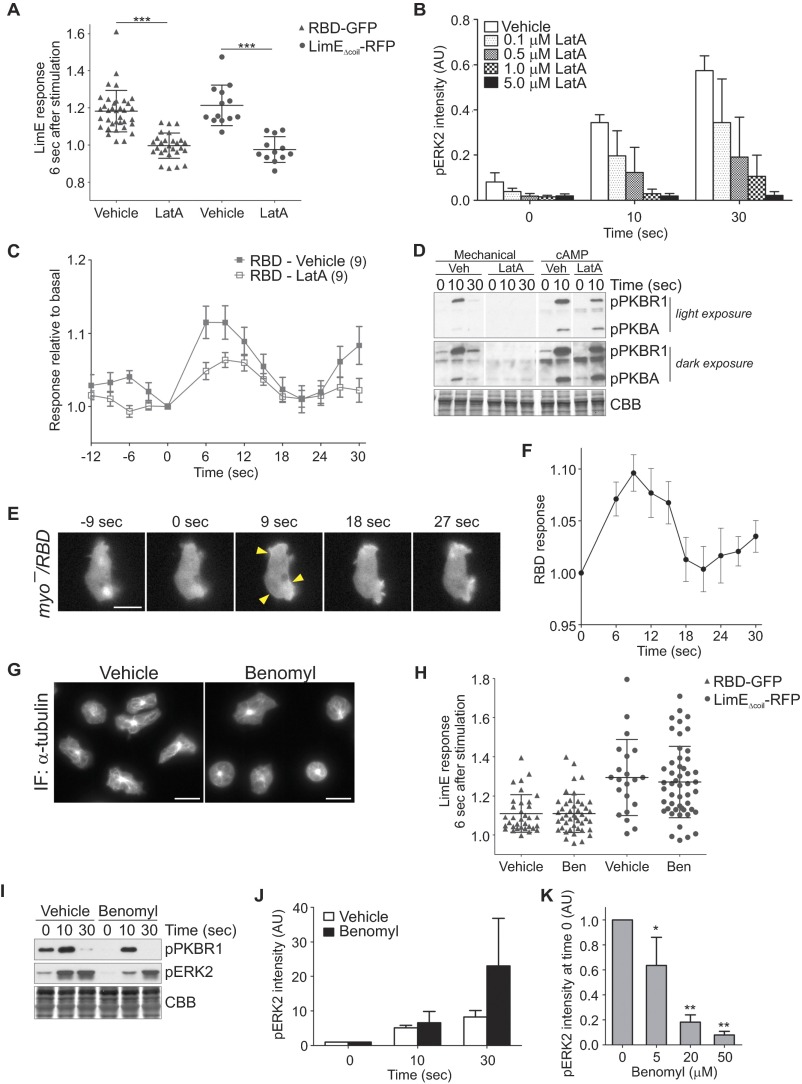
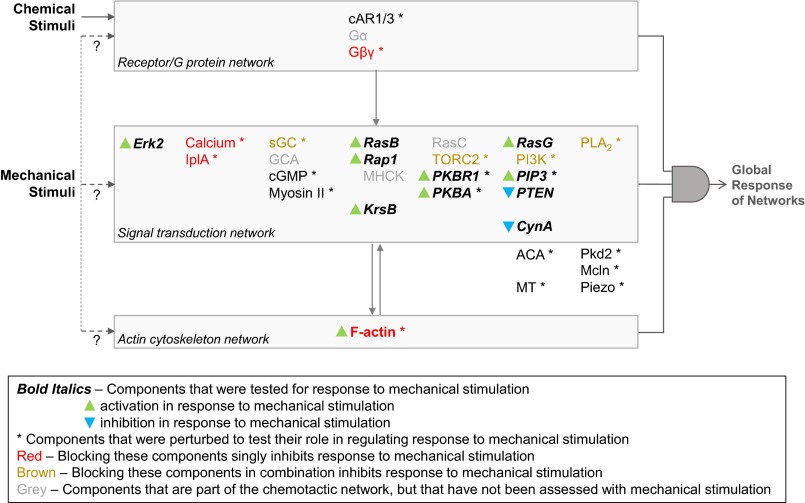
Signal transduction pathways activated by chemoattractants have been extensively studied, but little is known about the events mediating responses to mechanical stimuli. We discovered that acute mechanical perturbation of cells triggered transient activation of all tested components of the chemotactic signal transduction network, as well as actin polymerization. Similarly to chemoattractants, the shear flow-induced signal transduction events displayed features of excitability, including the ability to mount a full response irrespective of the length of the stimulation and a refractory period that is shared with that generated by chemoattractants. Loss of G protein subunits, inhibition of multiple signal transduction events, or disruption of calcium signaling attenuated the response to acute mechanical stimulation. Unlike the response to chemoattractants, an intact actin cytoskeleton was essential for reacting to mechanical perturbation. These results taken together suggest that chemotactic and mechanical stimuli trigger activation of a common signal transduction network that integrates external cues to regulate cytoskeletal activity and drive cell migration.

Keywords: biochemical excitability; biomechanics; inflammation; motility; shear stress.


Conflict of interest statement

The authors declare no conflict of interest.

Figures

Fig. 1.
Fig. 1.
Acute mechanical stimulation activates multiple signal transduction pathways. (A) Aggregation-competent WT cells were stimulated on a rotary shaker for 5 s, lysed at the indicated time points, and immunoblotted using antibodies that recognize phosphorylated PKBR1, ERK2, and KrsB, as well as total KrsB. The membrane was stained with Coomassie Brilliant Blue (CBB) to show equal protein loading. The mean intensity of the phosphorylated bands was normalized for the intensity of the corresponding total KrsB bands and plotted against time. Another example of the time course of protein phosphorylation in response to acute mechanical stimulation is shown in Fig. S1A. (BG) Aggregation-competent WT cells expressing various fluorescently tagged biosensors were stimulated with unidirectional laminar flow at 15 dyn/cm2 (BD) or 21 dyn/cm2 (E) for 2–5 s. Images were collected every 3 s. (BE) A representative cell showing translocation of LimEΔcoil (B), PH-Crac (C), PTEN (D), and CynA (E) in response to mechanical stimulation. A kymograph showing changes in the cortical signal along the entire cell perimeter (shown as a vertical line) with time is shown for each cell. Arrowheads point to areas of biosensor accumulation at the cortex. (F and G) LimEΔcoil (F) or PH-Crac (G) accumulation at the cortex was quantified as the inverse of the mean cytoplasmic intensity normalized for time 0. Responses of individual cells are represented as rows on a heat map. The average response of 18 (F) or 20 (G) cells is shown at Bottom. Values are mean ± SE. Similar analysis of PTEN and CynA is shown in Fig. S1 D and E. (Scale bar, 10 µm.)
Fig. S1.
Fig. S1.
Acute mechanical stimulation activates multiple signal transduction pathways. (A) Time course of protein phosphorylation in response to acute mechanical stimulation (as in Fig. 1A). Aggregation-competent WT cells were stimulated on a rotary shaker for 5 s, lysed at the indicated time points, and immunoblotted using antibodies that recognize phosphorylated PKBR1 and PKBA, ERK2, and KrsB, as well as total KrsB. The membrane was stained with CBB to show equal protein loading. (B and C) Aggregation-competent WT cells expressing RBD-GFP (B) or RalGDS-GFP (C) were stimulated with unidirectional laminar flow at 41 (B) or 21 (C) dyn/cm2 for 2 s. Images were collected every 3 s. A kymograph showing changes in the cortical signal along the entire cell perimeter (shown as a vertical line) with time is shown for each cell. Arrowheads point to areas of biosensor accumulation at the cortex. (D and E) PTEN (D) or CynA (E) accumulation at the cortex was quantified as the inverse of the mean cytoplasmic intensity normalized for time 0 as in Fig. 1 F and G. Responses of individual cells are represented as rows on a heat map. The average response of six cells is shown at Bottom. Values are mean ± SE. (Scale bar, 10 µm.)
Fig. 2.
Fig. 2.
Response to shear flow is due to mechanical perturbation and not to soluble factors. (A and B) Vegetative WT cells expressing LimEΔcoil-RFP or RBD-GFP were stimulated with unidirectional laminar flow at 41 dyn/cm2 for 2 s. Images were collected every 3 s. Representative images are shown in A. (B) LimEΔcoil-RFP accumulation at the cortex was quantified as in Fig. 1F. New area occupied by the cell was calculated using the number of new pixels covered by a cell in consecutive frames. Values are mean ± SE of 8 cells. (C) Vegetative WT cells expressing LimEΔcoil-RFP were stimulated at the indicated shear stress values, imaged, and analyzed as in B. The number of cells analyzed is indicated beside each condition. (D) Vegetative WT cells expressing LimEΔcoil-RFP were exposed to a micropipette that provided a background flow of the assay buffer. At time 0, a brief bolus of assay buffer was delivered, after which the cells were returned to the background flow rate condition. Images were collected every 3 s. (E) Peak LimEΔcoil-RFP accumulation at the cortex following stimulation in D for 15 individual cells was plotted against the distance between the cell centroid and the tip of the micropipette. Peak accumulation was quantified as the inverse of the mean cytoplasmic intensity 6 s after the start of stimulation, normalized for time 0. The trendline represents a fit to a one-phase decay. (F and G) Vegetative WT cells expressing LimEΔcoil-RFP were imaged under constant shear flow at ∼5 dyn/cm2. At time 0, the shear stress was increased to ∼60 dyn/cm2 for 5 s by transiently increasing the flow rate. (F) LimEΔcoil-RFP accumulation at the cortex was quantified as in Fig. 1F. Values are mean ± SE of 20 cells. Arrowheads point to areas of biosensor accumulation at the cortex. A representative cell is shown in G. (Scale bar, 10 µm.)
Fig. S2.
Fig. S2.
Response to shear flow is due to mechanical perturbation and not due to soluble factors. (A and B) Vegetative WT cells expressing LimEΔcoil-RFP were exposed to continuous unidirectional laminar flow at 15 dyn/cm2 and imaged every 3 s. Tracks of 11 cells are shown in B. (C) Differentiated HL-60 cells were stimulated with unidirectional laminar flow at 15 dyn/cm2 for 5 s. Images were collected every 15 s, and cell area was measured at every frame. Average area of 17 cells is shown as mean ± SE at Right. (D) Aggregation-competent WT cells were stimulated on a rotary shaker at 50, 100, or 150 rpm for 5 s, lysed at the indicated time points, and immunoblotted using an antibody that recognizes phosphorylated PKBR1. The membrane was stained with CBB to show equal protein loading. (E) Aggregation-competent aca cells were stimulated on a rotary shaker at 150 rpm for 5 s, lysed, and immunoblotted as in D. (F and G) Aggregation-competent aca cells expressing LimEΔcoil-RFP were stimulated with unidirectional laminar flow at 15 dyn/cm2 for 5 s. Images were collected every 3 s. A representative cell is shown in F. (G) LimEΔcoil-RFP accumulation at the cortex was quantified as in Fig. 1F. Values are mean ± SE of 16 cells. (H and I) Vegetative cAR1/3 cells expressing LimEΔcoil-RFP were stimulated with unidirectional laminar flow at 15 dyn/cm2 for 2 s. Images were collected every 3 s. A representative cell is shown in H. (I) LimEΔcoil-RFP accumulation at the cortex was quantified as in Fig. 1F. Values are mean ± SE of 23 cells. Arrowheads point to areas of biosensor accumulation at the cortex. (Scale bar, 10 µm.)
Fig. 3.
Fig. 3.
Response to acute mechanical stimulation has characteristics of excitability. (A) Vegetative WT cells expressing LimEΔcoil-RFP were stimulated with unidirectional laminar flow at 15 or 60 dyn/cm2 for 2 or 10 s. Images were collected every 3 s. LimEΔcoil-RFP accumulation at the cortex was quantified as in Fig. 1F. Values are mean ± SE of 40 and 34 cells for 15 dyn/cm2 for 2 s and 10 s, and 25 and 30 cells for 60 dyn/cm2 for 2 s and 10 s. (B and C) Vegetative WT cells expressing LimEΔcoil-RFP were stimulated with unidirectional laminar flow at 41 dyn/cm2 twice, separated by varying delays (ΔT), and images were collected every 3 s. LimEΔcoil-RFP accumulation at the cortex was quantified as in Fig. 1F. Average values are shown in Fig. S3A. (B) The response of individual cells, represented as rows on a heat map, show cell-to-cell variations. (C) Average ratio of the peak response 6 s after the second stimulation to 6 s after the first stimulation was plotted against ΔT. Values are mean ± SE of 10–14 cells. The trendline is based on a one-phase decay function. (D) Vegetative WT cells expressing LimEΔcoil-RFP were first manually stimulated with shear flow; after a delay of 12 or 45 s, they were then stimulated with 20 nM folic acid. Images were collected every 3 s. LimEΔcoil-RFP accumulation at the cortex was quantified as the inverse of the mean cytoplasmic intensity normalized for time 0 of folic acid application and corrected for vehicle addition alone. The integrated response between 0 and 24 s after folic acid stimulation is shown. Horizontal lines and error bars represent mean ± SD, *P < 0.05.
Fig. S3.
Fig. S3.
Response to acute mechanical stimulation has characteristics of excitability. (A) Vegetative WT cells expressing LimEΔcoil-RFP were stimulated with unidirectional laminar flow at 41 dyn/cm2 twice with varying intervals. Images were collected every 3 s. LimEΔcoil-RFP accumulation at the cortex was quantified as in Fig. 1F. Values are mean ± SE of 10–14 cells. (B and C) Vegetative WT cells expressing LimEΔcoil-RFP were manually stimulated with shear flow followed by stimulation with 20 nM folic acid 12 or 45 s after the first stimulation. Images were collected every 3 s. LimEΔcoil-RFP accumulation at the cortex was quantified as the inverse of the mean cytoplasmic intensity normalized for time 0 of folic acid application and corrected for vehicle addition alone. (B) Heat maps showing variation in the response of 24 individual cells for each treatment. Individual cells are represented as rows on the heat map. (C) Average behavior of the cells in B is shown as mean ± SE, *P < 0.05.
Fig. 4.
Fig. 4.
Effect of inhibition of the signal transduction network and G proteins on the response to acute mechanical stimulation. (A and B) Vegetative WT cells (A), or sGC, sGC/pla2, and sGC/pla2/pia cells (B) expressing LimEΔcoil-RFP were treated with vehicle or 50 µM LY294002 for at least 30 min and then stimulated with unidirectional laminar flow at 41 dyn/cm2 for 2 s. Images were collected every 3 s. LimEΔcoil-RFP accumulation at the cortex was quantified as in Fig. 1F. Values are mean ± SE. The number of cells analyzed is indicated beside each condition. Peak response values for individual cells are shown in Fig. S4 A and B. (C and D) Randomly migrating vegetative WT (C) or sGC, sGC/pla2, and sGC/pla2/pia (D) cells treated with vehicle or 50 µM LY294002 for 60 min were imaged every 20 s for 20 min. Tracks of 20 cells are shown. (E and F) Vegetative gpgA expressing vector or GpgA, as well as LimEΔcoil-RFP were stimulated with unidirectional laminar flow at the indicated pressure for 2 s. Images were collected every 3 s. Representative cells are shown in E. (F) Peak LimEΔcoil-RFP accumulation at the cortex of individual cells was quantified as the inverse of the mean cytoplasmic intensity 6 s after the start of stimulation, normalized for time 0. Horizontal lines and error bars represent mean ± SD, *P < 0.05, **P < 0.01. (G) WT or gpgA cells migrating in the absence or presence of flow were imaged every 15 s for 15 min. Tracks of 50 cells are shown. Arrowheads point to areas of biosensor accumulation at the cortex. (Scale bar, 10 µm.)
Fig. S4.
Fig. S4.
Effect of inhibition of the signal transduction network and G proteins on the response to acute mechanical stimulation. (A and B) Vegetative WT cells (A), or sGC, sGC/pla2, and sGC/pla2/pia cells (B) expressing LimEΔcoil-RFP were treated with vehicle or 50 µM LY294002 for at least 30 min and then stimulated with unidirectional laminar flow at 41 dyn/cm2 for 2 s. Images were collected every 3 s. Peak LimEΔcoil-RFP accumulation at the cortex of individual cells was quantified as the inverse of the mean cytoplasmic intensity 6 s (A) or 9 s (B) after the start of stimulation, normalized for time 0. Horizontal lines and error bars represent mean ± SD, **P < 0.01, ***P < 0.001 compared with sGC with vehicle. (C) WT or gpbA cells migrating in the absence or presence of flow at two different pressures were imaged every 15 s for 15 min. Tracks of 50 cells are shown.
Fig. 5.
Fig. 5.
Role of cations and cation channels in the response to acute mechanical stimulation. (A and B) Aggregation-competent WT cells in phosphate buffer (PB) or PB supplemented with 2 mM MgSO4 and 0.2 mM CaCl2 [developmental buffer (DB)] were stimulated on a rotary shaker for 5 s, lysed at the indicated time points, and immunoblotted with antibodies that recognize phosphorylated PKBR1 and ERK2. The membrane was stained with CBB to show equal protein loading. A representative immunoblot is shown in A. (B) Mean intensity of phospho-PKBR1 and phospho-ERK2 bands was normalized for the integrated intensity of 0- and 10-s DB bands. Values are mean ± SE of four independent experiments. (C and D) Vegetative WT cells expressing LimEΔcoil-RFP were kept in tricine buffer, treated with the indicated concentrations of CaCl2 for at least 5 min (C) or with 10 mM EGTA or vehicle for at least 30 min (D) and then stimulated with unidirectional laminar flow at 41 dyn/cm2 for 2 s. Images were collected every 3 s. LimEΔcoil-RFP accumulation at the cortex was quantified as in Fig. 1F. Values are mean ± SE. The number of cells analyzed is indicated beside each condition. Peak response values for individual cells are shown in Fig. S5 B and C. (E and F) Vegetative WT, iplA, pkd2, or mcln cells expressing LimEΔcoil-RFP were kept in tricine buffer supplemented with 0.2 mM CaCl2 (E and F) or 10 mM CaCl2 (F), and then stimulated with unidirectional laminar flow, imaged, and analyzed as in C. Values are mean ± SE of 30 cells. Peak response values for individual cells in F are shown in Fig. S5D. *P < 0.05, **P < 0.01, ***P < 0.001 compared with WT or vehicle control, unless indicated otherwise.
Fig. S5.
Fig. S5.
Role of cations and cation channels in the response to acute mechanical stimulation. (A) Aggregation-competent WT cells in DB [phosphate buffer (PB) supplemented with 2 mM MgSO4 and 0.2 mM CaCl2], PB, or PB supplemented with 1 mM CaCl2 or 1 mM MgCl2 either alone or in combination were stimulated on a rotary shaker for 5 s, lysed at the indicated time points, and immunoblotted using antibodies that recognize phosphorylated PKBR1 and ERK2. The membrane was stained with CBB to show equal protein loading. An immunoblot representative of two independent experiments is shown. (B and C) Vegetative WT cells expressing LimEΔcoil-RFP were kept in tricine buffer, treated with the indicated concentrations of CaCl2 for at least 5 min (B) or with 10 mM EGTA or vehicle for at least 30 min (C), and then stimulated with unidirectional laminar flow at 41 dyn/cm2 for 2 s. Images were collected every 3 s. Peak LimEΔcoil-RFP accumulation at the cortex of individual cells was quantified as the inverse of the mean cytoplasmic intensity 6 s after the start of stimulation, normalized for time 0. Horizontal lines and error bars represent mean ± SD. (D) Vegetative WT and iplA cells expressing LimEΔcoil-RFP were kept in tricine buffer supplemented with 0.2 mM or 10 mM CaCl2, stimulated with unidirectional laminar flow, imaged, and analyzed as in B. (E and F) Aggregation-competent WT or piezo (two independent clones) cells were stimulated on a rotary shaker for 5 s, lysed at the indicated time points, and immunoblotted with antibodies that recognize phosphorylated PKBR1 and ERK2. The membrane was stained with CBB to show equal protein loading. A representative immunoblot is shown in E. (F) The mean intensity of the phospho-PKBR1 and phospho-ERK2 bands was normalized for the integrated intensity of 0- and 10-s WT bands. Values are mean ± SE of four independent experiments. (G) Vegetative WT or piezo (clone 1) cells expressing LimEΔcoil-RFP were stimulated with unidirectional laminar flow and imaged as in B. LimEΔcoil-RFP accumulation at the cortex was quantified as in Fig. 1F. Values are mean ± SE. The number of cells analyzed is indicated beside each condition.
Fig. 6.
Fig. 6.
Role of the cytoskeleton in the response to acute mechanical stimulation. (A and B) Vegetative WT cells expressing LimEΔcoil-RFP or RBD-GFP were treated with vehicle or 5 µM LatA for at least 15 min, and then stimulated with unidirectional laminar flow at 41 dyn/cm2 for 2 s. Images were collected every 3 s. Representative cells are shown in A. (B) RBD-GFP and LimEΔcoil-RFP accumulation at the cortex was quantified as in Fig. 1F. Values are mean ± SE. The number of cells analyzed is indicated beside each condition. Peak response values for individual cells are shown in Fig. S6A. (C and D) Aggregation-competent WT cells were pretreated with LatA for 30 min, stimulated on a rotary shaker for 5 s, lysed at the indicated time points, and immunoblotted using antibodies that recognize phosphorylated PKBR1 or ERK2. The membrane was stained with CBB to show equal protein loading. A blot representative of three independent experiments is shown in C and quantified in Fig. S6B. (D) The mean intensity of the phosphorylated bands for vehicle and 5 µM LatA was normalized for the integrated intensity of 0-, 10-, and 30-s vehicle bands. Values are mean ± SE of 5 (pPKBR1) and 6 (pERK2) independent experiments. (E) Aggregation-competent myo cells were stimulated on a rotary shaker for 5 s, lysed, and immunoblotted as in C. A blot representative of at least two independent experiments is shown. (F and G) Vegetative WT cells expressing LimEΔcoil-RFP or RBD-GFP were treated with vehicle or 50 µM benomyl for at least 20 min and then stimulated with unidirectional laminar flow at 41 dyn/cm2 for 2 s. Images were collected every 3 s. Representative cells are shown in F. (G) RBD-GFP and LimEΔcoil-RFP accumulation at the cortex was quantified as the inverse of the mean cytoplasmic intensity normalized for time 0. Values are mean ± SE. The number of cells analyzed is indicated beside each condition. Peak response values for individual cells are shown in Fig. S6F. ***P < 0.001. Arrowheads point to areas of biosensor accumulation at the cortex. (Scale bar, 10 µm.)
Fig. S6.
Fig. S6.
Role of the cytoskeleton in the response to acute mechanical stimulation. (A) Vegetative WT cells expressing LimEΔcoil-RFP or RBD-GFP were treated with vehicle or 5 µM LatA for at least 15 min and then stimulated with unidirectional laminar flow at 41 dyn/cm2 for 2 s. Images were collected every 3 s. Peak RBD-GFP and LimEΔcoil-RFP accumulation at the cortex of individual cells was quantified as the inverse of the mean cytoplasmic intensity 6 s after the start of stimulation, normalized for time 0. Horizontal lines and error bars represent mean ± SD, ***P < 0.001. (B) Aggregation-competent WT cells were pretreated with LatA for 30 min, stimulated on a rotary shaker for 5 s, lysed at the indicated time points, and immunoblotted using antibodies that recognize phosphorylated ERK2 (Fig. 3C). The mean intensity of the phosphorylated bands was normalized for the integrated intensity of 0-, 10-, and 30-s vehicle bands. Values are mean ± SE of three independent experiments. (C) Vegetative WT cells expressing RBD-GFP were treated with vehicle or 5 µM LatA for at least 15 min and then stimulated with 100 µM folic acid. Images were collected every 3 s. RBD-GFP accumulation at the cortex was quantified as in Fig. 1F. Values are mean ± SE. The number of cells analyzed is indicated beside each condition. (D) Aggregation-competent WT cells were pretreated with LatA for 30 min, stimulated either mechanically on a rotary shaker for 5 s or with 1 µM cAMP, lysed at the indicated time points, and immunoblotted using antibodies that recognize phosphorylated PKBR1 and PKBA. (E and F) Vegetative myo cells expressing RBD-GFP were stimulated with unidirectional laminar flow at 41 dyn/cm2 for 2 s. Images were collected every 3 s. A representative cell is shown in E. (F) RBD-GFP accumulation at the cortex was quantified as the inverse of the mean cytoplasmic intensity normalized for time 0. Values are mean ± SE of 14 cells. (G) Vegetative WT cells expressing LimEΔcoil-RFP were treated with vehicle or 50 µM benomyl for 30 min, fixed, and immunostained with an antibody against α-tubulin. (H) Vegetative WT cells expressing LimEΔcoil-RFP or RBD-GFP were treated with vehicle or 50 µM benomyl for at least 20 min and then stimulated with unidirectional laminar flow at 41 dyn/cm2 for 2 s. Images were collected every 3 s. Peak RBD-GFP and LimEΔcoil-RFP accumulation at the cortex of individual cells was quantified as the inverse of the mean cytoplasmic intensity 6 s after the start of stimulation, normalized for time 0. Horizontal lines and error bars represent mean ± SD. (IK) Aggregation-competent WT cells were pretreated with vehicle or the indicated concentrations of benomyl for 30 min, stimulated on a rotary shaker for 5 s, lysed at the indicated time points, and immunoblotted using antibodies that recognize phosphorylated PKBR1 or ERK2. The membrane was stained with CBB to show equal protein loading. A representative immunoblot for vehicle and 50 µM benomyl is shown in I. (J) Mean intensity of the phosphorylated ERK2 bands for vehicle and 50 µM benomyl at various times poststimulation was normalized for time 0. Values are mean ± SE of four independent experiments. (K) The mean intensity of the phosphorylated ERK2 bands for vehicle and indicated concentrations of benomyl at time 0 was normalized for vehicle. Values are mean ± SE of three independent experiments. *P < 0.05, **P < 0.01 compared with vehicle. Arrowheads point to areas of biosensor accumulation at the cortex. (Scale bar, 10 µm.)
Fig. 7.
Fig. 7.
Activation of the chemotactic signaling network by chemical and mechanical stimuli. Background: Chemoattractants bind to GPCRs, which leads to dissociation and activation of G protein α and βγ subunits. This signal is further amplified by multiple parallel pathways within the signal transduction network, which is required for biased actin polymerization. In response to chemoattractant, most of the molecules within the signal transduction network are transiently activated or recruited to the cortex, although PTEN and CynA dissociate from the cortex. In this report: First, multiple nodes (shown in bold italics) within the chemotactic signal transduction and cytoskeletal networks were tested in response to acute mechanical stimulation. Eight either accumulated at the cortex or displayed activating phosphorylation (green triangles), and two lost cortical localization (blue triangles), all with the same dynamics as for chemoattractants. Second, tests were repeated after numerous components (marked with *) implicated in chemotactic responses, mechanotransduction, and cytoskeletal integrity were perturbed using genetic deletions and/or pharmacological inhibitors. Because perturbations within all three networks inhibited the response to acute mechanical stimulation (shown in red and brown), it appears that all three networks coordinate in a logical AND gate-type manner to produce a global response. The possible point(s) of entry of the mechanical stimuli is discussed in the text.

References

    1. Stroka KM, Konstantopoulos K. Physical biology in cancer. 4. Physical cues guide tumor cell adhesion and migration. Am J Physiol Cell Physiol. 2014;306(2):C98–C109. - PMC - PubMed
    1. Cortese B, Palamà IE, D’Amone S, Gigli G. Influence of electrotaxis on cell behaviour. Integr Biol (Camb) 2014;6(9):817–830. - PubMed
    1. Artemenko Y, Lampert TJ, Devreotes PN. Moving towards a paradigm: Common mechanisms of chemotactic signaling in Dictyostelium and mammalian leukocytes. Cell Mol Life Sci. 2014;71(19):3711–3747. - PMC - PubMed
    1. Dalous J, et al. Reversal of cell polarity and actin-myosin cytoskeleton reorganization under mechanical and chemical stimulation. Biophys J. 2008;94(3):1063–1074. - PMC - PubMed
    1. Sato MJ, et al. Switching direction in electric-signal-induced cell migration by cyclic guanosine monophosphate and phosphatidylinositol signaling. Proc Natl Acad Sci USA. 2009;106(16):6667–6672. - PMC - PubMed

Publication types

LinkOut - more resources