. 2016 May 3;1(3):e00021-16.
doi: 10.1128/mSystems.00021-16. eCollection 2016 May-Jun.

Preservation Methods Differ in Fecal Microbiome Stability, Affecting Suitability for Field Studies

Affiliations

Preservation Methods Differ in Fecal Microbiome Stability, Affecting Suitability for Field Studies

Se Jin Song et al. mSystems. .

Abstract

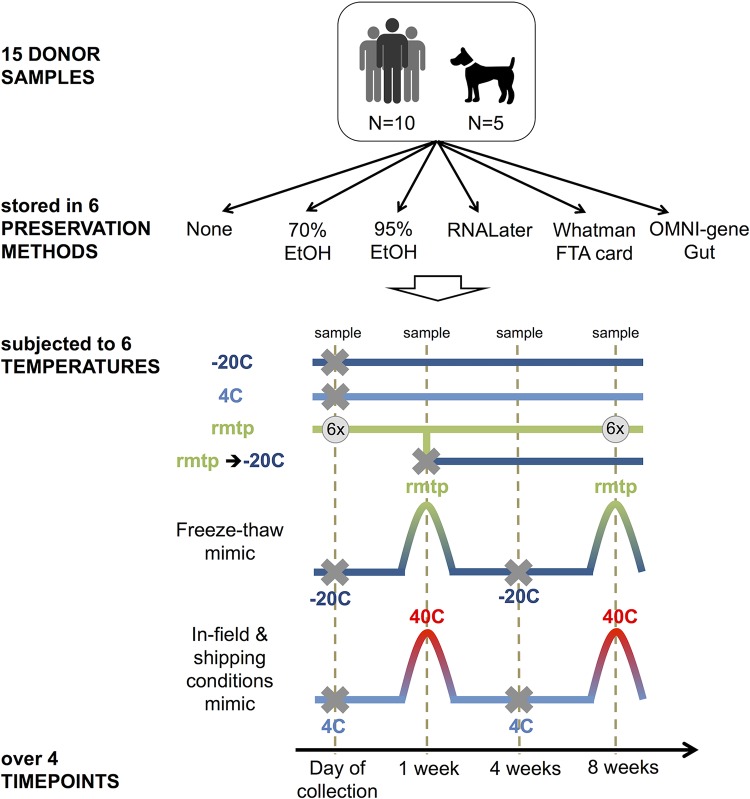
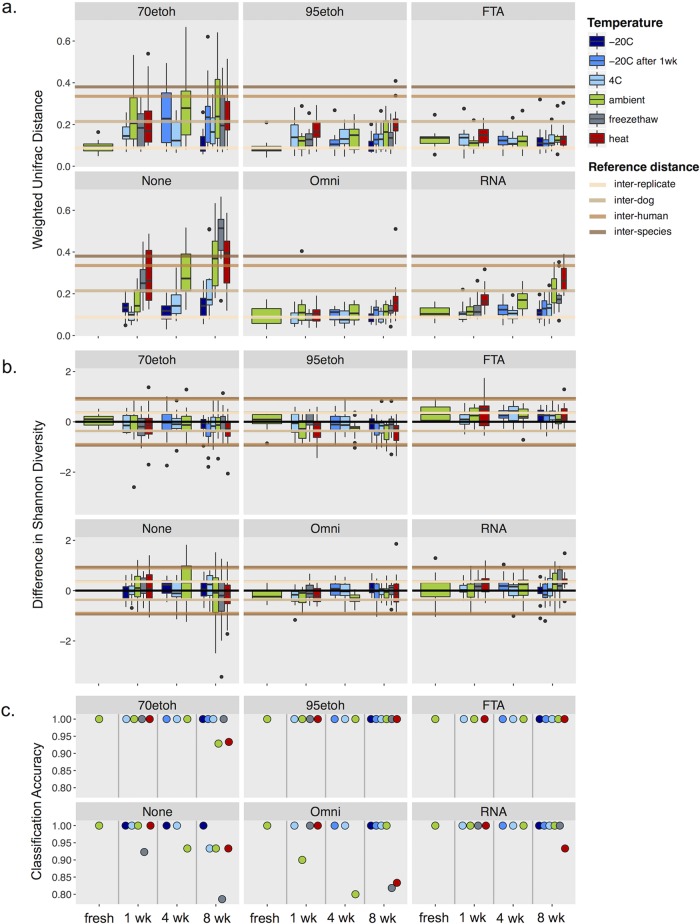
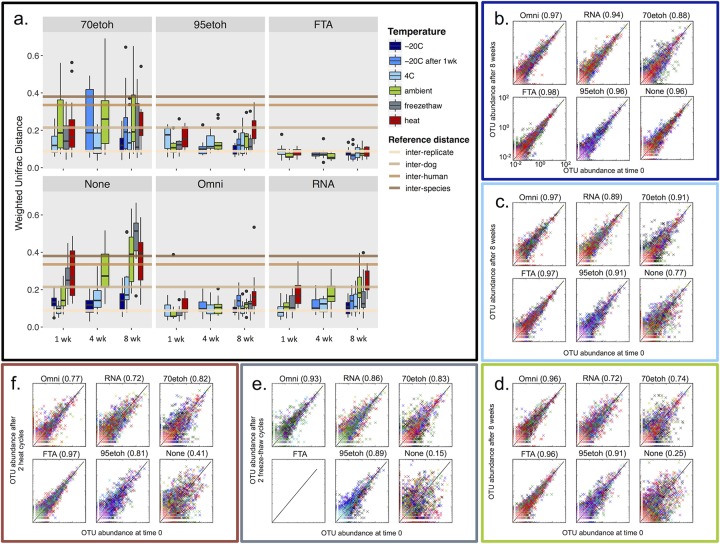
Immediate freezing at -20°C or below has been considered the gold standard for microbiome preservation, yet this approach is not feasible for many field studies, ranging from anthropology to wildlife conservation. Here we tested five methods for preserving human and dog fecal specimens for periods of up to 8 weeks, including such types of variation as freeze-thaw cycles and the high temperature fluctuations often encountered under field conditions. We found that three of the methods-95% ethanol, FTA cards, and the OMNIgene Gut kit-can preserve samples sufficiently well at ambient temperatures such that differences at 8 weeks are comparable to differences among technical replicates. However, even the worst methods, including those with no fixative, were able to reveal microbiome differences between species at 8 weeks and between individuals after a week, allowing meta-analyses of samples collected using various methods when the effect of interest is expected to be larger than interindividual variation (although use of a single method within a study is strongly recommended to reduce batch effects). Encouragingly for FTA cards, the differences caused by this method are systematic and can be detrended. As in other studies, we strongly caution against the use of 70% ethanol. The results, spanning 15 individuals and over 1,200 samples, provide our most comprehensive view to date of storage effects on stool and provide a paradigm for the future studies of other sample types that will be required to provide a global view of microbial diversity and its interaction among humans, animals, and the environment. IMPORTANCE Our study, spanning 15 individuals and over 1,200 samples, provides our most comprehensive view to date of storage and stabilization effects on stool. We tested five methods for preserving human and dog fecal specimens for periods of up to 8 weeks, including the types of variation often encountered under field conditions, such as freeze-thaw cycles and high temperature fluctuations. We show that several cost-effective methods provide excellent microbiome stability out to 8 weeks, opening up a range of field studies with humans and wildlife that would otherwise be cost-prohibitive.

Keywords: DNA stability; fecal microbiome; sample storage.


Figures

FIG 1
FIG 1
Diagram of experimental design. Bulk feces were collected from humans and dogs, homogenized, treated with a range of common preservatives, and subjected to a range of likely temperature scenarios. Conditions not sampled are marked with a gray X. Additional specific combinations of conditions not sampled are described in Materials and Methods and listed in Table S2 in the supplemental material. For freshly collected samples in no preservative, six replicate subsamples were taken from the same primary aliquot. At the 8-week time point, six replicate subsamples were taken from samples with no preservative and samples stored in 95% ethanol. rmtp, room temperature.
FIG 2
FIG 2
PCoA based on unweighted UniFrac (left) and weighted UniFrac (right) colored by individual with day 0 “fresh” samples (including replicates) represented with larger spheres. Bacterial communities of the 10 human participants are shown in pastel colors, and dogs are in brighter or darker colors.
FIG 3
FIG 3
Summary of community changes by treatment over time. (a) Box plots show weighted UniFrac distances between treated samples and fresh samples taken on the day of sampling with no preservative. Horizontal lines show the average distance between replicate samples (lowest line, light tan), between different dogs (next line up, tan), between human individuals (next line up in dark tan), and between dogs and humans (highest line, brown). 70etoh and 95etoh, 70% and 95% ethanol, respectively. (b) Difference in alpha diversity is shown between samples indicated and the fresh sample. Reference absolute distances (interreplicate, interindividual, and interspecies) are shown in both the positive and negative directions. Note that the reference lines for interdog and interreplicate distances overlap significantly, as well as the lines for interhuman and interspecies distances. (c) The value shows the proportion of samples that were correctly assigned to the right individual using a random forest classifier. Colors represent the different temperatures at which samples were stored. “−20C after 1wk” represents samples that were stored at −20°C following 1 week of storage at ambient temperature.
FIG 4
FIG 4
Stability of fecal microbiomes in different preservatives and under different temperature treatments. (a) Box plots show comparisons of weighted UniFrac distances between time points within each preservation type, within each individual, and across temperature treatments. Horizontal lines show the average difference in diversity between replicate samples (lowest line, light tan), between different dogs (next line up, tan), between human individuals (next line up in dark tan), and between dogs and humans (highest line, brown). Colors represent the different temperatures at which samples were stored. “−20C after 1wk” represents samples that were stored at −20°C following 1 week of storage at ambient temperature. 70etoh and 95etoh, 70% and 95% ethanol, respectively. (b to f) Scatterplots show the relative abundance (percentage) of each OTU found in the freshly collected sample placed in a given preservative, plotted against its relative abundance in the same preservative after 8 weeks, for each temperature manipulation, except in panel b, where the “None” plot shows the comparison between samples frozen for 1 week and samples frozen for 8 weeks. Colors correspond to different individuals. Correlation coefficients for each plot are shown in parentheses.
FIG 5
FIG 5
Distribution of the bacterial taxa that exhibit the greatest log fold changes in mean relative abundance. Heat maps show the log2 fold changes of the top 50 taxa that either increase (shown in red hues) or decrease (shown in blue hues) (a) once exposed to a preservation method (for 1 week at −20°C and a few hours in the other preservatives) and (b) over time within a preservation method (from left to right: 1, 4, and 8 weeks, except for −20°C, for which the 4- and 8-week time points are shown). Taxa are grouped by bacterial phyla (A, Actinobacteria; B, Bacteroidetes; C, Cyanobacteria; F, Firmicutes; L, Lentisphaeria; P, Proteobacteria) and colored by bacterial class. (c) A line graph shows the total fraction of OTUs that show a greater than 10-fold change in relative abundance for each stabilization method at each time point compared to the fresh sample. 70etoh and 95etoh, 70% and 95% ethanol, respectively.

References

    1. Ley RE, Hamady M, Lozupone C, Turnbaugh PJ, Ramey RR, Bircher JS, Schlegel ML, Tucker TA, Schrenzel MD, Knight R, Gordon JI. 2008. Evolution of mammals and their gut microbes. Science 320:1647–1651. doi: 10.1126/science.1155725. - DOI - PMC - PubMed
    1. Muegge BD, Kuczynski J, Knights D, Clemente JC, González A, Fontana L, Henrissat B, Knight R, Gordon JI. 2011. Diet drives convergence in gut microbiome functions across mammalian phylogeny and within humans. Science 332:970–974. doi: 10.1126/science.1198719. - DOI - PMC - PubMed
    1. Delsuc F, Metcalf JL, Wegener Parfrey L, Song SJ, González A, Knight R. 2014. Convergence of gut microbiomes in myrmecophagous mammals. Mol Ecol 23:1301–1317. doi: 10.1111/mec.12501. - DOI - PubMed
    1. Human Microbiome Project Consortium. 2012. Structure, function and diversity of the healthy human microbiome. Nature 486:207–214. doi: 10.1038/nature11234. - DOI - PMC - PubMed
    1. Clemente JC, Pehrsson EC, Blaser MJ, Sandhu K, Gao Z, Wang B, Magris M, Hidalgo G, Contreras M, Noya-Alarcon O, Lander O, McDonald J, Cox M, Walter J, Oh PL, Ruiz JF, Rodriguez S, Shen N, Song SJ, Metcalf J, Knight R, Dantas G, Dominguez-Bello MG. 2015. The microbiome of uncontacted Amerindians. Sci Adv 1:e1500183. doi: 10.1126/sciadv.1500183. - DOI - PMC - PubMed