. 2016 Jun 28;1(3):e00018-16.
doi: 10.1128/mSystems.00018-16. eCollection 2016 May-Jun.

Urban Transit System Microbial Communities Differ by Surface Type and Interaction with Humans and the Environment

Affiliations

Urban Transit System Microbial Communities Differ by Surface Type and Interaction with Humans and the Environment

Tiffany Hsu et al. mSystems. .

Abstract

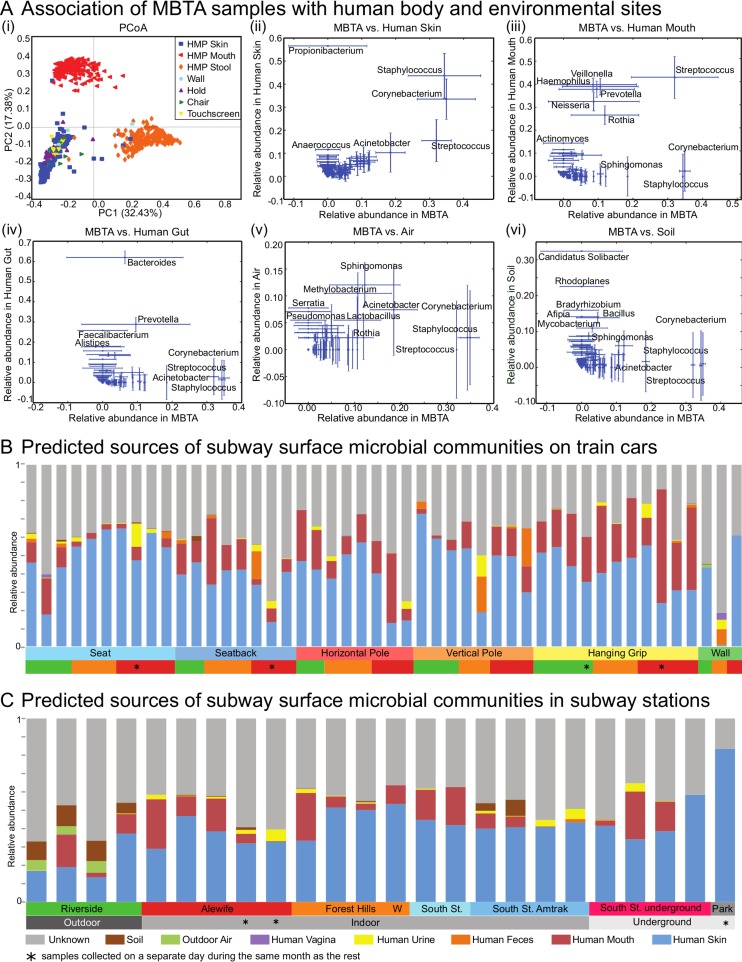
Public transit systems are ideal for studying the urban microbiome and interindividual community transfer. In this study, we used 16S amplicon and shotgun metagenomic sequencing to profile microbial communities on multiple transit surfaces across train lines and stations in the Boston metropolitan transit system. The greatest determinant of microbial community structure was the transit surface type. In contrast, little variation was observed between geographically distinct train lines and stations serving different demographics. All surfaces were dominated by human skin and oral commensals such as Propionibacterium, Corynebacterium, Staphylococcus, and Streptococcus. The detected taxa not associated with humans included generalists from alphaproteobacteria, which were especially abundant on outdoor touchscreens. Shotgun metagenomics further identified viral and eukaryotic microbes, including Propionibacterium phage and Malassezia globosa. Functional profiling showed that Propionibacterium acnes pathways such as propionate production and porphyrin synthesis were enriched on train holding surfaces (holds), while electron transport chain components for aerobic respiration were enriched on touchscreens and seats. Lastly, the transit environment was not found to be a reservoir of antimicrobial resistance and virulence genes. Our results suggest that microbial communities on transit surfaces are maintained from a metapopulation of human skin commensals and environmental generalists, with enrichments corresponding to local interactions with the human body and environmental exposures. IMPORTANCE Mass transit environments, specifically, urban subways, are distinct microbial environments with high occupant densities, diversities, and turnovers, and they are thus especially relevant to public health. Despite this, only three culture-independent subway studies have been performed, all since 2013 and all with widely differing designs and conclusions. In this study, we profiled the Boston subway system, which provides 238 million trips per year overseen by the Massachusetts Bay Transportation Authority (MBTA). This yielded the first high-precision microbial survey of a variety of surfaces, ridership environments, and microbiological functions (including tests for potential pathogenicity) in a mass transit environment. Characterizing microbial profiles for multiple transit systems will become increasingly important for biosurveillance of antibiotic resistance genes or pathogens, which can be early indicators for outbreak or sanitation events. Understanding how human contact, materials, and the environment affect microbial profiles may eventually allow us to rationally design public spaces to sustain our health in the presence of microbial reservoirs. Author Video: An author video summary of this article is available.

Keywords: built environment; microbiome; subway; transit.


Figures

FIG 1
FIG 1
Collection of samples from MBTA trains and stations. (A) Microbial community samples were collected from the Massachusetts Bay transit system in the metropolitan area of Boston, MA. Train samples were collected from 6 train car surfaces across 3 locations along 3 train routes; station samples were collected from 5 stations. Horiz, horizontal; Vertic, vertical. (B and C) Diagram of the surfaces sampled within train cars (B) and stations (C). Sampled surfaces specifically included seats and seat backs, horizontal and vertical poles, hanging grips, and walls within train cars, as well as the screens and walls of touchscreen machines within stations.
FIG 2
FIG 2
Taxonomic composition of subway microbial communities. All ordinations are from principal coordinate analyses using Bray-Curtis distances among filtered OTUs (see Materials and Methods), colored by metadata. (A) Subway data by surface. PC1, principal coordinate 1; PC2, principal coordinate 2. (B) Train car data by train line. (C) Touchscreen data by location of machine. (D) Relative abundances of bacterial families across samples from train cars (see Table S2 in the supplemental material for complete data). (E) Relative abundances of bacterial families within stations (complete data determined as described above). Stars indicate that the sample was collected on a separate day during the same month as the remaining samples. For station samples, “W” indicates a sample from a ticketing machine wall; all other samples were from the ticketing machine touchscreens.
FIG 3
FIG 3
Putative MBTA microbial community sources. (Ai) Ordination of subway surface data jointly with human skin (anterior nares), oral (mixed sites from within oral cavity), and gut (stool) microbiome data from the Human Microbiome Project (HMP) (12). Principal coordinate analysis was performed with weighted UniFrac distance and calculated using OTU relative abundances. (Aii to vi) Correlations between subway samples and human body sites (19), including skin (ii), oral (iii), and gut (iv) samples, as well as environmental sites, i.e., air (20) (v) and soil (21) (vi) samples. The x and y axes represent mean relative abundance levels across each data set with standard error bars. For each plot, subway samples (MBTA) are represented on the x axis and potential source community samples are represented on the y axis. (B and C) Microbial SourceTracker (22) was used to identify possible human and environmental sources of subway (B) train and (C) station communities. The relative estimated contribution of each source is plotted per subway sample.
FIG 4
FIG 4
Transdomain taxonomic profiles from subway shotgun metagenomes. Data represent the relative abundances of the 20 microbial species with the highest mean across 24 metagenomes from train cars and stations. Among colored metadata annotations, train line data (green, orange, or red) are indicated for car surface samples and location data (indoor or outdoor) for touchscreens. P. acnes is not amplified by the 16S primers used in this study but is readily detectable by shotgun sequencing, as are nonbacteria such as Propionibacterium phage.
FIG 5
FIG 5
Enrichment of microbial taxa with respect to metadata using multivariate analyses. Each ring represents significant associations of one metadatum with microbial clades as determined using MaAsLin (27) (FDR q < 0.25). (A) 16S data. For location, surface category, surface type, and surface material (inner rings to outer rings), the direction of association between taxa and metadata relative to Alewife, touchscreens, seat backs, and polyester, respectively, is indicated in red (positive) or green (negative). (B) Shotgun metagenomic data. Only a simplified surface type was represented by a number of samples sufficient for analysis. Horizontal poles, vertical poles, and grips were grouped into holding surfaces (“holds”), and seats and seat backs were grouped into “chairs.” The direction of association is again indicated by color. Only taxa with at least one association are shown in each cladogram.
FIG 6
FIG 6
Enrichment of members of KEGG Orthology (KOs) families across MBTA surfaces before and after P. acnes removal. For all heat maps, rows represent significantly enriched KOs detected through linear regression performed with MaAsLin, columns represent samples, and cells are colored according to the number of sum-normalized reads per kilobase (RPKs) on a log scale. Further metadata are shown as colored bars below the heat maps. The first colored bar explains the collapsed surface types (second bar). The “chairs” category includes seats (light blue) and seat backs (dark blue); the “holds” category includes horizontal poles (red), vertical poles (orange), and grips (yellow); and the “touchscreens” category includes data from Riverside (green), Alewife (red), Forest Hills (orange), and South Station (light blue). KOs annotated with yellow circles correspond to those found before and after P. acnes removal. (A) Selected KOs enriched on holds only are specific to and colored according to P. acnes metabolic function. (B) Selected KOs specific to oxidative phosphorylation and photosynthesis are shown before (above) and after (below) P. acnes removal. Directions of association between KO abundances and surface types, relative to holds, are shown as a green plus sign (“+”) (positive) or a red minus sign (“−”) (negative) to the left of the heat map. Columns are colored by metadata as described for Fig. 2.
FIG 7
FIG 7
Quantification of antibiotic resistance marker and virulence factor abundances on subway surfaces. (A) Antimicrobial resistance markers (rows) quantified in metagenomes by ShortBRED (36) and annotated by antibiotic target through the use of antibiotic resistance ontology in CARD. (B) Virulence factors (rows) likewise quantified and manually annotated by virulence function through the use of keywords on the VFDB website. For both heat maps, columns (samples) are arranged as described for Fig. 6.

Comment in

References

    1. National Transit Database 2015. Monthly module raw data release. http://www.ntdprogram.gov/ntdprogram/data.htm.
    1. Lax S, Smith DP, Hampton-Marcell J, Owens SM, Handley KM, Scott NM, Gibbons SM, Larsen P, Shogan BD, Weiss S, Metcalf JL, Ursell LK, Vázquez-Baeza Y, Van Treuren W, Hasan NA, Gibson MK, Colwell R, Dantas G, Knight R, Gilbert JA. 2014. Longitudinal analysis of microbial interaction between humans and the indoor environment. Science 345:1048–1052. doi: 10.1126/science.1254529. - DOI - PMC - PubMed
    1. Meadow JF, Altrichter AE, Green JL. 2014. Mobile phones carry the personal microbiome of their owners. PeerJ 2:e447. doi: 10.7717/peerj.447. - DOI - PMC - PubMed
    1. Fierer N, Lauber CL, Zhou N, McDonald D, Costello EK, Knight R. 2010. Forensic identification using skin bacterial communities. Proc Natl Acad Sci U S A 107:6477–6481. doi: 10.1073/pnas.1000162107. - DOI - PMC - PubMed
    1. Flores GE, Bates ST, Knights D, Lauber CL, Stombaugh J, Knight R, Fierer N. 2011. Microbial biogeography of public restroom surfaces. PLoS One 6:e28132. doi: 10.1371/journal.pone.0028132. - DOI - PMC - PubMed