. 2016 Nov 8:7:13428.
doi: 10.1038/ncomms13428.

Recent pause in the growth rate of atmospheric CO2 due to enhanced terrestrial carbon uptake

Affiliations

Recent pause in the growth rate of atmospheric CO2 due to enhanced terrestrial carbon uptake

Trevor F Keenan et al. Nat Commun. .

Erratum in

Abstract

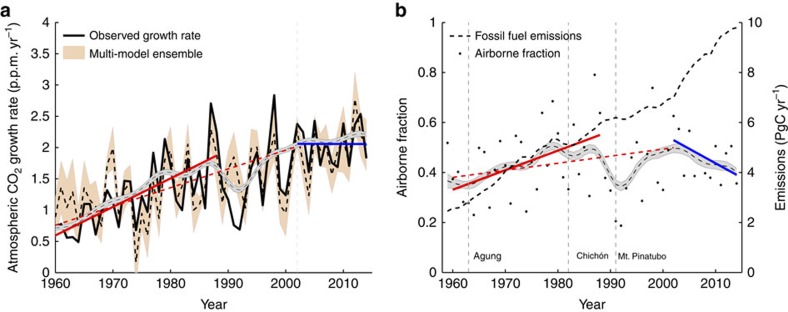
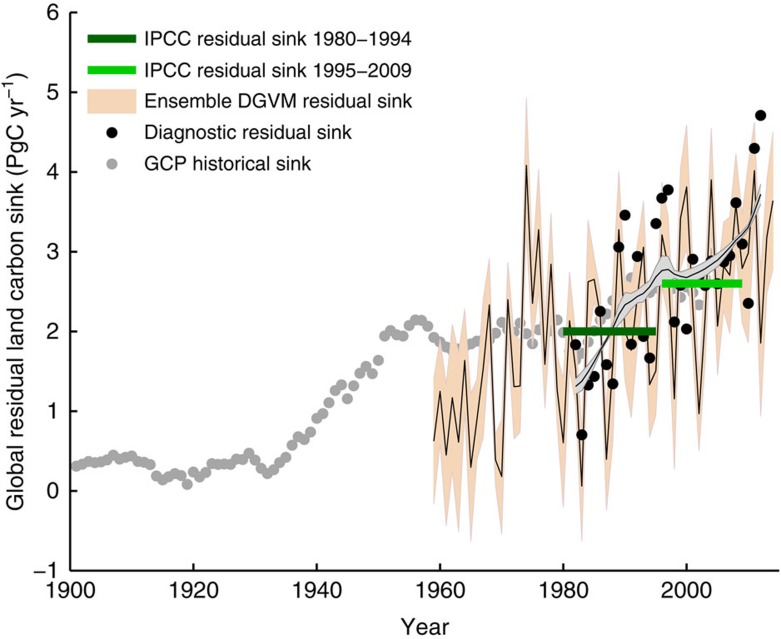
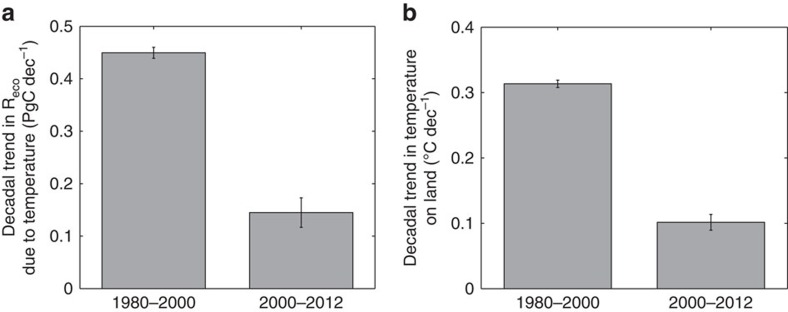
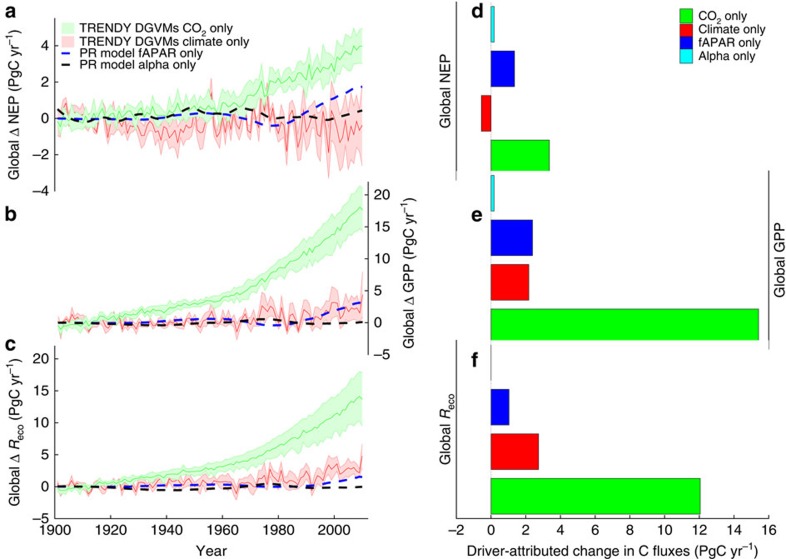
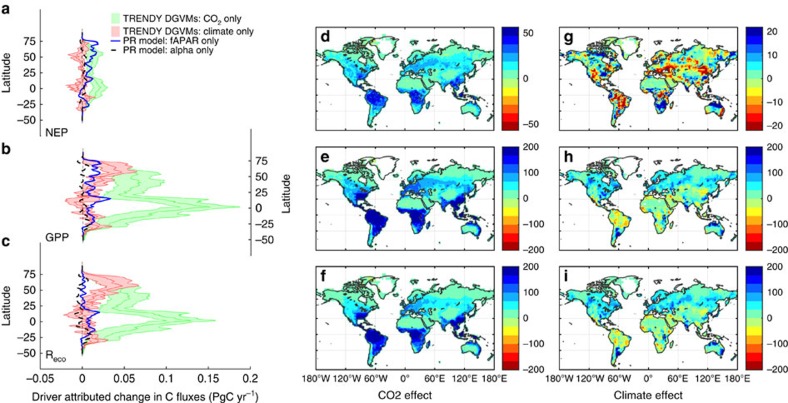
Terrestrial ecosystems play a significant role in the global carbon cycle and offset a large fraction of anthropogenic CO2 emissions. The terrestrial carbon sink is increasing, yet the mechanisms responsible for its enhancement, and implications for the growth rate of atmospheric CO2, remain unclear. Here using global carbon budget estimates, ground, atmospheric and satellite observations, and multiple global vegetation models, we report a recent pause in the growth rate of atmospheric CO2, and a decline in the fraction of anthropogenic emissions that remain in the atmosphere, despite increasing anthropogenic emissions. We attribute the observed decline to increases in the terrestrial sink during the past decade, associated with the effects of rising atmospheric CO2 on vegetation and the slowdown in the rate of warming on global respiration. The pause in the atmospheric CO2 growth rate provides further evidence of the roles of CO2 fertilization and warming-induced respiration, and highlights the need to protect both existing carbon stocks and regions, where the sink is growing rapidly.


Conflict of interest statement

The authors declare no competing financial interests.

Figures

Figure 1
Figure 1. Changes in the airborne fraction and the CO2 growth rate.
(a) Observed (solid black line) and modelled (DGVM ensemble—mean (dashed black line) and s.d. (orange area)) changes in the atmospheric CO2 growth rate from 1960 to 2012. The vertical grey line (2002) indicates the point of structural change identified using a linear modelling analysis. The red lines indicate a significant increasing trend from 1959 to 1990 (solid red) and 1959 to 2002 (dashed red) (P<0.1), with no trend evident between 2002 and 2014 (blue). All trends are estimated using the non-parametric Mann–Kendall Tau trend test with Sen’s method. The grey area represents the underlying 5-year dynamic (mean±1 s.d.), estimated using SSA. (b) Fossil fuel emissions (black dashed line) and the fraction of CO2 emissions, which remain in the atmosphere each year (black dots, airborne fraction). Lines indicate significant long-term trends over the periods 1959–1988 (red, increasing) and 2002–2014 (blue, decreasing) at P<0.1. The red dashed line shows a slight increasing trend between 1959 and 2002 (P=0.18). The grey area represents the underlying 5-year dynamic (mean±1 s.d.), estimated using singular spectrum analysis.
Figure 2
Figure 2. Long-term changes in terrestrial carbon cycling.
Estimates of the global terrestrial residual carbon sink from 1901 to 2014. Light grey dots are the historical net residual land CO2 sink, estimated by the Global Carbon Project (GCP). Orange shaded areas represent the Global Carbon Project dynamic global vegetation ensemble (annual mean, solid black line, and s.d., orange area) from 10 dynamic global vegetation models (DGVMs). Black dots represent annual values from the satellite-driven diagnostic land surface model, and the grey area represents the associated long-term temporal dynamics (mean±1 s.d.) estimated using singular spectrum analysis. Horizontal bars represent the mean residual land sink values reported by the Intergovernmental Panel on Climate Change (IPCC) 2013, for the periods 1980–1995 (dark green) and 1995–2009 (light green).
Figure 3
Figure 3. Changes in warming over the land surface and the effect on global ecosystem respiration.
Trends in (a) ecosystem respiration (Reco) derived from satellite-driven estimates of the carbon cycle (photosynthesis-respiration (PR) model, see methods), and (b) global warming over vegetated land for the periods of 1980–2000 and 2000–2012. Trends for both periods were estimated using the Sen slope from Kendall's Tau-b method on de-seasonalized monthly data. Error bars represent 95% confidence intervals of the trend.
Figure 4
Figure 4. Contribution of different forcings to the long-term change in terrestrial carbon cycling.
Model estimates of the extent to which long-term changes in different forcing factors are responsible for the long-term change in net ecosystem production (NEP) (a,d), gross primary production (GPP) (b,e) and ecosystem respiration (Reco; c,f), where NEP=GPP−Reco. Shaded areas in ac represent the mean and s.d. from the TRENDY ensemble of dynamic global vegetation model (DGVM) simulations with varying CO2 (green) or climate (red) only. Dashed lines in ac show the effect of changes in vegetation (or the fraction of absorbed radiation (fAPAR), blue), and water availability (Alpha, black) estimated using a satellite-driven coupled photosynthesis-respiration (PR) model. (df) The mean change associated with each driver between the periods 1901–1915 and 1995–2010.
Figure 5
Figure 5. Global distribution of change.
(ac) The latitudinal distribution of the effect of changes in different forcing factors on (a) net ecosystem production (NEP), (b) gross primary production (GPP) and (c) ecosystem respiration (Reco). Shaded areas represent the mean and s.d. from the TRENDY ensemble of dynamic global vegetation models (DGVM) simulations with varying only CO2 (green) or climate (red). Dashed lines in ac show the effect of changes in vegetation (or the fraction of absorbed radiation (fAPAR), blue) and water availability (Alpha, black) estimated using a diagnostic coupled photosynthesis-respiration (PR) model. (di) The spatial distribution of the influence of increasing atmospheric CO2 and changes in global climate on total rates of NEP (d,g), GPP (e,h) and total ecosystem respiration (f,i) in gC m−2 per year. Effects are estimated based on the difference between the 15-year periods of 1901–1915 and 1995–2010.

References

    1. Quéré C. L. E. et al.. Global Carbon Budget 2015. Earth Syst. Sci. Data 7, 349–396 (2015).
    1. Raupach M. R., Canadell J. G. & Le Quéré C. Anthropogenic and biophysical contributions to increasing atmospheric CO2 growth rate and airborne fraction. Biogeosciences 5, 1601–1613 (2008).
    1. Bousquet P. et al.. Regional changes in carbon dioxide fluxes of land and oceans since 1980. Science 290, 1342–1347 (2000). - PubMed
    1. Cox P. M. et al.. Sensitivity of tropical carbon to climate change constrained by carbon dioxide variability. Nature 494, 341–344 (2013). - PubMed
    1. Ballantyne A. P., Alden C. B., Miller J. B., Tans P. P. & White J. W. C. Increase in observed net carbon dioxide uptake by land and oceans during the past 50 years. Nature 488, 70–72 (2012). - PubMed

Publication types