

Exploring Spatial and Temporal Distribution of Cutaneous Leishmaniasis in the Americas, 2001-2011
- PMID: 27824881
- PMCID: PMC5100938
- DOI: 10.1371/journal.pntd.0005086
Exploring Spatial and Temporal Distribution of Cutaneous Leishmaniasis in the Americas, 2001-2011
Abstract
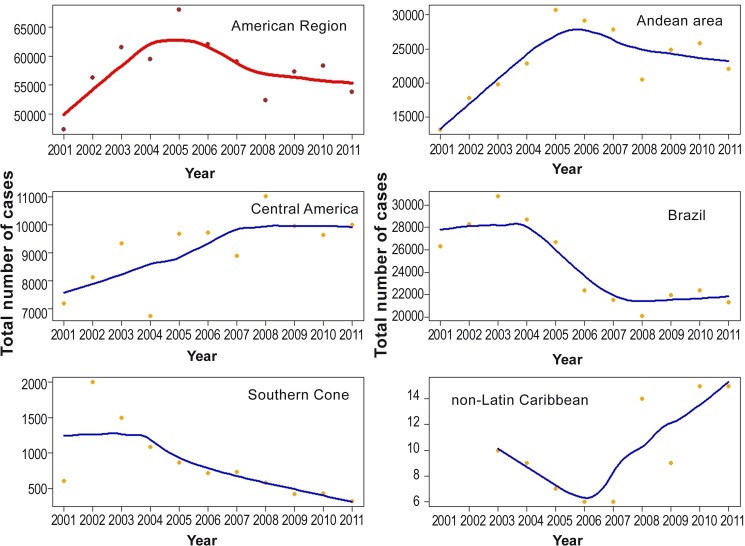
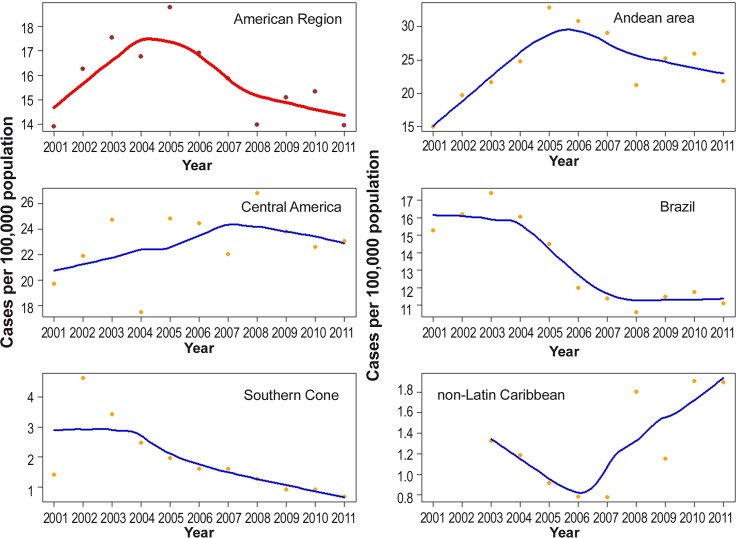
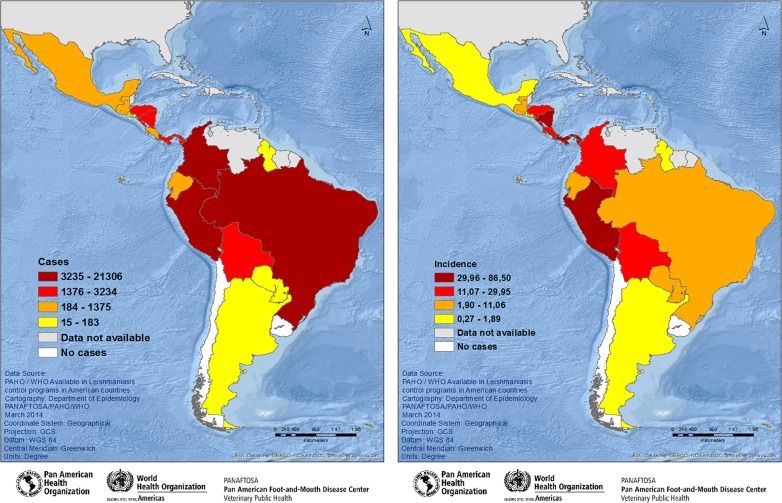
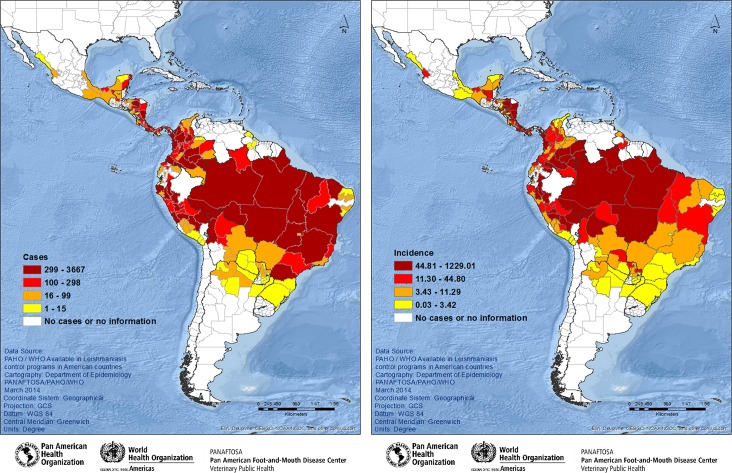
Methods: Cases reported in the period of 2001-2011 from 14/18 CL endemic countries were included in this study by using two spreadsheet to collect the data. Two indicators were analyzed: CL cases and incidence rate. The local regression method was used to analyze case trends and incidence rates for all the studied period, and for 2011 the spatial distribution of each indicator was analyzed by quartile and stratified into four groups.
Results: From 2001-2011, 636,683 CL cases were reported by 14 countries and with an increase of 30% of the reported cases. The average incidence rate in the Americas was 15.89/100,000 inhabitants. In 2011, 15 countries reported cases in 180 from a total of 292 units of first subnational level. The global incidence rate for all countries was 17.42 cases per 100,000 inhabitants; while in 180 administrative units at the first subnational level, the average incidence rate was 57.52/100,000 inhabitants. Nicaragua and Panama had the highest incidence but more cases occurred in Brazil and Colombia. Spatial distribution was heterogeneous for each indicator, and when analyzed in different administrative level. The results showed different distribution patterns, illustrating the limitation of the use of individual indicators and the need to classify higher-risk areas in order to prioritize the actions. This study shows the epidemiological patterns using secondary data and the importance of using multiple indicators to define and characterize smaller territorial units for surveillance and control of leishmaniasis.
Conflict of interest statement
The authors have declared that no competing interests exist.
Figures
Similar articles
-
Identification of priority areas for surveillance of cutaneous leishmaniasis using spatial analysis approaches in Southeastern Brazil.BMC Infect Dis. 2019 Apr 11;19(1):318. doi: 10.1186/s12879-019-3940-4. BMC Infect Dis. 2019. PMID: 30975100 Free PMC article.
-
American cutaneous leishmaniasis in Southeast Brazil: space-time clustering.Int J Epidemiol. 1999 Oct;28(5):982-9. doi: 10.1093/ije/28.5.982. Int J Epidemiol. 1999. PMID: 10598000
-
Spatial-temporal pattern of cutaneous leishmaniasis in Brazil.Infect Dis Poverty. 2021 Jun 16;10(1):86. doi: 10.1186/s40249-021-00872-x. Infect Dis Poverty. 2021. PMID: 34134749 Free PMC article.
-
Global situation of dengue and dengue haemorrhagic fever, and its emergence in the Americas.World Health Stat Q. 1997;50(3-4):161-9. World Health Stat Q. 1997. PMID: 9477544 Review.
-
Cutaneous leishmaniasis in Israel in the era of changing environment.Public Health Rev. 2001;29(1):37-47. Public Health Rev. 2001. PMID: 11780715 Review.
Cited by
-
A follow-up study (2007-2018) on American Tegumentary Leishmaniasis in the municipality of Caratinga, Minas Gerais State, Brazil: Spatial analyses and sand fly collection.PLoS Negl Trop Dis. 2021 May 18;15(5):e0009429. doi: 10.1371/journal.pntd.0009429. eCollection 2021 May. PLoS Negl Trop Dis. 2021. PMID: 34003866 Free PMC article.
-
Identification of priority areas for surveillance of cutaneous leishmaniasis using spatial analysis approaches in Southeastern Brazil.BMC Infect Dis. 2019 Apr 11;19(1):318. doi: 10.1186/s12879-019-3940-4. BMC Infect Dis. 2019. PMID: 30975100 Free PMC article.
-
Epidemiology of cutaneous and mucocutaneous leishmaniasis in Nicaragua.Parasite Epidemiol Control. 2020 Nov 26;11:e00192. doi: 10.1016/j.parepi.2020.e00192. eCollection 2020 Nov. Parasite Epidemiol Control. 2020. PMID: 33313430 Free PMC article.
-
SisLeish: A multi-country standardized information system to monitor the status of Leishmaniasis in the Americas.PLoS Negl Trop Dis. 2017 Sep 5;11(9):e0005868. doi: 10.1371/journal.pntd.0005868. eCollection 2017 Sep. PLoS Negl Trop Dis. 2017. PMID: 28873400 Free PMC article.
-
Space-time patterns and associated factors of leishmaniasis in Colombia, 2008-2016.Rev Salud Publica (Bogota). 2023 Jul 1;25(4):97936. doi: 10.15446/rsap.V25n4.97936. eCollection 2023 Aug. Rev Salud Publica (Bogota). 2023. PMID: 40098647 Free PMC article.
References
-
- Lainson R, Shaw JJ. Epidemiology and ecology of leishmaniasis in Latin America. Nature. 1978; 273: 595–600. - PubMed
-
- Desjeux P. Leishmaniasis: current situation and new perspectives. Comp Immunol Microb. 2004; 27: 305–318. - PubMed
-
- World Health Organization. Control of the leishmaniases. Report of a meeting of the WHO Expert Committee on the Control of Leishmaniases, Geneva, 22–26 March 2010. Geneva: World Health Organization; 2010. (WHO technical report series no. 949). Available from: http://apps.who.int/iris/bitstream/10665/44412/1/WHO_TRS_949_eng.pdf. Accessed 22 May 2014.
MeSH terms
LinkOut - more resources
Full Text Sources
Other Literature Sources
