

SIRT6 Depletion Suppresses Tumor Growth by Promoting Cellular Senescence Induced by DNA Damage in HCC
- PMID: 27824900
- PMCID: PMC5100879
- DOI: 10.1371/journal.pone.0165835
SIRT6 Depletion Suppresses Tumor Growth by Promoting Cellular Senescence Induced by DNA Damage in HCC
Abstract
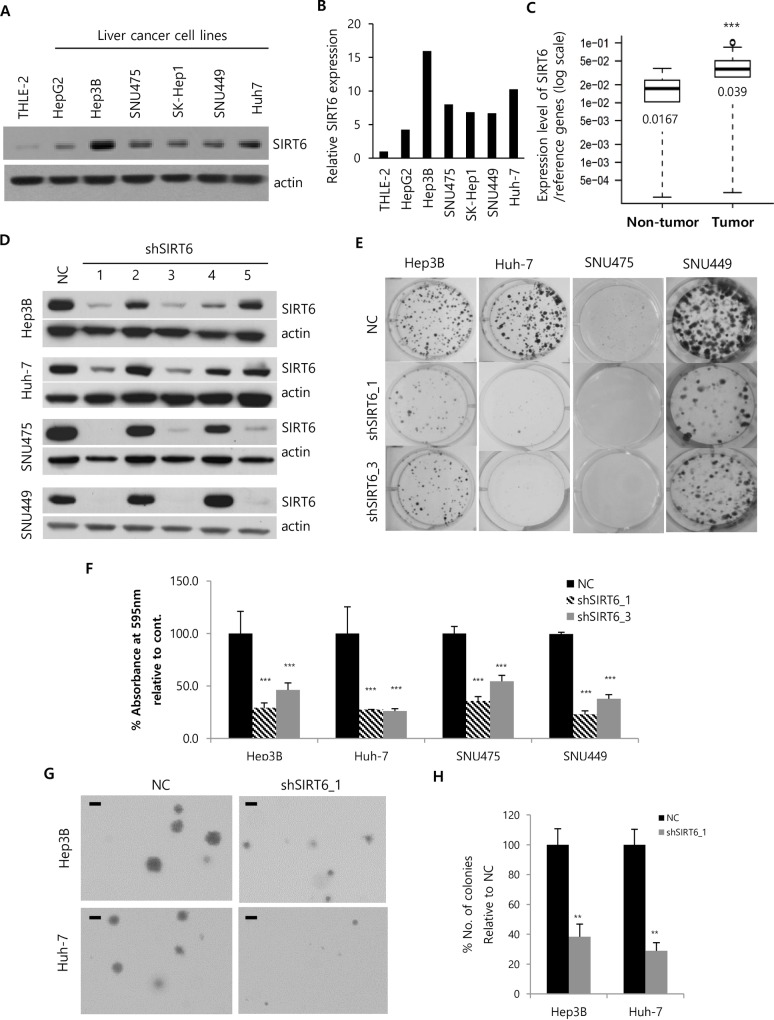
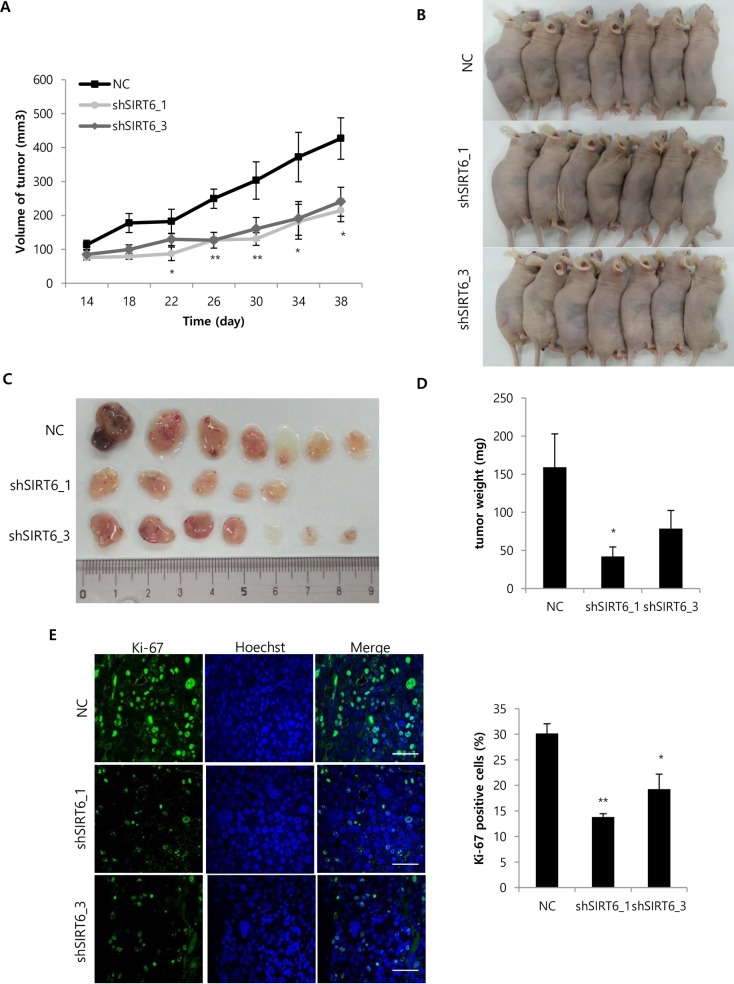
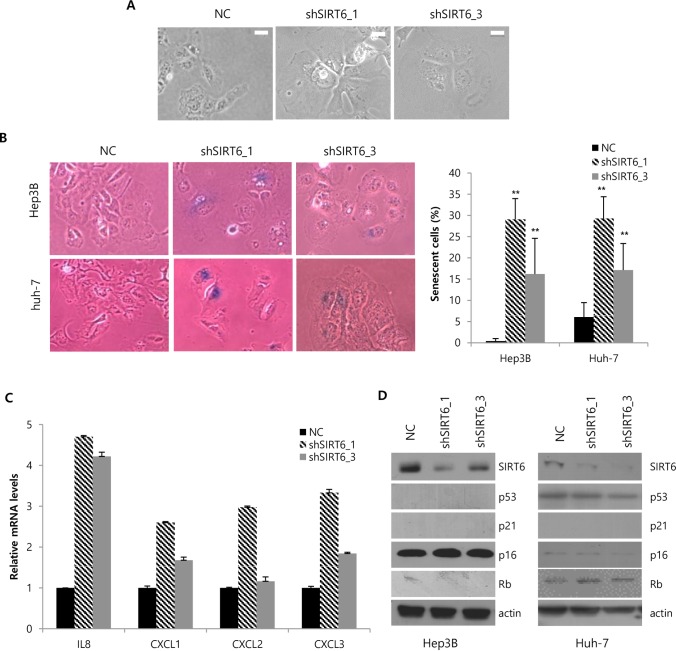
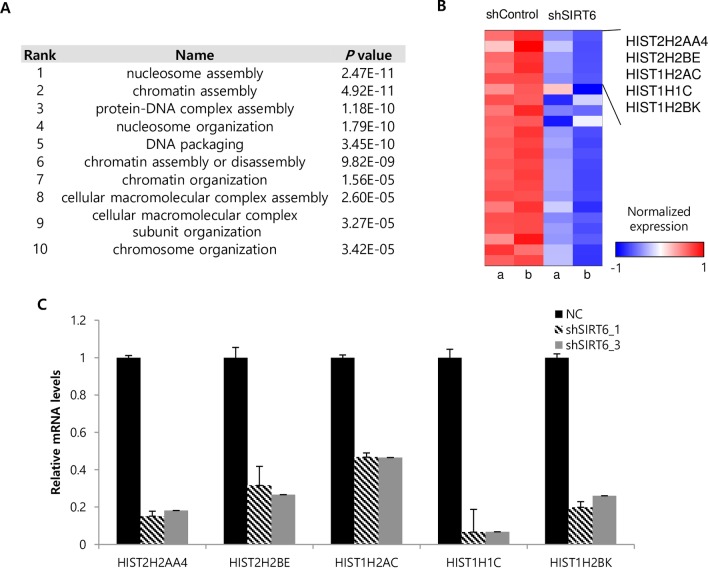
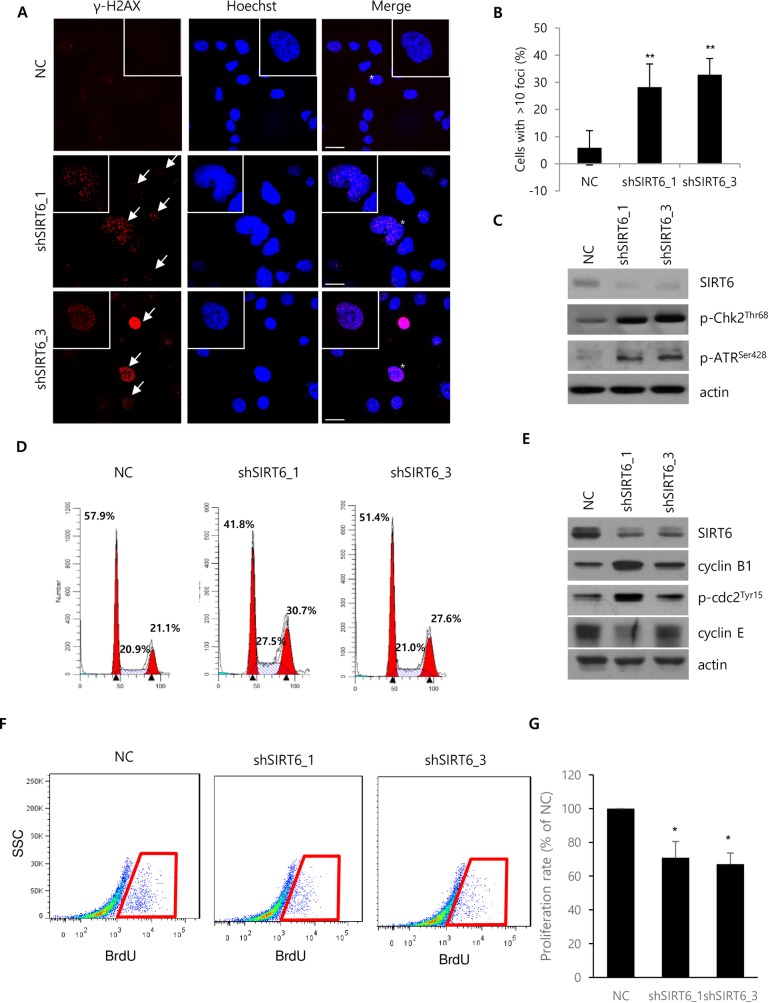
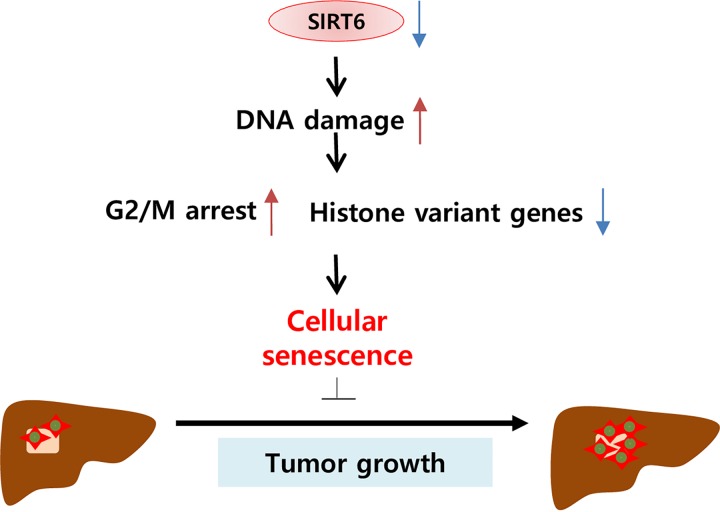
The role of Sirtuin 6 (SIRT6) as a tumor suppressor or oncogene in liver cancer remains controversial. Thus, we identified the specific role of SIRT6 in the progression of hepatocellular carcinoma (HCC). SIRT6 expression was significantly higher in HCC cell lines and HCC tissues from 138 patients than in an immortalized hepatocyte cell line, THLE-2 and non-tumor tissues, respectively. SIRT6 knockdown by shRNA suppressed the growth of HCC cells and inhibited HCC tumor growth in vivo. In addition, SIRT6 silencing significantly prevented the growth of HCC cell lines by inducing cellular senescence in the p16/Rb- and p53/p21-pathway independent manners. Microarray analysis revealed that the expression of genes involved in nucleosome assembly was apparently altered in SIRT6-depleted Hep3B cells. SIRT6 knockdown promoted G2/M phase arrest and downregulation of genes encoding histone variants associated with nucleosome assembly, which could be attributed to DNA damage. Taken together, our findings suggest that SIRT6 acts as a tumor promoter by preventing DNA damage and cellular senescence, indicating that SIRT6 represents a potential therapeutic target for the treatment of HCC.
Conflict of interest statement
This is an original paper, and none of the material has been published or submitted for publication in any other primary scientific journal. All authors are aware of the submission to PLoS One for publication, and have agreed on the final content. The authors declare no conflict of interest. JHK is employees of CbsBioscience, whose company provided support in the form of salary for her. There are no patents, products in development or marketed products to declare. This does not alter our adherence to all the PLOS ONE policies on sharing data and materials.
Figures
Similar articles
-
Sirtuin 6 promotes transforming growth factor-β1/H2O2/HOCl-mediated enhancement of hepatocellular carcinoma cell tumorigenicity by suppressing cellular senescence.Cancer Sci. 2015 May;106(5):559-66. doi: 10.1111/cas.12632. Epub 2015 Mar 9. Cancer Sci. 2015. PMID: 25683165 Free PMC article.
-
SIRT6 Overexpression Potentiates Apoptosis Evasion in Hepatocellular Carcinoma via BCL2-Associated X Protein-Dependent Apoptotic Pathway.Clin Cancer Res. 2016 Jul 1;22(13):3372-82. doi: 10.1158/1078-0432.CCR-15-1638. Epub 2016 Feb 9. Clin Cancer Res. 2016. PMID: 26861461
-
Transforming growth factor-beta induces senescence in hepatocellular carcinoma cells and inhibits tumor growth.Hepatology. 2010 Sep;52(3):966-74. doi: 10.1002/hep.23769. Hepatology. 2010. PMID: 20583212
-
[Function of SIRT6 in tumor initiation and progression].Sheng Wu Gong Cheng Xue Bao. 2016 Jul 25;32(7):870-879. doi: 10.13345/j.cjb.150403. Sheng Wu Gong Cheng Xue Bao. 2016. PMID: 29019209 Review. Chinese.
-
Molecular Mechanisms to Target Cellular Senescence in Hepatocellular Carcinoma.Cells. 2020 Nov 25;9(12):2540. doi: 10.3390/cells9122540. Cells. 2020. PMID: 33255630 Free PMC article. Review.
Cited by
-
SIRT6, a Mammalian Deacylase with Multitasking Abilities.Physiol Rev. 2020 Jan 1;100(1):145-169. doi: 10.1152/physrev.00030.2018. Epub 2019 Aug 22. Physiol Rev. 2020. PMID: 31437090 Free PMC article. Review.
-
Sirtuin 6 contributes to migration and invasion of osteosarcoma cells via the ERK1/2/MMP9 pathway.FEBS Open Bio. 2017 Jul 31;7(9):1291-1301. doi: 10.1002/2211-5463.12265. eCollection 2017 Sep. FEBS Open Bio. 2017. Retraction in: FEBS Open Bio. 2022 Dec;12(12):2261. doi: 10.1002/2211-5463.13513. PMID: 28904859 Free PMC article. Retracted.
-
Sirtuin 6 Is a Critical Epigenetic Regulator of Cancer.Subcell Biochem. 2022;100:337-360. doi: 10.1007/978-3-031-07634-3_10. Subcell Biochem. 2022. PMID: 36301499 Review.
-
The protective effects of Agomelatine against Aβ1-42 oligomers-induced cellular senescence mediated by SIRT6 and Agomelatine's potential in AD treatment.Hum Cell. 2021 Nov;34(6):1734-1743. doi: 10.1007/s13577-021-00611-2. Epub 2021 Sep 17. Hum Cell. 2021. PMID: 34535875
-
SIRT6 Widely Regulates Aging, Immunity, and Cancer.Front Oncol. 2022 Apr 6;12:861334. doi: 10.3389/fonc.2022.861334. eCollection 2022. Front Oncol. 2022. PMID: 35463332 Free PMC article. Review.
References
MeSH terms
Substances
LinkOut - more resources
Full Text Sources
Other Literature Sources
Medical
Molecular Biology Databases
Research Materials
Miscellaneous
