. 2017 Jan;31(1):294-307.
doi: 10.1096/fj.201600293R. Epub 2016 Oct 17.

High glucose repatterns human podocyte energy metabolism during differentiation and diabetic nephropathy

Affiliations

High glucose repatterns human podocyte energy metabolism during differentiation and diabetic nephropathy

Toshiyuki Imasawa et al. FASEB J. 2017 Jan.

Abstract

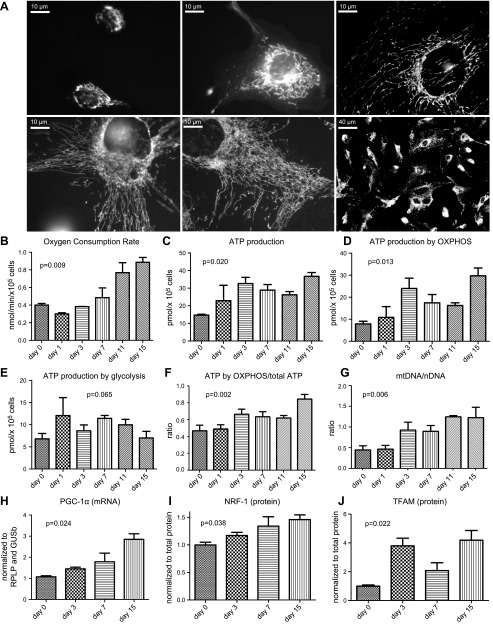
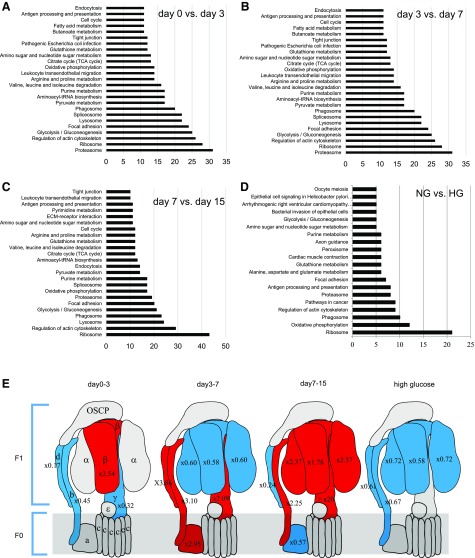
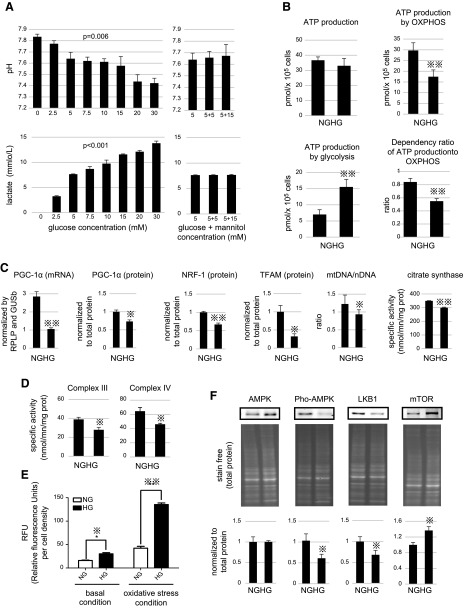
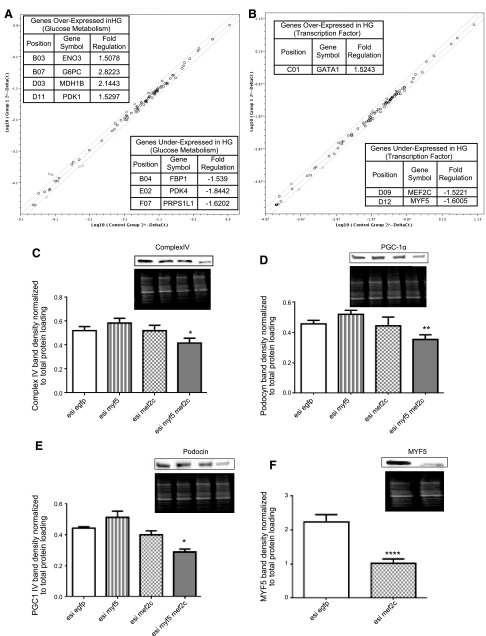
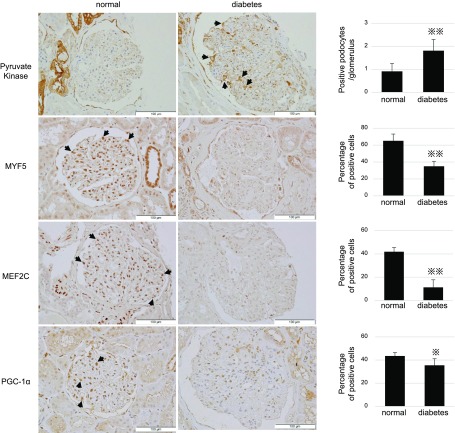
Podocytes play a key role in diabetic nephropathy pathogenesis, but alteration of their metabolism remains unknown in human kidney. By using a conditionally differentiating human podocyte cell line, we addressed the functional and molecular changes in podocyte energetics during in vitro development or under high glucose conditions. In 5 mM glucose medium, we observed a stepwise activation of oxidative metabolism during cell differentiation that was characterized by peroxisome proliferator-activated receptor-γ coactivator 1α (PGC-1α)-dependent stimulation of mitochondrial biogenesis and function, with concomitant reduction of the glycolytic enzyme content. Conversely, when podocytes were cultured in high glucose (20 mM), stepwise oxidative phosphorylation biogenesis was aborted, and a glycolytic switch occurred, with consecutive lactic acidosis. Expression of the master regulators of oxidative metabolism transcription factor A mitochondrial, PGC-1α, AMPK, and serine-threonine liver kinase B1 was altered by high glucose, as well as their downstream signaling networks. Focused transcriptomics revealed that myocyte-specific enhancer factor 2C (MEF2C) and myogenic factor 5 (MYF5) expression was inhibited by high glucose levels, and endoribonuclease-prepared small interfering RNA-mediated combined inhibition of those transcription factors phenocopied the glycolytic shift that was observed in high glucose conditions. Accordingly, a reduced expression of MEF2C, MYF5, and PGC-1α was found in kidney tissue sections that were obtained from patients with diabetic nephropathy. These findings obtained in human samples demonstrate that MEF2C-MYF5-dependent bioenergetic dedifferentiation occurs in podocytes that are confronted with a high-glucose milieu.-Imasawa, T., Obre, E., Bellance, N., Lavie, J., Imasawa, T., Rigothier, C., Delmas, Y., Combe, C., Lacombe, D., Benard, G., Claverol, S., Bonneu, M., Rossignol, R. High glucose repatterns human podocyte energy metabolism during differentiation and diabetic nephropathy.

Keywords: MEF2C; human kidney; mitochondria.


Figures

Figure 1.
Figure 1.
Podocyte physiology and energetics during differentiation. A) Representative images of cultured, differentiating podocytes at the day of switching to 37°C (d 0), at 3 d after the switch (d 3), and at d 7, 11, and 15 (mature podocytes). The mitochondrial network (white tubules) was stained with MitotrackerGreen. B) Oxygen consumption rate (nmol/min/×105 cells) at each differentiation stage. C) Changes of cellular ATP content (pmol/×105 cells) during differentiation. D) Changes of ATP content produced by oxphos (pmol/×105 cells) during differentiation. E) Changes of ATP content produced by glycolysis (pmol/×105 cells) during differentiation. F) Contribution of oxphos to total ATP production. G) mtDNA/nDNA (nuclear DNA) ratio determined by using quantitative PCR. H) mRNA content of PGC-1α measured by quantitative PCR. I) NRF-1 expression determined by Western blotting. K) TFAM expression determined by Western blotting. Histograms indicate means ± sd. P values by 1-way ANOVA are indicated in graphs.
Figure 2.
Figure 2.
AC) Differential proteomic analysis of podocytes from d 0 to 3 (A), from d 3 to 7 (B), and from d 7 to 15 (C). Proteins that showed >20% change in their expression levels with statistical significance (P < 0.05) were selected and categorized by Kyoto Encyclopedia of Genes and Genomes (KEGG) analysis. Graphs show the number of proteins that belong to the top 25 categories. D) Only decreased proteins (>20% change with statistical significance) in HG compared with those in HG were categorized into functional groups by KEGG analysis. Bars show the number of decreased proteins that belong to the top 20 categories. E) Schematic representation of complex V and changes in subunit expression during podocyte differentiation and on HG condition. Increased proteins are shown in red, decreased in blue (fold change is indicated in each subunit). ECM, extracellular matrix.
Figure 3.
Figure 3.
A) Analyses of culture medium from d 11–13 (left: glucose concentrations 0, 2.5, 5, 7.5, 10, 15, 20, and 30 mM from left to right, respectively; right: culture medium with 5 mM glucose, with 5 mM glucose and 5 mM mannitol, and with 5 mM glucose and 15 mM mannitol from left to right, respectively). Representative images of the culture medium (top). pH of the culture media (middle). Lactate levels in culture media (bottom). P values by 1-way ANOVA are indicated in graphs. B) Measurement of podocyte ATP content when cultured in normal glucose (NG; 5 mM) or HG (20 mM) condition. Total ATP, mitochondrial ATP, and glycolytic ATP content in podocytes, and contribution of oxphos to the total ATP content were analyzed. C) PGC-1α mRNA expression was determined by quantitative PCR. PGC-1α, NRF-1, and TFAM expression were determined by Western blotting. mtDNA/nDNA (nuclear DNA) ratio in podocytes cultured in HG or NG medium was also analyzed by quantitative PCR. Citrate synthase enzymatic activities, as a quantitative marker for the content of intact mitochondria, were also measured in podocytes cultured in NG or HG. D) Enzymatic activities of complexes III and IV in podocytes cultured in NG or HG were analyzed. E) Changes in reactive oxygen species (ROS) levels of podocytes cultured in NG or HG were monitored with or without oxidative stress condition. F) Expression level of total AMPK, Thr172-phosphorylated AMPK, LKB1, and mTOR in podocytes cultured in HG or NG medium were analyzed by Western blotting. GUSb, beta glucuronidase; RPLP, ribosomal phosphoprotein. Histograms indicate means ± sd. *P < 0.05, **P < 0.01, unpaired Student's t test.
Figure 4.
Figure 4.
A, B) Changes of mRNA level of 84 genes involved in glucose metabolism (A) or DNA transcription (B) between podocytes cultured in normal glucose (NG) or HG as analyzed by quantitative PCR microarray. Tables in panels show genes whose expression levels were statistically different between both groups. A scheme of the main regulatory network identified in podocyte remodeling by hyperglycemia. CF) Complex IV (C), PGC-1α (D), and podocin (E) expression of podocytes cultured with esiRNA of EGFP, MYF5 (F), MEF2C, and MYF5 + MEF2C were determined by Western blotting.
Figure 5.
Figure 5.
Representative images of immunostaining of kidney-biopsied specimens from normal participants and patients with diabetic nephropathy. Arrows indicate positive podocytes. Percentages of positive cells for PGC-1a, MYF5, and MEF2 per total cells in glomeruli were calculated. For pyruvate kinase, numbers of positive podocytes per glomerulus were counted. *P < 0.05, **P < 0.01, unpaired Student's t test.

References

    1. Dronavalli S., Duka I., Bakris G. L. (2008) The pathogenesis of diabetic nephropathy. Nat. Clin. Pract. Endocrinol. Metab. 4, 444–452 - PubMed
    1. Gassler N., Elger M., Kränzlin B., Kriz W., Gretz N., Hähnel B., Hosser H., Hartmann I. (2001) Podocyte injury underlies the progression of focal segmental glomerulosclerosis in the fa/fa Zucker rat. Kidney Int. 60, 106–116 - PubMed
    1. Hara M., Yamagata K., Tomino Y., Saito A., Hirayama Y., Ogasawara S., Kurosawa H., Sekine S., Yan K. (2012) Urinary podocalyxin is an early marker for podocyte injury in patients with diabetes: establishment of a highly sensitive ELISA to detect urinary podocalyxin. Diabetologia 55, 2913–2919 - PMC - PubMed
    1. Li J. J., Kwak S. J., Jung D. S., Kim J. J., Yoo T. H., Ryu D. R., Han S. H., Choi H. Y., Lee J. E., Moon S. J., Kim D. K., Han D. S., Kang S. W. (2007) Podocyte biology in diabetic nephropathy. Kidney Int. Suppl. 72(106), S36–S42 - PubMed
    1. Ihalmo P., Wessman M., Kaunisto M. A., Kilpikari R., Parkkonen M., Forsblom C., Holthöfer H., Groop P. H.; FinnDiane Study Group (2008) Association analysis of podocyte slit diaphragm genes as candidates for diabetic nephropathy. Diabetologia 51, 86–90 - PubMed

Publication types