. 2016 Oct 25:10:247.
doi: 10.3389/fncel.2016.00247. eCollection 2016.

Potentiation of Schaffer-Collateral CA1 Synaptic Transmission by eEF2K and p38 MAPK Mediated Mechanisms

Affiliations

Potentiation of Schaffer-Collateral CA1 Synaptic Transmission by eEF2K and p38 MAPK Mediated Mechanisms

Weiguang Weng et al. Front Cell Neurosci. .

Abstract

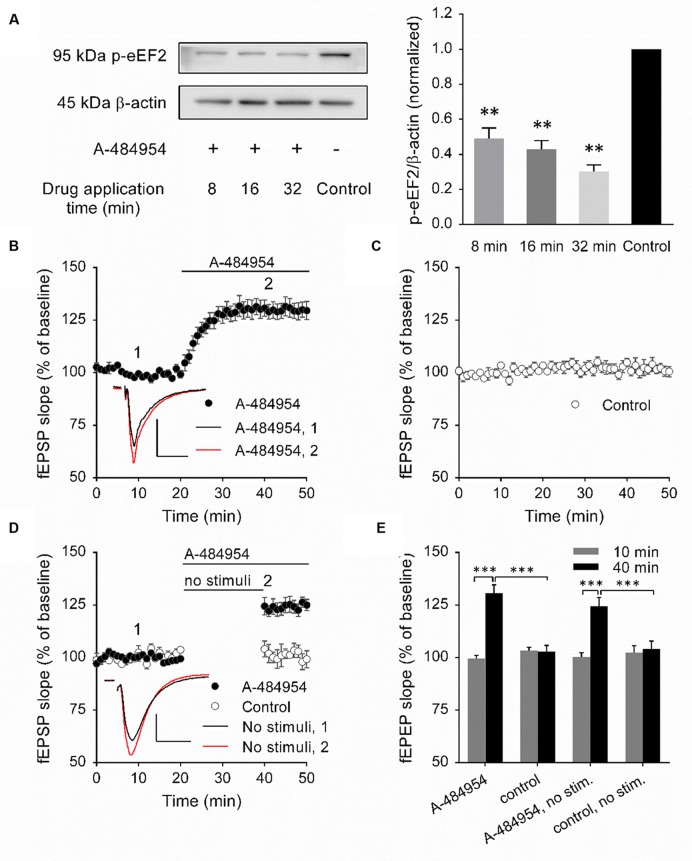
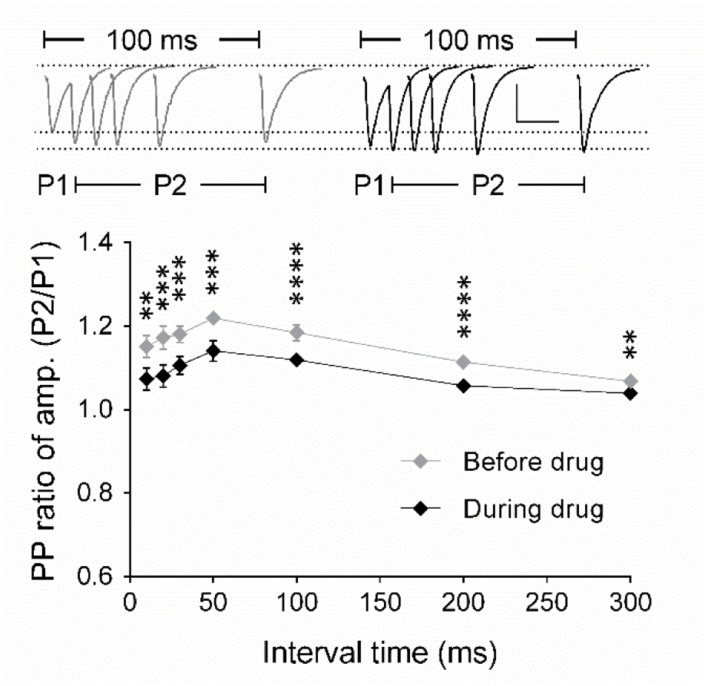
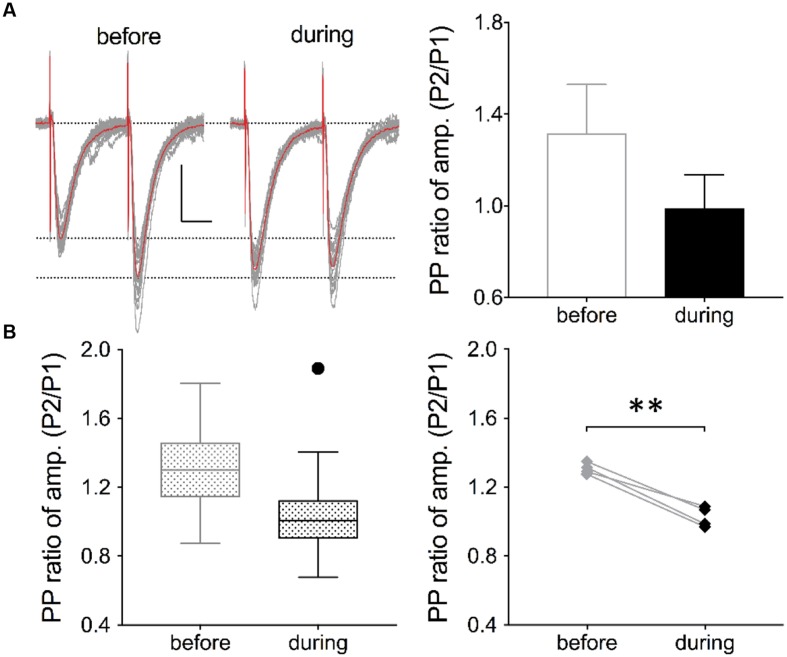
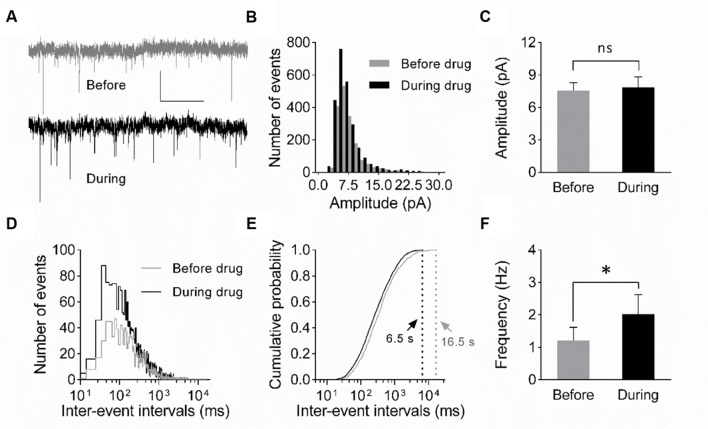
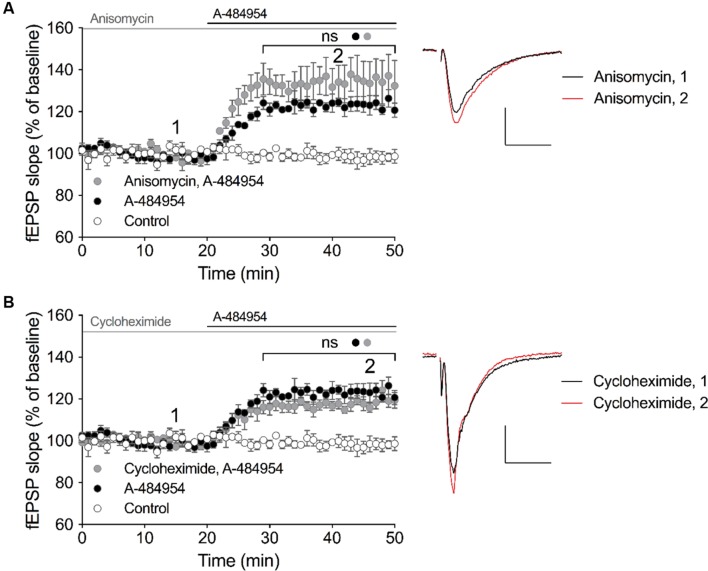
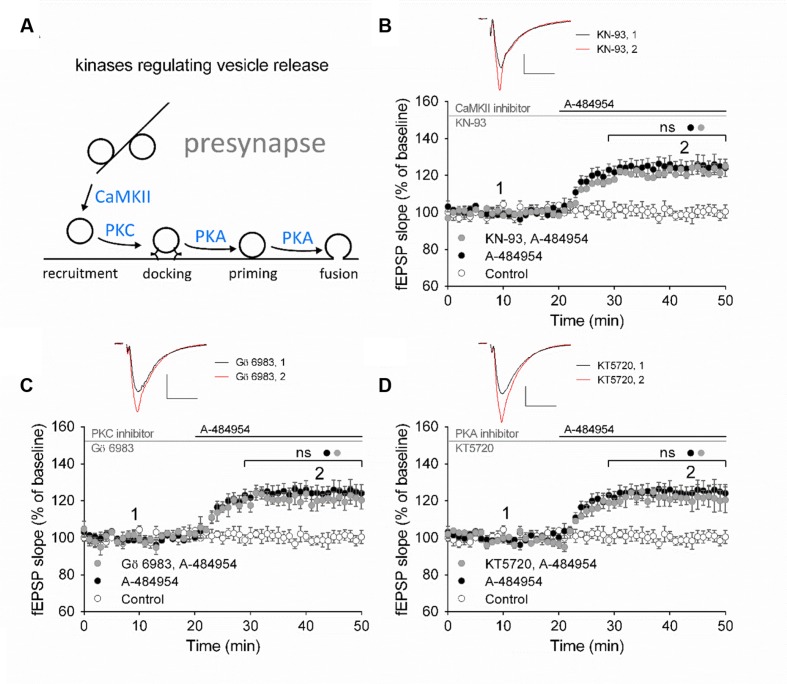
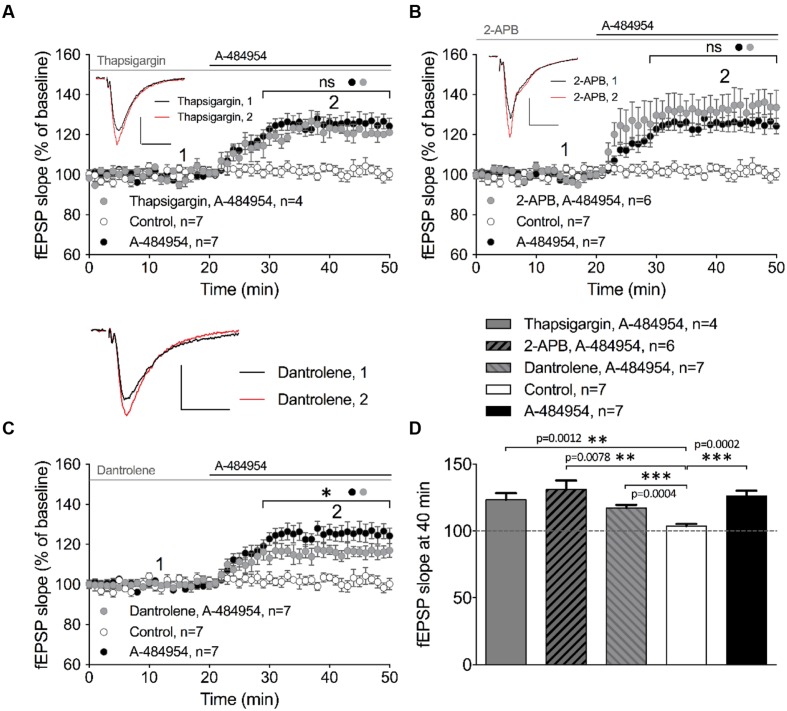
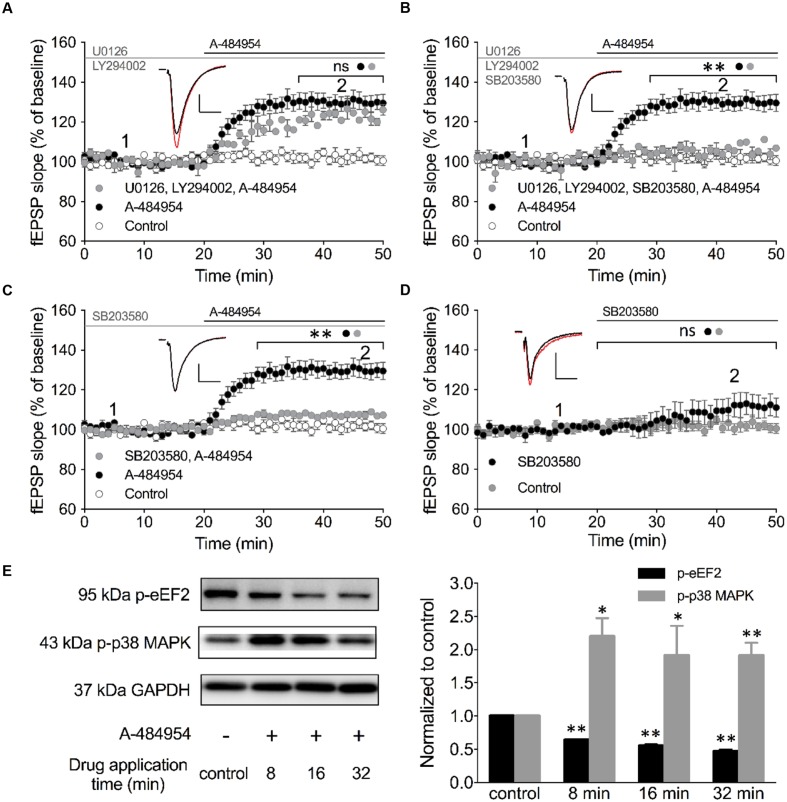
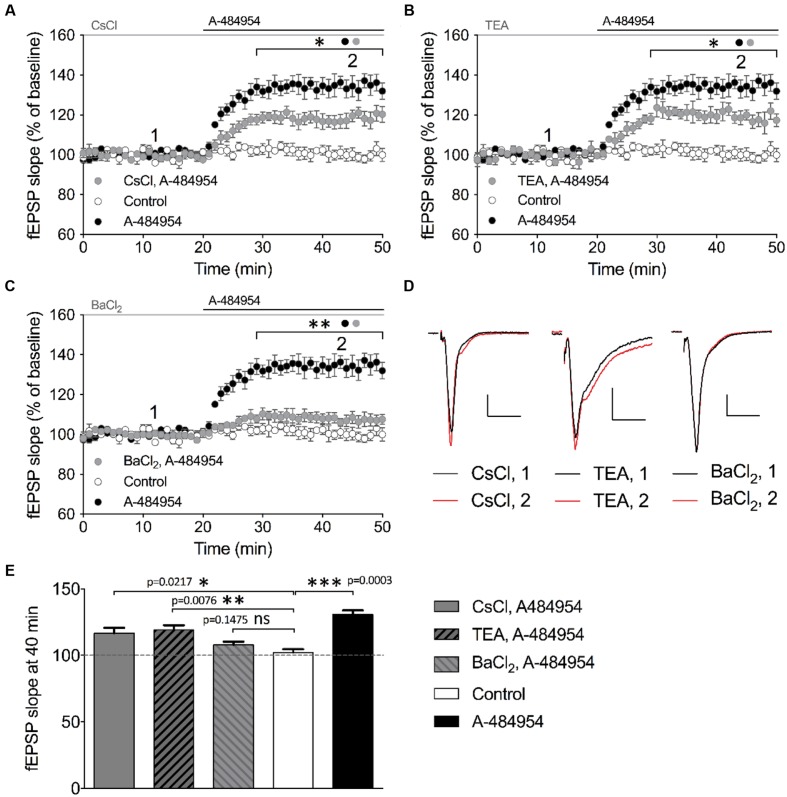
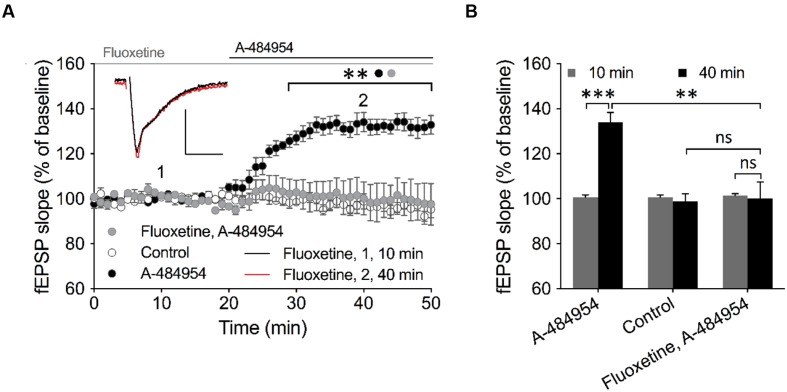
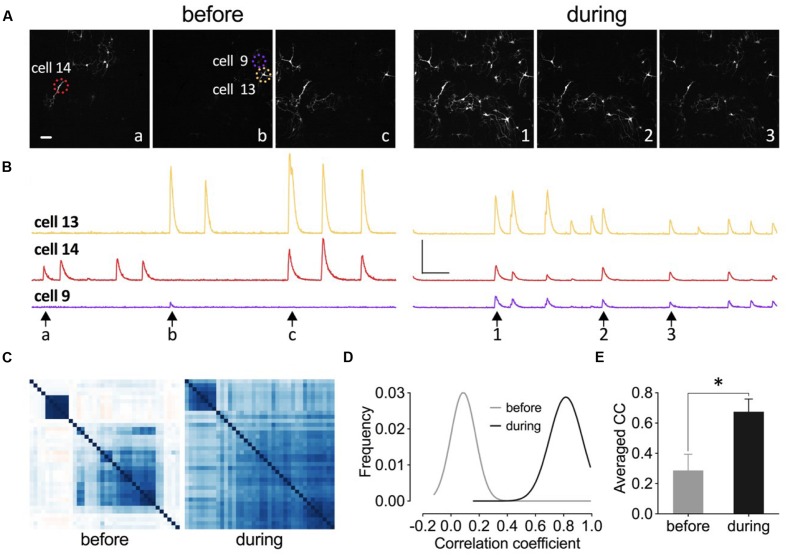
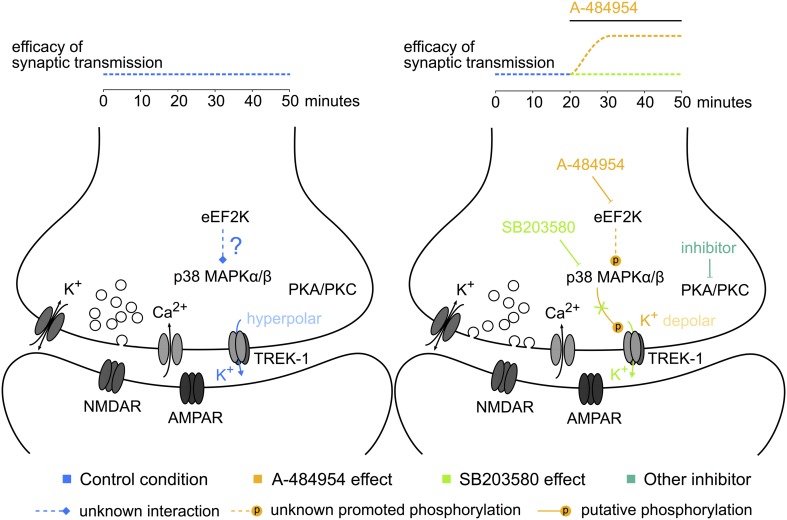
The elongation factor 2 kinase (eEF2K), likewise known as CaMKIII, has been demonstrated to be involved in antidepressant responses of NMDA receptor antagonists. Even so, it remains open whether direct inhibition of eEF2K without altering up-stream or other signaling pathways affects hippocampal synaptic transmission and neuronal network synchrony. Inhibition of eEF2K by the selective and potent eEF2K inhibitor A-484954 induced a fast pre-synaptically mediated enhancement of synaptic transmission and synchronization of neural network activity. The eEF2K-inhibition mediated potentiation of synaptic transmission of hippocampal CA1 neurons is most notably independent of protein synthesis and does not rely on protein kinase C, protein kinase A or mitogen-activated protein kinase (MAPK)/extracellular signal-regulated protein kinase 1/2. Moreover, the strengthening of synaptic transmission in the response to the inhibition of eEF2K was strongly attenuated by the inhibition of p38 MAPK. In addition, we show the involvement of barium-sensitive and more specific the TWIK-related potassium-1 (TREK-1) channels in the eEF2K-inhibition mediated potentiation of synaptic transmission. These findings reveal a novel pathway of eEF2K mediated regulation of hippocampal synaptic transmission. Further research is required to study whether such compounds could be beneficial for the development of mood disorder treatments with a fast-acting antidepressant response.

Keywords: MAPK; eEF2; hippocampus; memory; oscillation; protein synthesis; synaptic plasticity.


Figures

FIGURE 1
FIGURE 1
Inhibition of eEF2K by A-484954 mediates an input nonspecific potentiation of synaptic transmission. (A) The western blots indicate the decrease in eEF2 phosphorylation in response to the inhibition of eEF2K in comparison with drug-free samples. The bar graph summarizes the normalized phosphorylation level of eEF2 for drug applications of 8, 16, and 32 min. The application of A-484954 significantly prevented the phosphorylation of the eEF2K substrate eEF2. (B) Inhibition of eEF2K by 5 μM A-484954 (black circles, n = 9) elicited a potentiation of fEPSPs that reached a maximum within 10 min. (C) fEPSPs were recorded under drug-free conditions (control, white circles, n = 9). (D) The effect of A-484954 on synaptic transmission did not require evoked stimulation of the synapses. The insets indicate representative fEPSP traces before (black line) and after (red line) drug application. Scale bar, 0.5 mV/10 ms. (E) The bar graph summarizes the fEPSP slope values under different conditions and before (10 min) and during (40 min) drug application. The brackets and/or asterisks indicate a significant difference (∗∗p < 0.01; ∗∗∗p < 0.001) between control and drug groups. Horizontal black lines indicate the time of drug application.
FIGURE 2
FIGURE 2
Analysis of the paired-pulse ratio (PP ratio) of fEPSPs indicates a presynaptic origin of eEF2K-inhibition mediated potentiation. The graph summarizes the PP ratio of fEPSP amplitudes for before (gray diamond, n = 9) and after (black diamond, n = 9) A-484954. PP ratios after drug application differed significantly for all inter-stimulus intervals (bracket, ∗∗p < 0.01, ∗∗∗p < 0.001, ∗∗∗∗p < 0.0001, paired t-test). Insets show representative fEPSP traces before and after drug application. Scale bar: 0.5 mV/20 ms.
FIGURE 3
FIGURE 3
Inhibition of eEF2K alters the PP ratio of evoked EPSCs. (A) Traces of 19 evoked EPSCs (gray lines) before and after drug application are shown. The interstimulus interval was 50 ms. The traces of averaged EPSCs are shown in red. Scale bar: 50 pA/20 ms. Right: Analysis of the traces (19 EPSCs) revealed that the averaged PP ratio value was reduced after 10 min of drug application (black circle) in comparison with the baseline value (gray circle). (B) The left graph summarizes the distribution of PP ratios before and during drug application of all recordings in four neurons. The black dot represents an outlier. To the right, the averaged values of four experiments are presented and the significant effect has been indicated with a bracket and ∗∗ (p < 0.01, p = 0.0027).
FIGURE 4
FIGURE 4
Increase in mEPSC frequency suggests a presynaptic origin of eEF2K-inhibition mediated potentiation. (A) Representative traces of whole-cell voltage-clamp recordings of mEPSCs before (gray) and during (black) drug application are depicted. Scale bar: 10 pA/2 s. (B) The histogram summarizes the distribution of mEPSC amplitudes before (gray bars) and during (black bars) drug application over all events of all recordings (n = 7). (C) The mean amplitude before (gray bar) and during (black bar) drug application do not differ significantly (n = 7; 7.6 ± 0.7 pA versus 7.8 ± 1.0 pA; ns: p = 0.94). (D) The histogram indicates the distribution of the inter-event intervals for before (gray) and during (black) drug application for all events of all neurons analyzed (n = 7). (E) The cumulative probability of inter-event intervals of mEPSCs before (gray) and during (black) drug application differs. Vertical dashed lines indicate the maximal values of the inter-event intervals before (gray) and during (black) drug application. (F) The mean mEPSC frequencies differ significantly (p = 0.0148) before and during drug application (n = 7, 1.2 ± 0.4 Hz versus 2.0 ± 0.6 Hz).
FIGURE 5
FIGURE 5
eEF2K-inhibition mediated-fEPSP potentiation does not rely on protein synthesis. (A) The graph summarizes the mean values of normalized fEPSP slopes for different time points and experimental conditions (control: white circles, n = 4; 5 μM A-484954: black circles, n = 4; 20 μM anisomycin: gray circles, n = 4). (B) Cycloheximide (gray circles, 100 μM, n = 4) did not alter the A-481954-mediated (black circles, n = 4) potentiation of fEPSP. The potentiation of fEPSP remained significantly higher than that observed under control conditions (no A-481954, white circles, n = 4). Horizontal black lines indicate the application period of A-484954 and gray lines indicates the application time of protein synthesis inhibitors. The brackets enclose time points with non-significant (ns) differences between conditions. To the right of the graphs, representative fEPSP traces for the time points 1 and 2 are depicted. Scale bar: 0.5 mV/10 ms.
FIGURE 6
FIGURE 6
eEF2K-inhibition mediated fEPSP-potentiation does not rely on CaMKII, PKC or PKA. (A) The schemata outlines the relation of kinases in the regulation of vesicle release. (B) Inhibition of CaMKII by KN-93 does not attenuate drug-induced potentiation (control: white circles = 6; 5 μM A-484954: black circles, n = 6; 20 μM KN-93: gray circles, n = 4). (C) The graph represents data of PKC inhibition experiments (gray circles: n = 4) in comparison to drug-free (control: white circles, n = 6) and A-484954 (black circles: n = 6) experiments. (D) Inhibition of PKA (KT5720: gray circles, n = 4) did not alter the time course of fEPSPs in comparison with experiments with the application of A-484954 alone (black circles, n = 6). The drug-induced potentiation remained significantly different from that in control experiments (white circles, n = 6). Black and gray horizontal lines represent the application period of A-484954 and inhibitors, respectively. Brackets enclose periods with significant differences (ns: p > 0.05) between groups as specified by the circles. fEPSP traces at time points 1 and 2 are depicted. Scale bars: 0.5 mV/10 ms.
FIGURE 7
FIGURE 7
eEF2K-inhibition mediated fEPSP-potentiation relies partially on intracellular calcium release. (A) Application of thapsigargin (10 μM thapsigargin: gray circles, n = 4) did not alter A-484954-induced fEPSP potentiation over time (drug-free: control, white circles, n = 7; 5 μM A-484954 alone; black circles, n = 7). (B) Inhibition of InsP3R-mediated intracellular calcium release (100 μM 2-APB: gray circles, n = 6) did not alter the slope of fEPSP potentiation (A-484954: black circles, n = 7), which remained significantly different from that in drug-free experiments (white circles, n = 7). (C) Inhibition of ryanodine receptors (20 μM dantrolene: gray circles, n = 7) significantly attenuated (p = 0.037) the potentiation of fEPSP mediated by eEF2K inhibition in comparison with A-484954 alone (black circles, n = 7). However, experiments with dantrolene gave significantly elevated results in comparison with drug-free measurements (control: white circles, n = 7). Black and gray lines indicate A-484954 and inhibitor application times, respectively. Brackets indicate significance levels (p < 0.05; ns: p > 0.05) between groups (circles). fEPSP traces for the time points 1 and 2 are depicted. Scale bars: 0.5 mV/10 ms. (D) The bar graph summarizes the observations and significance levels (brackets, ∗∗p < 0.01, ∗∗∗p < 0.001) for the different experimental conditions in comparison with drug-free (control) experiments for fEPSP slope values at the 40-min time point.
FIGURE 8
FIGURE 8
Inhibition of p38 MAPK attenuates eEF2K-inhibition mediated fEPSP-potentiation. (A) The line graph summarizes the resulting fEPSP slopes over time under three experimental conditions (control: white circles; 5 μM A-484954: black circles; 10 μM U0126 plus 10 μM LY492002: gray circles). U0126 and LY492002 are inhibitors of MEK 1/2 and PI3K, respectively. (B) Additional application of a p38 MAPK inhibitor (10 μM SB203580) to the MEK 1/2-PI3K inhibitor cocktail (gray circles) significantly attenuated the A-484954-mediated potentiation of fEPSP (black circles; p < 0.01, p = 0.0024 at 40 min). The resulting fEPSPs were similar in size in comparison with drug-free experiments. (C) Application of the p38 MAPK inhibitor alone (gray circles) also prevented the A-484954-mediated potentiation of fEPSP (black circles) significantly (p < 0.01, p = 0.0003 at 40 min). (D) Application of the p38 MAPK inhibitor alone (black circles) did not alter the fEPSP baseline (p = 0.07 at 45 min) in comparison with drug-free baseline values (gray circles). Brackets with asterisks indicate the significance level (∗∗p < 0.01 or ns: p > 0.05) between the groups specified by circles. fEPSP traces at the time points 1 (black) and 2 (red) are depicted. Scale bars: 0.5 mV/10 ms. (E) The left panel illustrates representative Western blots for p-eEF2, p-p38 MAPK (Thr180/Tyr182) and GAPDH in total protein lysates from the CA1 region without (-) and after 5 μM A-484954 treatment for 8, 16, and 32 min (+). The bar graph summarizes normalized western blot data for p-EF2 and p-p38 MAPK. The phosphorylation levels of p38 MAPK (Thr180/Tyr182, gray bar) and eEF2 (black bar) were significantly different from the control (drug-free) measurements (∗∗p < 0.01; n = 3/group).
FIGURE 9
FIGURE 9
Barium sensitive potassium channels are required for eEF2K-inhibition mediated fEPSP potentiation. (A) The graph indicates the fEPSP slopes over time under three experimental conditions (control: white circles, n = 4; 5 μM A-484954: black circles, n = 4; 2 mM CsCl2: gray circles, n = 4). (B) Blockage of TEA (10 mM, gray circles)-sensitive potassium channels partially but significantly attenuated A-484954-mediated fEPSP potentiation (black circles, n = 4). The remaining fEPSP potentiation was still significantly different from that of drug-free experiments (white circles, n = 4). (C) Pre-application with 400 μM BaCl2 significantly prevented A-484954-mediated fEPSP potentiation (p < 0.01). fEPSP slopes were similar in size to those with drug-free experiments (control: white circles, n = 4). Horizontal black and gray lines indicate A-484954 and, CsCl, TEA, or BaCl2 application times, respectively. Brackets enclose the time points of significant differences (p < 0.05; ∗∗p < 0.01) between groups (circle) per time point. (D) Representative fEPSP traces for the time points 1 and 2 and compounds are depicted. Scale bars: 0.5 mV/10 ms. (E) The bar graph summarizes the observations and significance levels (brackets; p < 0.05; ∗∗p < 0.01; ∗∗∗p < 0.001) for different experimental conditions in comparison with drug-free (control: white bar) experiments for fEPSP slope values at the 40-min time point.
FIGURE 10
FIGURE 10
TREK-1 is involved in eEF2K-inhibition mediated fEPSP potentiation. (A) The graph outlines fEPSP-slopes over time under three experimental conditions (control: white circles, n = 4; 5 μM A-484954: black circles, n = 6; 100 μM Fluoxetine + 5 μM A-484954: gray circles, n = 6). The pretreatment and co-application of hippocampal slices with Fluoxetine and A-484954 significantly blocked A-484954 mediated fEPSP potentiation (p < 0.01). The resulting fEPSP slopes were similar in size as in the non-drug experiments (control: white circles). Horizontal black and gray lines indicate the A-484954 and Fluoxetine application period respectively. fEPSP traces for fluoxetine co-application experiments are shown. Scale bars: 0.5 mV/10 ms. (B) The bar graph summarizes averaged fEPSP-slope values for different experiments at the 10- and 40-min time points. Brackets enclose experimental groups with significant difference (∗∗p < 0.01, p = 0.0024; ∗∗∗p < 0.001, p = 0.0003).
FIGURE 11
FIGURE 11
Inhibition of eEF2K synchronizes neuronal activity pattern in primary hippocampal cell cultures. (A–C) Images, traces, and heat maps in the figure represent data from one representative experiment before and during drug application. (A) The time points for the representative frames of a fluorescence image sequence are indicated under the traces in (B) with arrows and letters or numbers. Dashed circles indicate representative neurons (14, 9, and 13). Scale bar, 100 μm. (B) The time courses of changes in fluorescence intensity for three neurons (color-coded throughout the figure) before and during drug application are presented. Vertical scale bar: 2000 (F-F0/F0) and horizontal bar: 5 s. (C) The degree of synchronized spike activity of neurons to each other are represented by a Pearson’s correlation based hierarchical clustering matrices. (D) Theoretical Gaussian fits for the frequency distribution histograms of Pearson’s correlation coefficients were created for all neuronal pairs of three cultures analyzed before and during drug application. (E) The bar graph summarizes the mean values of correlation coefficient (CC) matrices. The brackets and asterisks indicate the degree of significant difference (p < 0.05) of the coefficients before (0.29 ± 0.11) and after drug application (0.67 ± 0.08).
FIGURE 12
FIGURE 12
Potential elements of the eEF2K-inhibition mediated potentiation. The sketch to the left indicates some of the components studied and their interaction or activity during baseline stimulation. To the right, the modulation of the phosphorylation level and the resulting synaptic potentiation after eEF2K-inhibition are presented. The color of the text corresponds to the potentiation indicated above the sketch. Dotted lines: unknown pathways of interaction; lines ending with a stroke: inhibition; lines ending with a P: phosphorylation. A hypothesis based on our data implicates that the inhibition of eEF2K mediates a potentiation of synaptic transmission by altering the release probability of vesicles with the participation of p38 MAPK and potassium channel phosphorylation-mediated reduction of the resting membrane potential at the synaptic button.

References

    1. Abeliovich A., Chen C., Goda Y., Silva A. J., Stevens C. F., Tonegawa S. (1993). Modified hippocampal long-term potentiation in PKC gamma-mutant mice. Cell 75 1253–1262. 10.1016/0092-8674(93)90613-U - DOI - PubMed
    1. Alboni S., Van Dijk R. M., Poggini S., Milior G., Perrotta M., Drenth T., et al. (2015). Fluoxetine effects on molecular, cellular and behavioral endophenotypes of depression are driven by the living environment. Mol. Psychiatry 10.1038/mp.2015.191 [Epub ahead of print]. - DOI - PMC - PubMed
    1. Autry A. E., Adachi M., Nosyreva E., Na E. S., Los M. F., Cheng P. F., et al. (2011). NMDA receptor blockade at rest triggers rapid behavioural antidepressant responses. Nature 475 91–95. 10.1038/nature10130 - DOI - PMC - PubMed
    1. Bain J., Plater L., Elliott M., Shpiro N., Hastie C. J., Mclauchlan H., et al. (2007). The selectivity of protein kinase inhibitors: a further update. Biochem. J. 408 297–315. 10.1042/BJ20070797 - DOI - PMC - PubMed
    1. Bastos A. G., Guimaraes L. S., Trentini C. M. (2015). The efficacy of long-term psychodynamic psychotherapy, fluoxetine and their combination in the outpatient treatment of depression. Psychother. Res. 25 612–624. 10.1080/10503307.2014.935519 - DOI - PubMed

LinkOut - more resources