. 2016 Oct 25:10:251.
doi: 10.3389/fncel.2016.00251. eCollection 2016.

AMPA Receptors Are Involved in Store-Operated Calcium Entry and Interact with STIM Proteins in Rat Primary Cortical Neurons

Affiliations

AMPA Receptors Are Involved in Store-Operated Calcium Entry and Interact with STIM Proteins in Rat Primary Cortical Neurons

Joanna Gruszczynska-Biegala et al. Front Cell Neurosci. .

Abstract

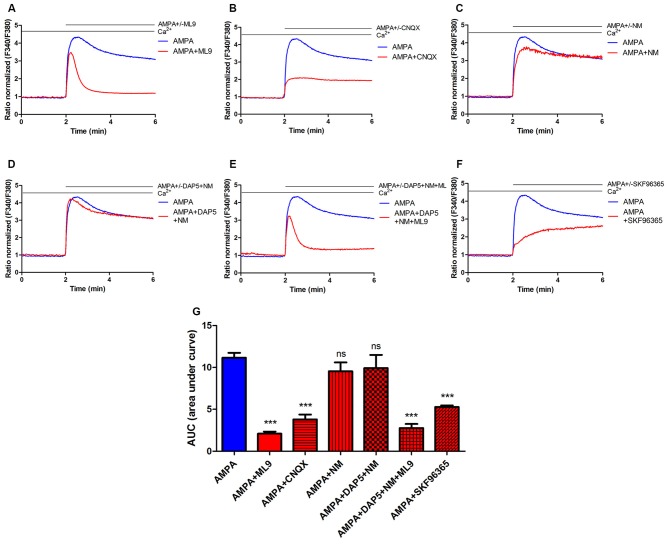
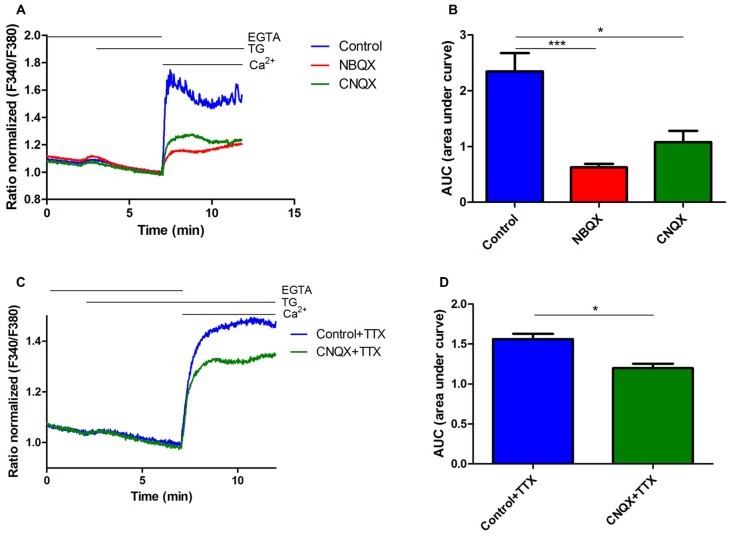
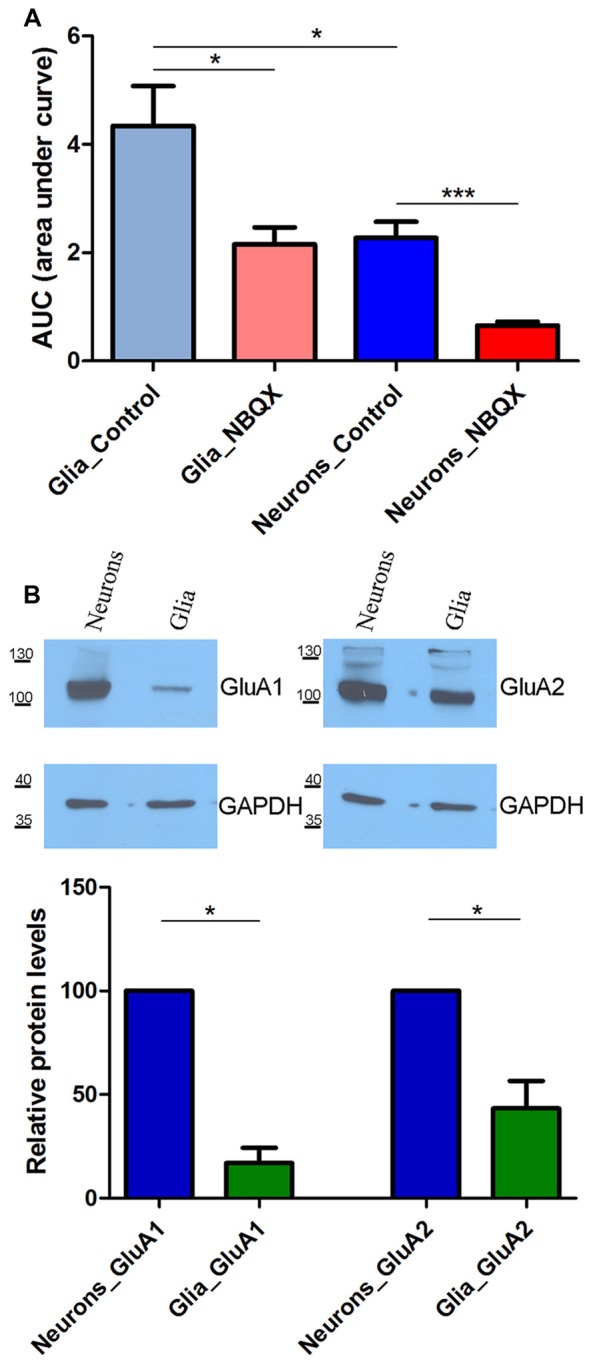
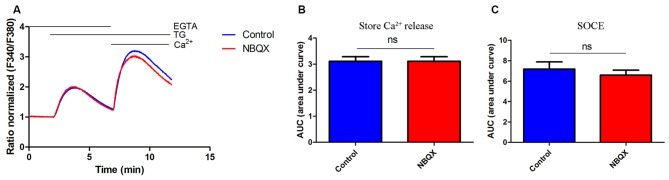
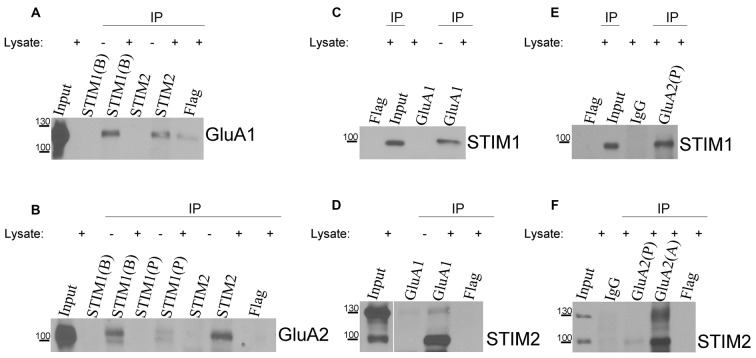
The process of store-operated calcium entry (SOCE) leads to refilling the endoplasmic reticulum (ER) with calcium ions (Ca2+) after their release into the cytoplasm. Interactions between (ER)-located Ca2+ sensors (stromal interaction molecule 1 [STIM1] and STIM2) and plasma membrane-located Ca2+ channel-forming protein (Orai1) underlie SOCE and are well described in non-excitable cells. In neurons, however, SOCE appears to be more complex because of the importance of Ca2+ influx via voltage-gated or ionotropic receptor-operated Ca2+ channels. We found that the SOCE inhibitors ML-9 and SKF96365 reduced α-amino-3-hydroxy-5-methyl-4-isoxazolepropionic acid (AMPA)-induced [Ca2+]i amplitude by 80% and 53%, respectively. To assess the possible involvement of AMPA receptors (AMPARs) in SOCE, we used their specific inhibitors. As estimated by Fura-2 acetoxymethyl (AM) single-cell Ca2+ measurements in the presence of CNQX or NBQX, thapsigargin (TG)-induced Ca2+ influx decreased 2.2 or 3.7 times, respectively. These results suggest that under experimental conditions of SOCE when Ca2+ stores are depleted, Ca2+ can enter neurons also through AMPARs. Using specific antibodies against STIM proteins or GluA1/GluA2 AMPAR subunits, co-immunoprecipitation assays indicated that when Ca2+ levels are low in the neuronal ER, a physical association occurs between endogenous STIM proteins and endogenous AMPAR receptors. Altogether, our data suggest that STIM proteins in neurons can control AMPA-induced Ca2+ entry as a part of the mechanism of SOCE.

Keywords: AMPA receptors; STIM; calcium signaling; neurons; store-operated calcium entry (SOCE).


Figures

Figure 1
Figure 1
Store-operated calcium entry (SOCE) inhibitor ML9 decreases α-amino-3-hydroxy-5-methyl-4-isoxazolepropionic acid (AMPA)-induced changes in [Ca2+]i in rat cortical neurons. (A–F) Average traces of AMPA-induced intracellular Ca2+ (F340/F380) levels obtained by ratiometric Fura-2 acetoxymethyl (AM) analysis of untreated neurons (control) and neurons treated with indicated antagonists. Measurements were started in a buffer with 2 mM CaCl2, then in a buffer that contained 100 μM AMPA in the absence or presence indicated antagonists 100 μM ML-9 (A) 30 μM CNQX (B) 5 μM nimodipine (NM; C) 10 μM DAP-5 + 5 μM NM (D) 10 μM DAP-5 + 5 μM NM + 100 μM ML9 (E) 30 μM SKF96365 (F). F340/F380 values just before the addition of the AMPAR agonist were normalized to the same values (1). The data represent n independent experiments that were conducted on four different primary cultures, corresponding to 960 (AMPA, n = 17), 677 (AMPA + ML9, n = 13), 311 (AMPA + CNQX, n = 9), 309 (AMPA + NM, n = 10), 258 (AMPA + DAP5 + NM, n = 8), 289 (AMPA + DAP5 + NM + ML9, n = 8) and 95 (AMPA + SKF96365, n = 6) analyzed cells that responded to KCl. (G) Summary data showing AMPA-induced changes in [Ca2+]i in treated neurons compared with untreated neurons. The data are expressed as the AUC, which was calculated from the moment immediately before the addition of Ca2+. ***p < 0.001; ns, not significant compared with the control (Student’s t-test, Mann-Whitney U test).
Figure 2
Figure 2
Inhibition of thapsigargin (TG)-induced SOCE in rat cortical neurons by NBQX and CNQX. (A) Average traces of intracellular Ca2+ (F340/F380) levels obtained by ratiometric Fura-2 AM analysis of neurons treated with 30 μM NBQX or 30 μM CNQX and untreated cultures (blue). Measurements were started in a medium with 0.5 mM ethylene glycol tetraacetic acid (EGTA), which was then replaced by a medium with 0.5 mM EGTA and either 2 μM TG + 30 μM NBQX or 2 μM TG + 30 μM CNQX. Finally, 2 mM CaCl2 was added to the medium to detect SOCE with either 30 μM NBQX or 30 μM CNQX. F340/F380 values just before the addition of Ca2+ were normalized to the same values (1). The data represent n = 28 (control), n = 17 (NBQX), and n = 13 (CNQX) independent experiments that were conducted on three different primary cultures, corresponding to 1160, 863, and 516 analyzed cells that responded to KCl, respectively. (C) Average traces of intracellular Ca2+ (F340/F380) levels obtained by ratiometric Fura-2 AM analysis of neurons treated with 30 μM CNQX + 1 μM TTX (green) and control cultures + 1 μM TTX (blue). The data represent n = 3 (control + TTX), and n = 3 (CNQX + TTX) independent experiments that were conducted on one primary culture, corresponding to 64 and 72 analyzed cells that responded to KCl, respectively. (B,D) Summary data showing SOCE as the AUC, which was calculated from the moment immediately before the addition of Ca2+. ***p < 0.001, *p < 0.05, compared with the control [Student’s t-test, Mann-Whitney U test (B); t-test, unpaired test (D)].
Figure 3
Figure 3
SOCE analysis in glia and neurons in the presence of 30 μM NBQX. (A) Experiments were performed as described in Figure 2 SOCE is shown as the AUC, which was calculated from the moment immediately before the addition of Ca2+. The number of recorded cells was 470 glial cells, 503 glial cells in the presence of NBQX, 869 neurons, and 863 neurons in the presence of NBQX. ***p < 0.001, *p < 0.05 (Student’s t-test, Mann-Whitney U test). (B) Expression of AMPA receptors (AMPARs) GluA1 and GluA2 subunits in whole-cell cortical lysates from neurons and glia. GAPDH was used as a loading control. The molecular masses of the markers that were run on the same gel are shown on the left. Bars indicate the quantification of Western blots showing the GluA1 and GluA2 levels normalized to the level of GAPDH. Values are expressed as a percentage of protein levels in neurons. The blots were performed four times from four independent cultures. *p < 0.05 (Student’s t-test, Mann-Whitney U test).
Figure 4
Figure 4
NBQX did not block TG-induced SOCE in HeLa cells. (A) Average traces of intracellular Ca2+ (F340/F380) levels obtained by ratiometric Fura-2 AM analysis of cells treated with 30 μM NBQX (red line) and untreated cells (blue line). Measurements were conducted as described in Figure 2. F340/F380 values just before the addition of TG were normalized to the same values (1). The data represents 16 independent measurements conducted in three different experiments, corresponding to 1300 for control cells and 1000 for NBQX cells. (B,C) Summary data presented as the AUC, showing TG-induced Ca2+ release from the endoplasmic reticulum (ER), which was calculated from the moment of the addition of TG until extracellular Ca2+ was added (B) or SOCE, which was calculated from the moment immediately before the addition of Ca2+ (C). ns, not significant (Student’s t-test, Mann-Whitney U test).
Figure 5
Figure 5
Co-immunoprecipitation of endogenous stromal interaction molecule 1 (STIM1) and STIM2 with GluA1 and GluA2 in lysates of neuronal cultures. Neurons were treated with TG for 10 min and lysed. Proteins were immunoprecipitated with (A,B) anti-STIM1 (BD Transduction Laboratories [B], ProSci [P]), (A,B) anti-STIM2, (C,D) anti-GluA1, or (E,F) anti-GluA2 (Proteintech [P], Alomone [A]) antibodies. Lysates (Inputs) and eluted fractions (immunoprecipitates, IP) were separated on 6% sodium dodecyl sulfate (SDS)-PAGE gels, and proteins were identified by Western blot using anti-GluA1, GluA2, STIM1, or STIM2 antibodies as indicated. When indicated, the lysates were omitted in the probes. Irrelevant mouse or rabbit anti-Flag and/or rabbit anti-IgG antibodies were used as negative controls. The molecular masses of the markers that were run on the same gel are shown on the left. Immunoprecipitation was performed three times from three different cultures with the same positive outcome.

References

    1. Abdullaev I. F., Bisaillon J. M., Potier M., Gonzalez J. C., Motiani R. K., Trebak M. (2008). Stim1 and Orai1 mediate CRAC currents and store-operated calcium entry important for endothelial cell proliferation. Circ. Res. 103, 1289–1299. 10.1161/01.RES.0000338496.95579.56 - DOI - PMC - PubMed
    1. Akbarian S., Smith M. A., Jones E. G. (1995). Editing for an AMPA receptor subunit RNA in prefrontal cortex and striatum in Alzheimer’s disease, Huntington’s disease and schizophrenia. Brain Res. 699, 297–304. 10.1016/0006-8993(95)00922-d - DOI - PubMed
    1. Arakawa N., Sakaue M., Yokoyama I., Hashimoto H., Koyama Y., Baba A., et al. . (2000). KB-R7943 inhibits store-operated Ca2+ entry in cultured neurons and astrocytes. Biochem. Biophys. Res. Commun. 279, 354–357. 10.1006/bbrc.2000.3968 - DOI - PubMed
    1. Baba A., Yasui T., Fujisawa S., Yamada R. X., Yamada M. K., Nishiyama N., et al. . (2003). Activity-evoked capacitative Ca2+entry: implications in synaptic plasticity. J. Neurosci. 23, 7737–7741. - PMC - PubMed
    1. Bain J., McLauchlan H., Elliott M., Cohen P. (2003). The specificities of protein kinase inhibitors: an update. Biochem. J. 371, 199–204. 10.1042/bj20021535 - DOI - PMC - PubMed