

Piezo-tolerant natural gas-producing microbes under accumulating p CO2
- PMID: 27826355
- PMCID: PMC5097443
- DOI: 10.1186/s13068-016-0634-7
Piezo-tolerant natural gas-producing microbes under accumulating p CO2
Abstract
Background: It is known that a part of natural gas is produced by biogenic degradation of organic matter, but the microbial pathways resulting in the formation of pressurized gas fields remain unknown. Autogeneration of biogas pressure of up to 20 bar has been shown to improve the quality of biogas to the level of biogenic natural gas as the fraction of CO2 decreased. Still, the pCO2 is higher compared to atmospheric digestion and this may affect the process in several ways. In this work, we investigated the effect of elevated pCO2 of up to 0.5 MPa on Gibbs free energy, microbial community composition and substrate utilization kinetics in autogenerative high-pressure digestion.
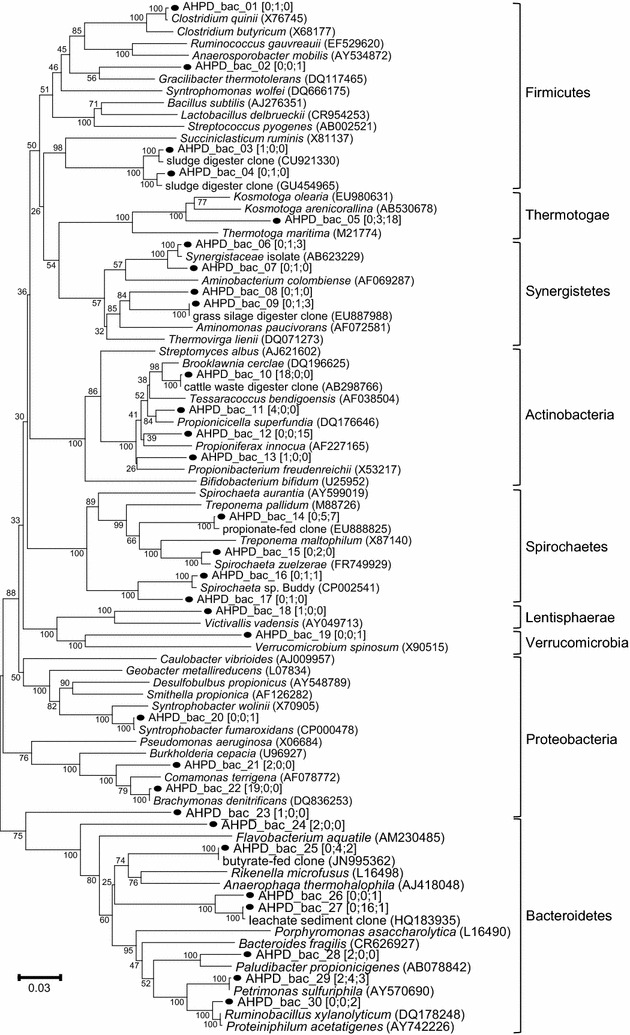
Results: In this study, biogas pressure (up to 2.0 MPa) was batch-wise autogenerated for 268 days at 303 K in an 8-L bioreactor, resulting in a population dominated by archaeal Methanosaeta concilii, Methanobacterium formicicum and Mtb. beijingense and bacterial Kosmotoga-like (31% of total bacterial species), Propioniferax-like (25%) and Treponema-like (12%) species. Related microorganisms have also been detected in gas, oil and abandoned coal-bed reservoirs, where elevated pressure prevails. After 107 days autogeneration of biogas pressure up to 0.50 MPa of pCO2, propionate accumulated whilst CH4 formation declined. Alongside the Propioniferax-like organism, a putative propionate producer, increased in relative abundance in the period of propionate accumulation. Complementary experiments showed that specific propionate conversion rates decreased linearly from 30.3 mg g-1 VSadded day-1 by more than 90% to 2.2 mg g-1 VSadded day-1 after elevating pCO2 from 0.10 to 0.50 MPa. Neither thermodynamic limitations, especially due to elevated pH2, nor pH inhibition could sufficiently explain this phenomenon. The reduced propionate conversion could therefore be attributed to reversible CO2-toxicity.
Conclusions: The results of this study suggest a generic role of the detected bacterial and archaeal species in biogenic methane formation at elevated pressure. The propionate conversion rate and subsequent methane production rate were inhibited by up to 90% by the accumulating pCO2 up to 0.5 MPa in the pressure reactor, which opens opportunities for steering carboxylate production using reversible CO2-toxicity in mixed-culture microbial electrosynthesis and fermentation.Graphical abstractThe role of pCO2 in steering product formation in autogenerative high pressure digestion.
Keywords: Autogenerative high-pressure digestion; CO2-toxicity; Carboxylate platform; Gibbs free energy; Population dynamics; Propionate accumulation; Syntrophy.
Figures


Similar articles
-
Direct and Indirect Effects of Increased CO2 Partial Pressure on the Bioenergetics of Syntrophic Propionate and Butyrate Conversion.Environ Sci Technol. 2020 Oct 6;54(19):12583-12592. doi: 10.1021/acs.est.0c02022. Epub 2020 Sep 11. Environ Sci Technol. 2020. PMID: 32845128 Free PMC article.
-
Directional Selection of Microbial Community Reduces Propionate Accumulation in Glycerol and Glucose Anaerobic Bioconversion Under Elevated pCO2.Front Microbiol. 2021 Jun 16;12:675763. doi: 10.3389/fmicb.2021.675763. eCollection 2021. Front Microbiol. 2021. PMID: 34220760 Free PMC article.
-
Upflow anaerobic sludge blanket reactor--a review.Indian J Environ Health. 2001 Apr;43(2):1-82. Indian J Environ Health. 2001. PMID: 12397675 Review.
-
Steering the product spectrum in high-pressure anaerobic processes: CO2 partial pressure as a novel tool in biorefinery concepts.Biotechnol Biofuels Bioprod. 2023 Feb 18;16(1):27. doi: 10.1186/s13068-023-02262-x. Biotechnol Biofuels Bioprod. 2023. PMID: 36803622 Free PMC article.
-
A Review of Biogenic Coalbed Methane Experimental Studies in China.Microorganisms. 2023 Jan 24;11(2):304. doi: 10.3390/microorganisms11020304. Microorganisms. 2023. PMID: 36838269 Free PMC article. Review.
Cited by
-
Direct and Indirect Effects of Increased CO2 Partial Pressure on the Bioenergetics of Syntrophic Propionate and Butyrate Conversion.Environ Sci Technol. 2020 Oct 6;54(19):12583-12592. doi: 10.1021/acs.est.0c02022. Epub 2020 Sep 11. Environ Sci Technol. 2020. PMID: 32845128 Free PMC article.
-
Heat-Treated Stainless Steel Felt as a New Cathode Material in a Methane-Producing Bioelectrochemical System.ACS Sustain Chem Eng. 2017 Dec 4;5(12):11346-11353. doi: 10.1021/acssuschemeng.7b02367. Epub 2017 Oct 12. ACS Sustain Chem Eng. 2017. PMID: 29226036 Free PMC article.
-
Modelling of autogenerative high-pressure anaerobic digestion in a batch reactor for the production of pressurised biogas.Biotechnol Biofuels Bioprod. 2022 Feb 18;15(1):20. doi: 10.1186/s13068-022-02117-x. Biotechnol Biofuels Bioprod. 2022. PMID: 35418101 Free PMC article.
-
The diversity of hydrogen-producing bacteria and methanogens within an in situ coal seam.Biotechnol Biofuels. 2018 Sep 8;11:245. doi: 10.1186/s13068-018-1237-2. eCollection 2018. Biotechnol Biofuels. 2018. PMID: 30202440 Free PMC article.
-
Syntrophic propionate-oxidizing bacteria in methanogenic systems.FEMS Microbiol Rev. 2022 Mar 3;46(2):fuab057. doi: 10.1093/femsre/fuab057. FEMS Microbiol Rev. 2022. PMID: 34875063 Free PMC article. Review.
References
-
- Collett TS. Energy resource potential of natural gas hydrates. Am Assoc Pet Geol Bull. 2002;86:1971–1992.
-
- Kinnaman TC. The economic impact of shale gas extraction: a review of existing studies. Ecol Econ. 2011;70:1243–1249. doi: 10.1016/j.ecolecon.2011.02.005. - DOI
-
- Strąpoć D, Mastalerz M, Dawson K, Macalady J, Callaghan AV, Wawrik B, Turich C, Ashby M. Biogeochemistry of microbial coal-bed methane. Annu Rev Earth Planet Sci. 2011;39:617–656. doi: 10.1146/annurev-earth-040610-133343. - DOI
-
- Wellinger A, Lindberg A. Biogas upgrading and utilisation. In: Bioenergy task 24: energy from biological conversion of organic waste. International Energy Agency; 2001. http://www.ieabioenergy.com.
-
- Rice DD, Claypool GE. Generation, accumulation, and resource potential of biogenic gas. AAPG Bull. 1981;65:5–25.
LinkOut - more resources
Full Text Sources
Other Literature Sources
