. 2016 Nov 9:7:13322.
doi: 10.1038/ncomms13322.

Vasculogenic mimicry in small cell lung cancer

Affiliations

Vasculogenic mimicry in small cell lung cancer

Stuart C Williamson et al. Nat Commun. .

Abstract

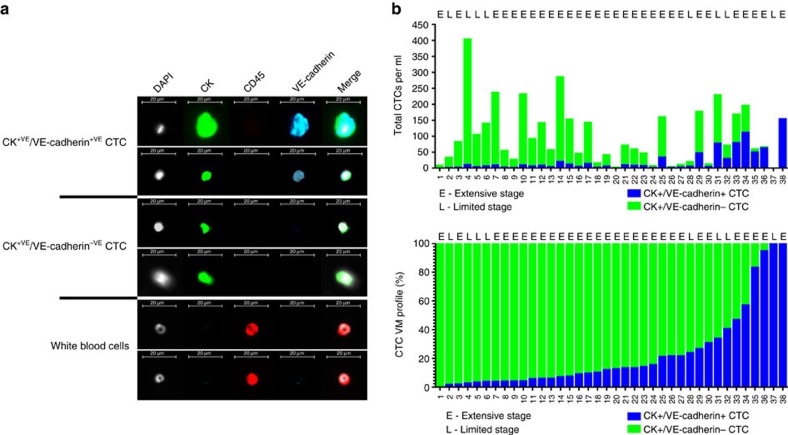
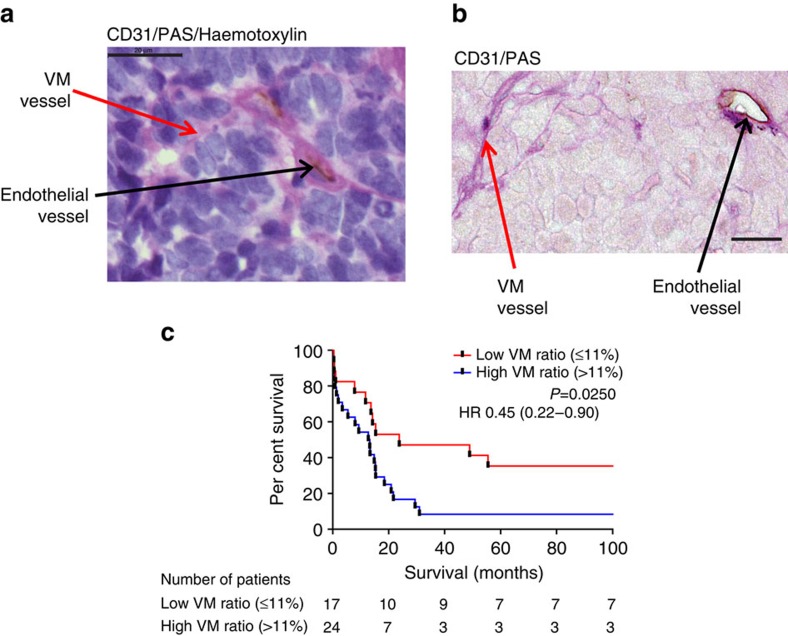
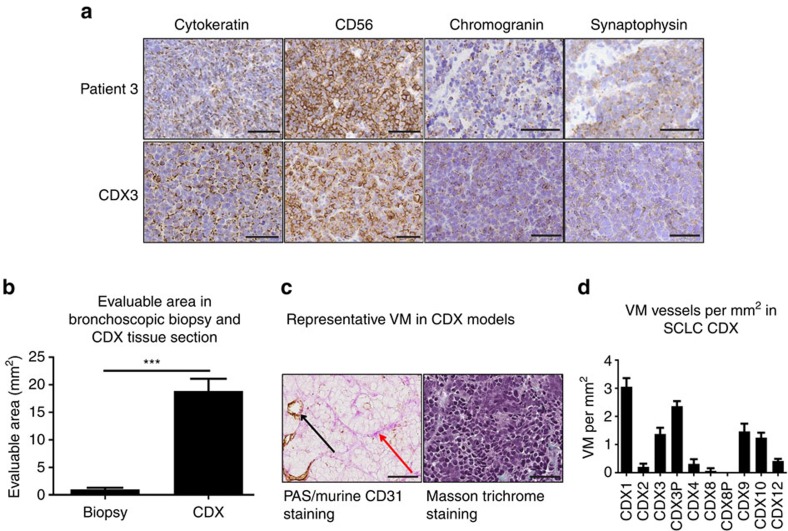
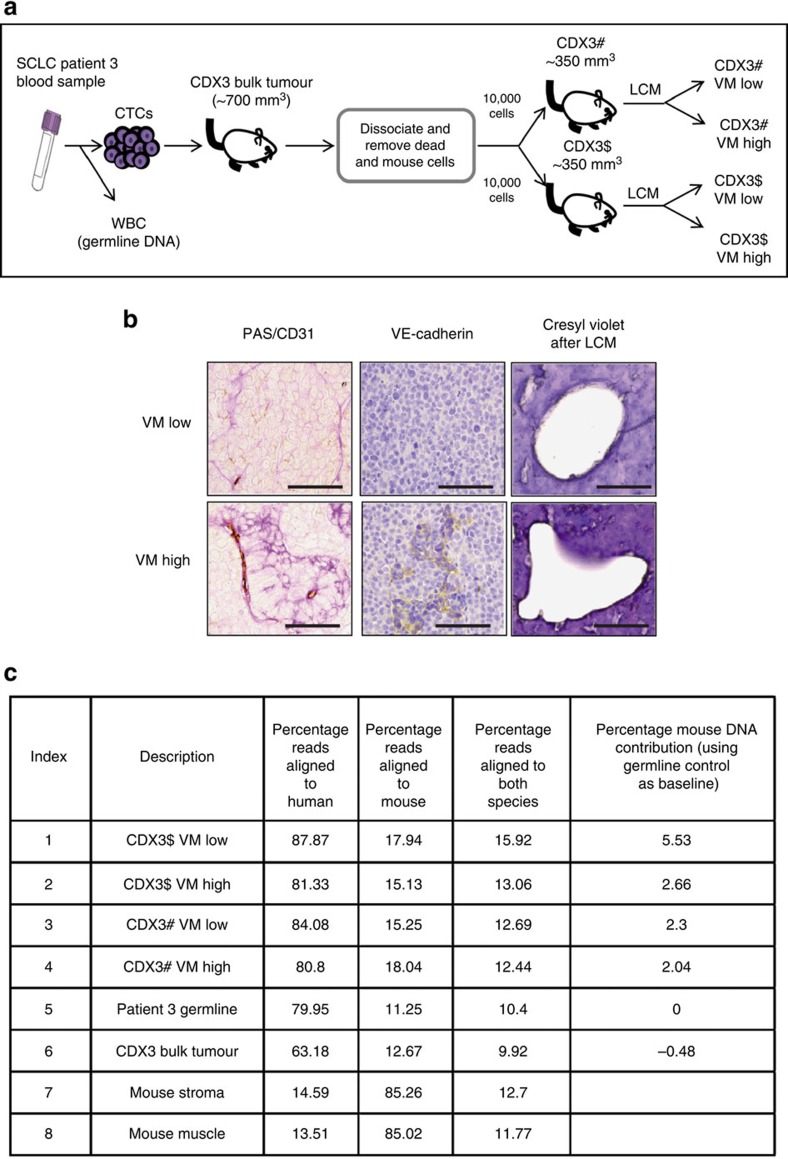
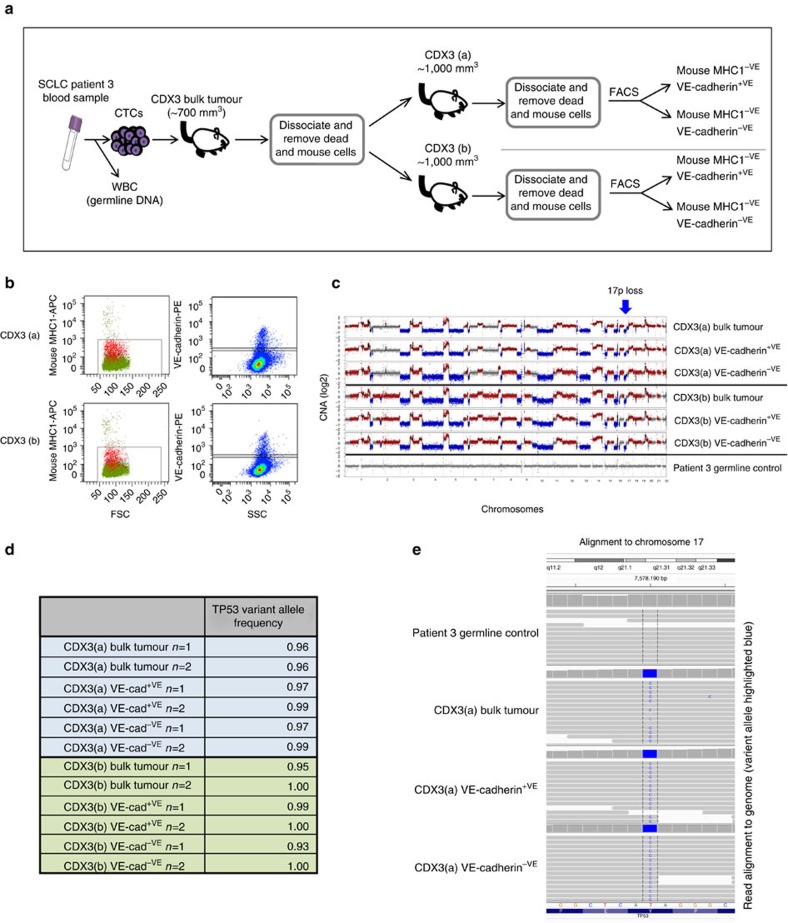
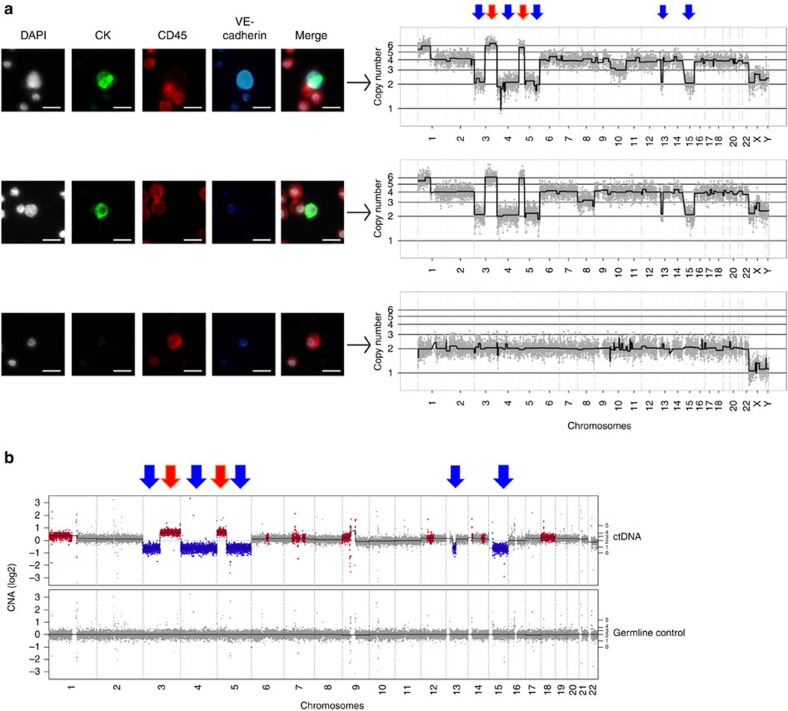
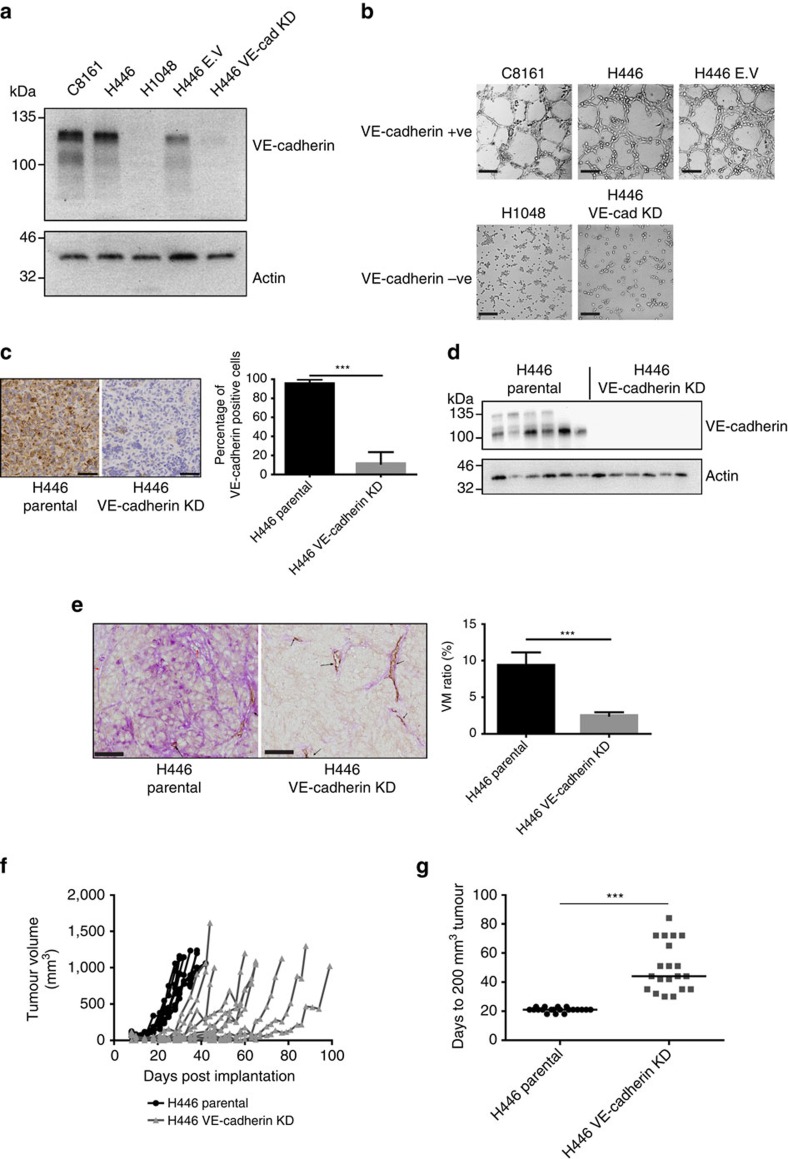
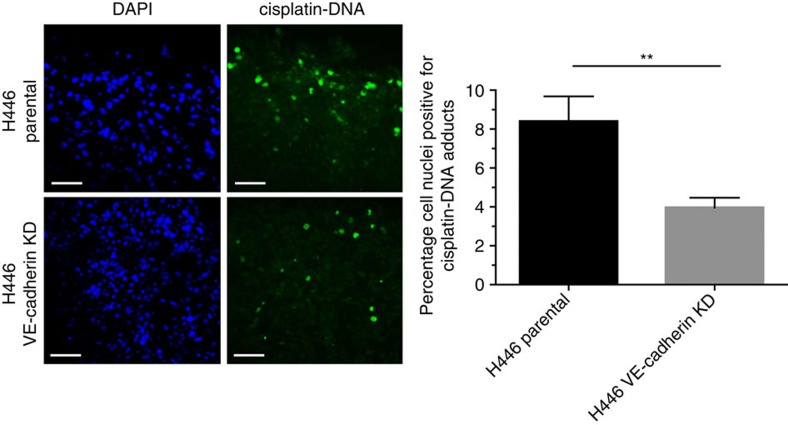
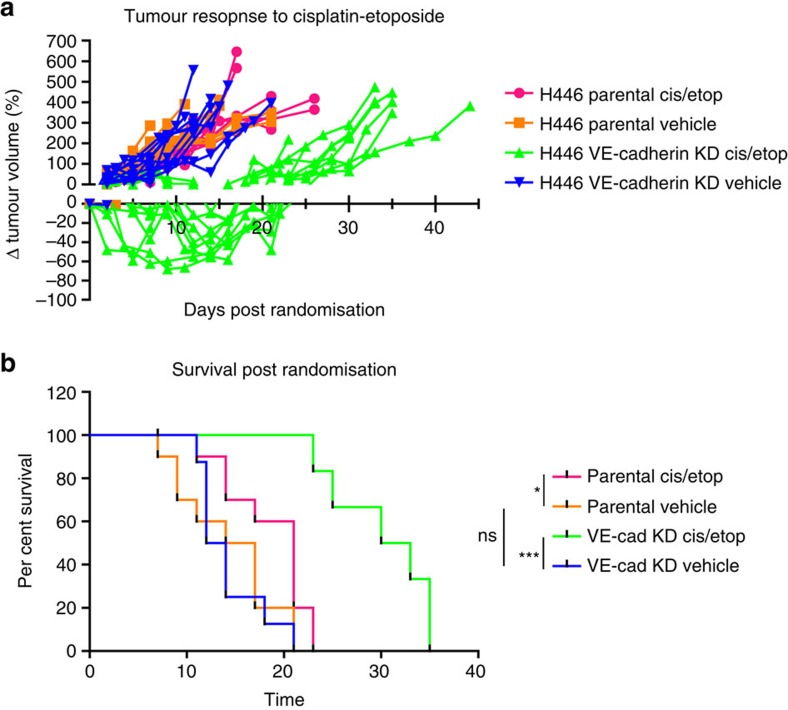
Small cell lung cancer (SCLC) is characterized by prevalent circulating tumour cells (CTCs), early metastasis and poor prognosis. We show that SCLC patients (37/38) have rare CTC subpopulations co-expressing vascular endothelial-cadherin (VE-cadherin) and cytokeratins consistent with vasculogenic mimicry (VM), a process whereby tumour cells form 'endothelial-like' vessels. Single-cell genomic analysis reveals characteristic SCLC genomic changes in both VE-cadherin-positive and -negative CTCs. Higher levels of VM are associated with worse overall survival in 41 limited-stage patients' biopsies (P<0.025). VM vessels are also observed in 9/10 CTC patient-derived explants (CDX), where molecular analysis of fractionated VE-cadherin-positive cells uncovered copy-number alterations and mutated TP53, confirming human tumour origin. VE-cadherin is required for VM in NCI-H446 SCLC xenografts, where VM decreases tumour latency and, despite increased cisplatin intra-tumour delivery, decreases cisplatin efficacy. The functional significance of VM in SCLC suggests VM regulation may provide new targets for therapeutic intervention.


Conflict of interest statement

P.K. and J.H. have ownership interest in Epic Sciences, who licensed the HD-CTC technology. The remaining authors declare no competing intersests.

Figures

Figure 1
Figure 1. ISET-filtered CTCs from patients with either LS or ES SCLC co-express VE-cadherin and CKs.
(a) Pseudo-coloured ISET filters stained with DAPI (white) and antibodies to pan-CK (green), CD45 (red) and VE-cadherin (blue). CTCs are classified as DAPI+VE/CD45−VE/CK+VE. Scale bar, 20 μm. (b) Top panel, total CTC counts per ml for CK+VE/VE-cadherin+VE CTCs (blue bars) versus CK+VE/VE-cadherin−VE CTCs (green bars) are shown for patients 1 to 38. (b) Bottom panel, the percentage of CK+VE/VE-cadherin+VE CTCs (blue bars) versus CK+VE/VE-cadherin−VE CTCs (green bars) is shown for patients 1–38.
Figure 2
Figure 2. Vasculogenic Mimicry in metastatic lymph nodes from LS SCLC patients and associated patient overall survival.
One-milimetre cores taken during lymph node resection were stained with anti-human anti-CD31 (brown), periodic acid schiff (PAS; pink) with or without haematoxylin (purple). (a) Region showing typical malignant morphology of the SCLC; PAS+VE/CD31+VE blood vessels (black arrow) and PAS+VE/CD31−VE VM vessels (red arrow; × 100 magnification). (b) Loops and whorls characteristic of VM via light microscopy ( × 63 magnification), demonstrating PAS+VE/CD31+VE blood vessels (black arrow) and PAS+VE/CD31−VE VM vessels (red arrow). (c). Univariate survival analysis according to VM score in LS SCLC. Kaplan–Meier survival analysis for patients dichotomised by VM ratio (percentage of VM vessels/total vessels) into high (n=24) and low (n=17) VM using a threshold of 11% based on ROC curve analysis. Scale bars, 20 μm, all images are representative.
Figure 3
Figure 3. Vasculogenic mimicry in SCLC CDX tumours.
(a). IHC of CK and SCLC neuroendocrine markers CD56, synaptophysin and chromogranin of a matched patient biopsy and CDX tumour. Scale bar, 50 μm. (b) Mean evaluable tumour area (mm2) in sections from n=24 patient bronchoscopic biopsies and n=10 CDX tumours (***P<0.0001, two-tailed t-test. (c) Left panel depicts PAS+VE/CD31+VE endothelial vessels (black arrow) and PAS+VE/CD31−VE VM vessels (red arrow) in a representative SCLC CDX tumour. Right panel depicts Masson trichrome staining of the same region demonstrating lack of mouse stromal contamination. Scale bar, 50 μm. (d) VM vessels per mm2 of tissue in CDX tumours derived from CTCs enriched from SCLC patients (P denotes a CDX tumour derived from a progression blood sample matched to a baseline patient sample, for example, CDX3 and CDX3P are both derived from patient 3 at presentation and progression, respectively). Error bars show s.e.m.
Figure 4
Figure 4. LCM and genomic analysis of VE-cadherin-positive VM vessels in CDX.
(a) Schematic representation of generation of CDX3 and subsequent samples used for VM analysis, genomic analysis and targeted sequencing of LCM regions. White blood cells (WBC) used to generate germline control DNA. (b) IHC staining for PAS/CD31, VE-cadherin and (non DNA damaging) Cresyl Violet with VM-low/-high LCM area from CDX3 tumour. Scale bar, 100 μm. (c) Sequencing data from the 8 different samples used for genomic analysis demonstrating minimal mouse cell contamination and predominantly human genomes in VM structures in vivo. All reads were aligned to both human and mouse genome separately.
Figure 5
Figure 5. FACS and genomic analysis of VE-cadherin-positive CDX tumour cells.
(a) Schematic representing generation of CDX3 and subsequent processing of samples for FACS of human (Mouse MHC1−VE) subpopulations based on VE-cadherin+VE and VE-cadherin−VE expression. (b) Flow Cytometry dot plots showing gating strategies used for cell sorting. Left panels, forward light scatter versus anti-mouse anti-MHC1 staining. Right panels, side light scatter versus anti-human, anti-VE-cadherin staining. Gating strategies set according to relevant controls (see the ‘Methods' section). (c) CNA profiles from mice bearing CDX3 tumours (CDX3(a) and CDX3(b)) FACS-sorted mouse MHC−VE, bulk tumour/VE-cadherin+VE/VE-cadherin−VE and patient 3 germline control (white blood cells). The GC-normalized and mappability corrected read counts (log2 scale) were segmented using Hidden Markov Model (HMM), red=copy-number gains, blue=copy-number losses. (d) VAF of TP53 (p.Y220C) mutation in sorted cell subpopulations. (e) Read alignment plots from representative samples demonstrate the presence of variant TP53 allele (p.Y220C) in bulk tumour, VE-cadherin+VE and VE-cadherin−VE fractions, but absent in germline patient control.
Figure 6
Figure 6. Single-cell CNA analysis of VE-cadherin-negative and -positive CTCs from an ES SCLC patient.
(a) CTCs identified using the HD-SCA assay: cells were stained with DAPI (white) and antibodies to CKs (green), CD45 (red) and VE-cadherin (blue) and pseudo-coloured. Top panel, DAPI+VE/CD45−VE/CK+VE/VE-cadherin+VE CTC; middle panel, DAPI+VE/CD45−VE/CK+VE/VE-cadherin−VE CTC; bottom panel, DAPI+VE/CD45+VE/CK−VE/VE-cadherin−VE white blood cell (WBC). Arrows link to the respective CNA analysis of the indicated cell, showing loss of 3p, gain of 5p including TERT and hemizygous loss of RB1 on 13 in CTC. Major chromosome losses (blue arrow) and gains (red arrow) highlighted above. The selected WBC in contrast has a characteristic flat CNA profile indicative of healthy somatic cells. Representative images and profiles are shown. Scaled × 10 images from the scanner are shown for CD45, while remaining images were acquired at × 40. Scale bar, 10 μm. (b) CNA analysis of matched patient ctDNA: the GC-normalized and mappability corrected read counts (log2 scale) were segmented using Hidden Markov Model (HMM), red=copy-number gains, blue=copy-number losses. Major chromosome losses (blue arrow) and gains (red arrow) highlighted above and match pattern identified by single CTC CNA.
Figure 7
Figure 7. Functional significance of VE-cadherin expression for SCLC VM in vitro and in vivo.
(a) Western blot analysis of VE-cadherin expression levels in VM proficient C8161 melanoma cells and H446, H446 non-silencing empty vector controls, H446 VE-cadherin shRNA knockdown and H1048 SCLC cells. (b) VM-like network formation on matrigel for VE-cadherin+VE cells (C8161, H446 and H446 E.V) and VE-cadherin−VE cells (H1048 and H446 VE-cadherin KD) lacking network formation. Representative images are shown for n>3 experiments. Scale bar, 200 μm. (c) Left panel, representative images of anti-human anti-VE-cadherin staining in H446 parental and H446 VE-cadherin KD xenografts. Scale bar, 50 μm. (c) Right panel percentage of cells positive for VE-cadherin in H446 and H446 VE-cadherin KD xenografts (***P=0.0001, two-tailed t-test), n=10 animals per group. (d) Western blot analysis VE-cadherin expression in H446 and H446 VE-cadherin KD xenografts (n=6 tumours for each group). (e) Left panel, representative images of anti-mouse anti-CD31/PAS staining in H446 Parental and H446 VE-cadherin KD tumours. Scale bars, 50 μm. (e) Right panel VM ratio in H446 parental (n=10) and H446 VE-cadherin KD xenografts (n=8; ***P=0.0005, two-tailed Mann–Whitney's test). (f) Tumour growth rates in H446 (black) and H446 VE-cadherin KD (grey) tumours (n=10 animals per group). (g) Days to 200 mm3 volume tumours in H446 and H446 VE-cadherin xenografts KD (n=20 animals per group, (***P<0.0001, two-tailed t-test). Error bars show s.e.m.
Figure 8
Figure 8. Cisplatin delivery in H446 and H446 VE-cadherin KD xenografts.
Left panel, immunofluorescence assay for cisplatin–DNA adduct formation in nuclei of H446 and H446 VE-cadherin KD xenografts 1 h after dosing. Scale bar, 50 μm. Right panel, percentage of nuclei positive for cisplatin–DNA adducts in H446 and H446 VE-cadherin KD xenografts (n=15 tumours per group (**P=0.0052, two-tailed Mann–Whitney's test)). Error bars show s.e.m.
Figure 9
Figure 9. Efficacy of cisplatin-etoposide treatment in H446 and H446 VE-cadherin KD xenografts.
(a) Tumour response measured post randomization as a percentage tumour volume change relative to size at randomization (n=10 tumour-bearing animals per group). (b) Univariate survival analysis following cisplatin/etoposide treatment in H446 parental and H446 VE-cadherin KD xenografts. Kaplan–Meier survival analysis for tumours treated with vehicle or cisplatin/etoposide (n=10 animals per group (ns=non-significant, *P=0.03, ***P=0.0003, Mantel–Cox test)).

References

    1. Herbst R. S., Heymach J. V. & Lippman S. M. Lung cancer. N. Engl. J. Med. 359, 1367–1380 (2008). - PMC - PubMed
    1. Travis W. D., Travis L. B. & Devesa S. S. Lung cancer. Cancer 75, 191–202 (1995). - PubMed
    1. Pelayo Alvarez M., Gallego Rubio O., Bonfill Cosp X. & Agra Varela Y. Chemotherapy versus best supportive care for extensive small cell lung cancer. Cochrane Database Syst Rev. 2009, CD001990 doi:10.1002/14651858.CD001990.pub2 (2009). - PubMed
    1. Morabito A. et al. Treatment of small cell lung cancer. Crit. Rev. Oncol. Hematol. 91, 257–270 (2014). - PubMed
    1. Chute J. P., Chen T., Feigal E., Simon R. & Johnson B. E. Twenty years of phase III trials for patients with extensive-stage small-cell lung cancer: perceptible progress. J. Clin. Oncol. 17, 1794–1801 (1999). - PubMed

Publication types

MeSH terms