. 2017 Apr;42(5):1070-1081.
doi: 10.1038/npp.2016.251. Epub 2016 Nov 9.

Ethanol-Sensitive Pacemaker Neurons in the Mouse External Globus Pallidus

Affiliations

Ethanol-Sensitive Pacemaker Neurons in the Mouse External Globus Pallidus

Karina P Abrahao et al. Neuropsychopharmacology. 2017 Apr.

Abstract

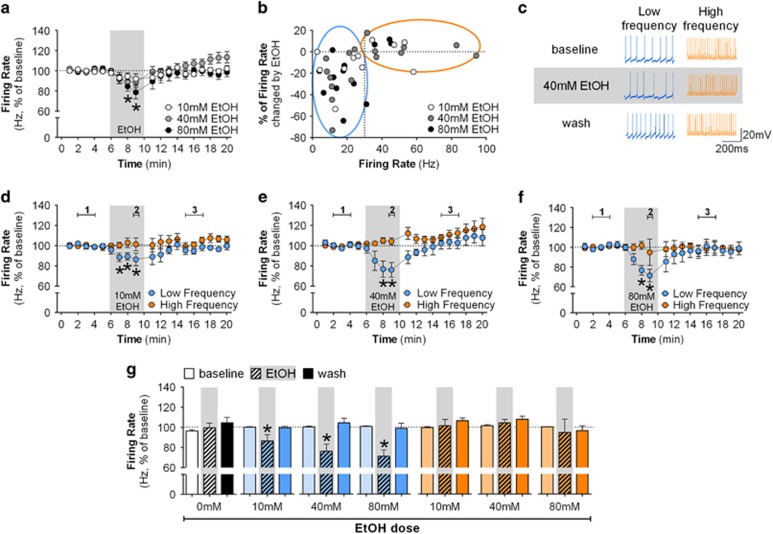
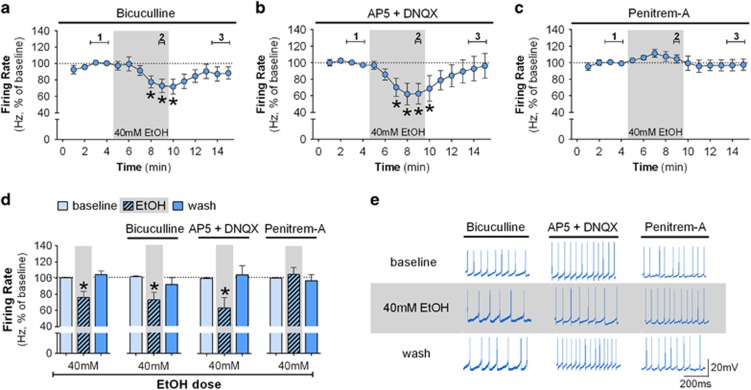
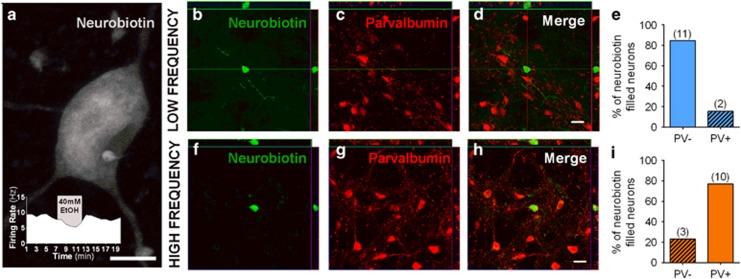
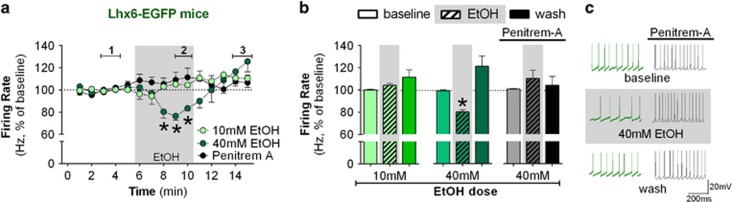
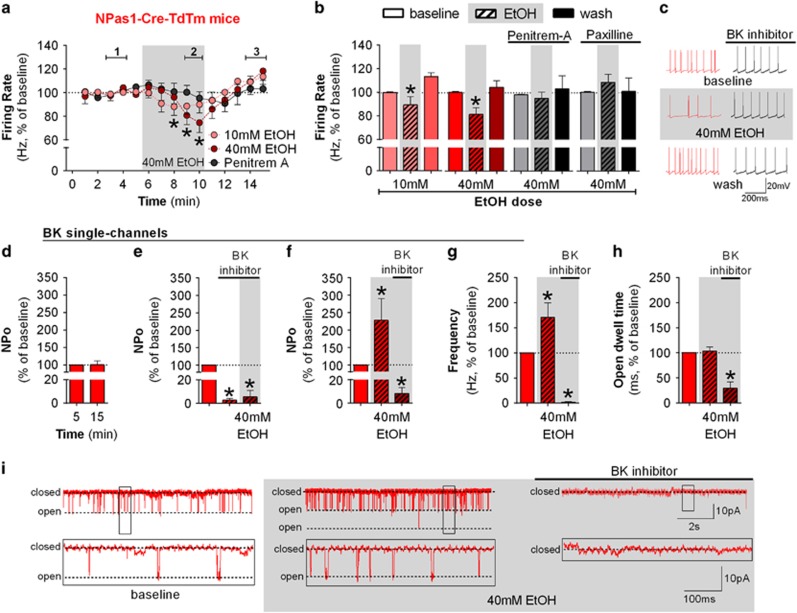
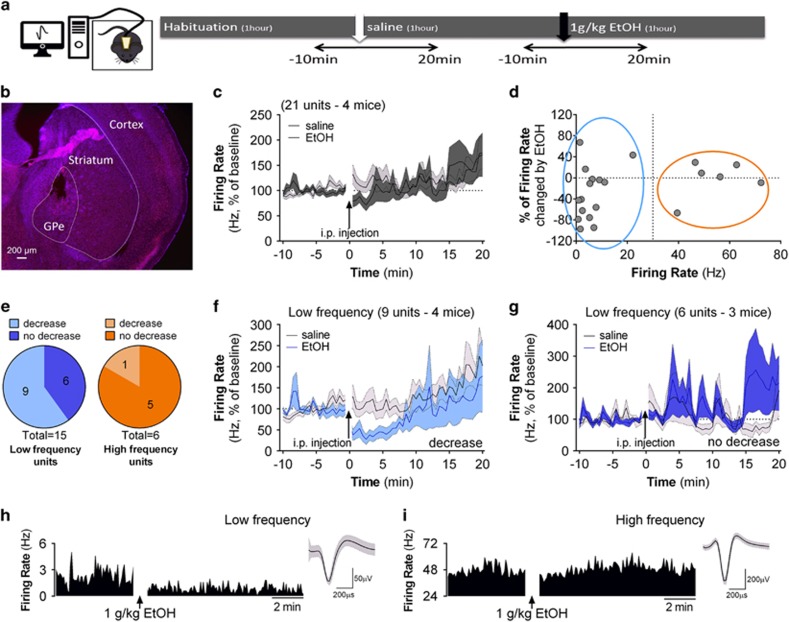
Although ethanol is one of the most widely used drugs, we still lack a full understanding of which neuronal subtypes are affected by this drug. Pacemaker neurons exert powerful control over brain circuit function, but little is known about ethanol effects on these types of neurons. Neurons in the external globus pallidus (GPe) generate pacemaker activity that controls basal ganglia, circuitry associated with habitual and compulsive drug use. We performed patch-clamp recordings from GPe neurons and found that bath application of ethanol dose-dependently decreased the firing rate of low-frequency GPe neurons, but did not alter the firing of high-frequency neurons. GABA or glutamate receptor antagonists did not block the ethanol effect. The GPe is comprised of a heterogeneous population of neurons. We used Lhx6-EGFP and Npas1-tdTm mice strains to identify low-frequency neurons. Lhx6 and Npas1 neurons exhibited decreased firing with ethanol, but only Npas1 neurons were sensitive to 10 mM ethanol. Large-conductance voltage and Ca2+-activated K+ (BK) channel have a key role in the ethanol effect on GPe neurons, as the application of BK channel inhibitors blocked the ethanol-induced firing decrease. Ethanol also increased BK channel open probability measured in single-channel recordings from Npas1-tdTm neurons. In addition, in vivo electrophysiological recordings from GPe showed that ethanol decreased the firing of a large subset of low-frequency neurons. These findings indicate how selectivity of ethanol effects on pacemaker neurons can occur, and enhance our understanding of the mechanisms contributing to acute ethanol effects on the basal ganglia.


Figures

Figure 1
Figure 1
Ethanol decreases the firing rate of GPe low-frequency neurons in vitro. (a) Time-course graph of the firing rate of all GPe neurons recorded before, during, and after bath application of 10 mM ethanol (n=11 neurons from 8 mice), 40 mM ethanol (n=16 neurons from 10 mice, F(18,270)=3.45, p<0.05, post hoc test indicates lower firing rate in minutes 8–9 when compared with minutes 1–2), or 80 mM ethanol (n=13 neurons from 7 mice, F(18,216)=2.88, p<0.05, post hoc test indicates lower firing rate in minutes 8–9 when compared with minutes 1–5). Bath application of 40 and 80 mM ethanol slightly decreased the firing rate of GPe neurons (*p<0.05, different from baseline and washout time points). (b) Scatterplot of the percent change in firing rate induced by 10, 40, and 80 mM ethanol versus the baseline firing rate of individual neurons. Low-frequency neurons are circled in blue (<30 Hz) and high frequency in orange (>30 Hz). Note that ethanol decreased the firing rate of low-frequency neurons but not high-frequency neurons. (c) Representative traces of low- and high-frequency neurons during baseline, 40 mM ethanol and washout. (d–f) Time course of firing rate of low-frequency (blue circles) and high-frequency neurons (orange circles) during the application of 10 mM ethanol (low frequency: n=7 neurons from 7 mice, F(18,108)=1.81, *p<0.05, post hoc test indicates lower firing rate in minutes 7–9 when compared with minutes 1–5 and minutes 14 and 20; high frequency: n=4 neurons from 4 mice: F(18,54)=1.18), 40 mM ethanol (low frequency: n=9 neurons from 7 mice, F(18,144)=2.71, *p<0.05, post hoc test indicates lower firing rate in minutes 8–9 when compared with minutes 1–5 and 12–20; high frequency: n=7 neurons from five mice, F(18,108)=2.83, p<0.05, post hoc test indicates higher firing rate in minutes 17–20 when compared with minutes 1–5), and 80 mM ethanol (low frequency: n=9 neurons from six mice, F(18,144)=3.43, *p<0.05, post hoc test indicates lower firing rate in minutes 8–9 when compared with minutes 1–5 and minutes 12–20; high frequency: n=4 neurons from 4 mice, F(18,54)=0.52), respectively. Note that application of ethanol decreases the firing of low-frequency neurons (*p<0.05, different from baseline and washout). The fifth data point during ethanol application is missing because that minute was used for a current step protocol experiment (Supplementary Figure S1). (g) Summary bar graph of firing rate of GPe neurons during baseline, ethanol, and washout calculated as average from time segments 1, 2, and 3 indicated in time-course graphs. Ethanol was able to induce a dose-dependent decrease of the firing rate of low-frequency neurons, but did not change the firing rate of high-frequency neurons even at the highest dose. Firing rate in time courses and bar graphs are represented as percentage of baseline levels. All error bars represent SEM.
Figure 2
Figure 2
BK channels rather than GABA or glutamatergic synaptic input are necessary for the ethanol-induced decrease in firing. (a) Time course of firing rate of low-frequency GPe neurons (n=9 neurons from 5 mice) in the presence of 20 μM bicuculline (GABAA antagonist; F(14,112)=2.37; *p<0.05, post hoc test indicates lower firing rate in minutes 8–10 when compared with minutes 2–4). Inclusion of bicuculline does not eliminate the ethanol-induced decrease in the firing rate (*p<0.05). (b) Time course of firing rate of low-frequency neurons (n=7 neurons from 5 mice) in the presence of 50 μM AP5 and 10 μM DNQX (glutamatergic NMDA and AMPA antagonists, respectively; F(14,84)=2.57; *p<0.05, post hoc test indicates lower firing rate in minutes 7–10 when compared with minutes 1–5). Glutamatergic antagonists did not alter the ethanol-induced decrease in firing rate of low-frequency neurons (*p<0.05). (c) Time course of firing rate of low-frequency neurons (n=11 neurons from 7 mice) in the presence of a BK channel inhibitor, 500 nM penitrem-A (F(14,140)=1.12). BK channel inhibition blocks the ethanol-induced decrease in firing of low-frequency neurons. (d) Summary bar graph of low-frequency neurons during baseline, ethanol, and washout calculated as average from time segments 1, 2, and 3 indicated in time-course graphs *p<0.05. (e) Representative traces of low-frequency neurons during baseline, 40 mM ethanol, and washout in the presence of bicuculline, AP5+DNQX, or penitrem-A. Firing rate in time courses and bar graphs are represented as percentage of the baseline levels. All error bars represent SEM.
Figure 3
Figure 3
The majority of GPe low-frequency ethanol-sensitive neurons do not express parvalbumin. Neurons were filled with neurobiotin during recordings for post hoc analysis. (a) Example of a filled ethanol-sensitive neuron. Scale bar, 10 μm. Inset shows the firing rate and ethanol effect on this specific neuron. Thirteen low-frequency and 13 high-frequency neurons were recovered for confocal imaging. (b–d) Confocal and orthogonal sections of a low-frequency ethanol-sensitive neuron showing no co-localization of neurobiotin (green) and PV staining (red). (e) Bar graph showing the percentage of all labeled low-frequency neurons that express (~15%, n=2) or not (~85%, n=11) the PV protein. (f–h) Confocal and orthogonal sections of a high-frequency neuron showing co-localization of neurobiotin (green) and PV staining (red). (i) Bar graph showing the percentage of all labeled high-frequency neurons that express (~77%, n=10) or not (~23%, n=3) the PV protein. Scale bars, 20 μm.
Figure 4
Figure 4
Lhx6 marks a subpopulation of ethanol-sensitive neurons in the GPe. (a) Time course of firing rate of Lhx6-positive neurons during the application of 10 mM ethanol (n=6 neurons from 5 mice, F(14,70)=2.29, p<0.05, post hoc test indicates no difference between minutes 8 and10 when compared with minutes 1–5), 40 mM ethanol (n=8 neurons from 5 mice, F(14,98)=5.63, p<0.05, post hoc test indicates lower firing rate in minutes 8–10 when compared with minutes 1–5), and 40 mM ethanol in the presence of 500 nM penitrem-A (BK channel inhibitor, n=5 neurons from 2 mice, F(14,56)=1.11). Application of 40 mM ethanol decreased the firing rate of Lhx6-positive neurons (*p<0.05). (b) Summary bar graph of low-frequency neurons during baseline, ethanol, and washout calculated as average from time segments 1, 2, and 3 indicated in time-course graph. Lhx6 neurons are sensitive to 40 mM ethanol (*p<0.05) but not 10 mM. Inclusion of the BK channel blocker eliminated the ethanol-induced decrease in firing rate of Lhx6-positive neurons. (c) Representative traces of Lhx6 neurons during baseline, 40 mM ethanol, and washout. Firing rate in time courses and bar graphs are represented as percentage of the baseline levels. All error bars represent SEM.
Figure 5
Figure 5
Npas1 marks a subpopulation of ethanol-sensitive neurons in the GPe which express ethanol-sensitive BK channels. (a) Time course of firing rate of Npas1-Cre-TdTm-positive neurons during the application of 10 mM ethanol (n=6 neurons from 6 mice, F(14,70)=3.70, p<0.05, post hoc test indicates lower firing rate in minutes 8–9 when compared with minutes 1–2 and 4–5), 40 mM ethanol (n=5 neurons from 6 mice, F(14,70)=2.41, p<0.05, post hoc test indicates lower firing rate in minutes 9–10 when compared with minutes 2–4), and 40 mM ethanol in the presence of 500 nM penitrem-A (BK channel blocker, n=5 neurons from 3 mice, F(14,56)=9.82). Application of 40 mM ethanol decreased the firing rate of Npas1-positive neurons (*p<0.05). (b) Summary bar graph of Npas1 neurons during baseline, ethanol, and washout calculated as average from time segments 1, 2, and 3 indicated in time-course graph. Ethanol dose-dependently decreased the firing rate of Npas1 neurons in GPe (*p<0.05). Either 500 nM penitrem-A or 1 μM paxilline (another BK channel inhibitor, n=6 neurons from 4 mice) blocked the ethanol effect. (c) Representative traces of Npas1 neurons during baseline, 40 mM ethanol, and washout. Firing rate in time courses and bar graphs are represented as percentage of the baseline levels. (d) Single-channel recordings in a Giga-seal cell-attached configuration are stable for 5–20 min as the open probability (NPo) did not change over time (n=5 patches from 5 mice). (e) Graphs showing NPo values before and during bath application of 3 uM penitrem-A or paxilline and the subsequenct addition of 40 mM EtOH. The BK inhibitors significantly decreased NPo (n=5 patches from 4 mice; *p<0.05), and in this condition ethanol had no effect (n=4 patches from 3 mice). (f) Graph showing BK channel NPo before and during bath application of 40 mM ethanol followed by the application of 3 μM penitrem-A or paxilline. Application of 40 mM ethanol increased NPo (n=6 patches of 5 mice; *p<0.05), which was then inhibited by subsequent application of the BK inhibitor (n=6 patches of 4 mice; *p<0.05). (g) Graph showing the frequency of opening transitions before and during bath application of 40mM ethanol followed by the application of 3μM penitrem-A or paxilline. The increase in NPo induced by ethanol is driven by an increase in the frequency of opening transitions of BK channels. (h) Graph showing open dwell time before and during bath application of 40mM ethanol followed by the application of 3μM penitrem-A or paxilline. No change in dwell time of BK channel was observed after ethanol application. (i) Example traces showing single-channel recordings. Trace in the bottom of the panel is expanded on the time and current axes relative to those above. All error bars represent SEM.
Figure 6
Figure 6
Ethanol decreases the firing rate of a subpopulation of GPe low-frequency neurons in vivo. (a) Experimental design for single unit in vivo recording in freely moving mice. Saline and ethanol administration was counterbalanced to avoid order effects. (b) Representative image of a section of GPe showing the location of the electrodes. (c) Time course of firing rate of all single units recorded from four mice, before and after saline or 1 g/kg ethanol i.p. administration. (d) Scatterplot of the percent change in firing rate for all single units induced by ethanol compared with saline injections and the baseline firing rate (calculated as the average firing during the 1-h habituation). Color-coded marks show neurons classified as low frequency in blue (<30 Hz) and high frequency in orange (>30 Hz). Note that ethanol decreased the firing rate of a subpopulation of low-frequency units but did not decrease the firing rate of the majority of high-frequency units. (e) Among the units classified as high-frequency (in orange), only one exhibited a decrease in firing rate >10% following ethanol administration in comparison with the saline condition. Among the units classified as low-frequency, 9 (60%) showed an ethanol-induced decrease in firing rate of >10%. (f) Time course of firing rate of low-frequency single units that were decreased by ethanol. (g) Time course of firing rate of low-frequency single units that did not show an ethanol-induced decrease in firing rate. (h) Histogram showing firing rate during 5 min of baseline and 10 min after ethanol i.p. administration of an ethanol-sensitive low-frequency unit and trace example. (i) Histogram showing firing rate during 5 min baseline and 10 min after ethanol i.p. administration of a typical high-frequency unit and trace example.

References

    1. Abdi A, Mallet N, Mohamed FY, Sharott A, Dodson PD, Nakamura KC et al (2015). Prototypic and arkypallidal neurons in the dopamine-intact external globus pallidus. J Neurosci 35: 6667–6688. - PMC - PubMed
    1. Adler A, Katabi S, Finkes I, Israel Z, Prut Y, Bergman H (2012). Temporal convergence of dynamic cell assemblies in the striato-pallidal network. J Neurosci 32: 2473–2484. - PMC - PubMed
    1. Albin RL, Young AB, Penney JB (1989). The functional anatomy of basal ganglia disorders. Trends Neurosci 12: 366–375. - PubMed
    1. Arkadir D, Morris G, Vaadia E, Bergman H (2004). Independent coding of movement direction and reward prediction by single pallidal neurons. J Neurosci 24: 10047–10056. - PMC - PubMed
    1. Bettinger JC, Davies AG (2014). The role of the BK channel in ethanol response behaviors: evidence from model organism and human studies. Front Physiol 5: 346. - PMC - PubMed

Substances

LinkOut - more resources