. 2016 Nov 9:6:36539.
doi: 10.1038/srep36539.

FANCD2 functions as a critical factor downstream of MiTF to maintain the proliferation and survival of melanoma cells

Affiliations

FANCD2 functions as a critical factor downstream of MiTF to maintain the proliferation and survival of melanoma cells

Julie Bourseguin et al. Sci Rep. .

Abstract

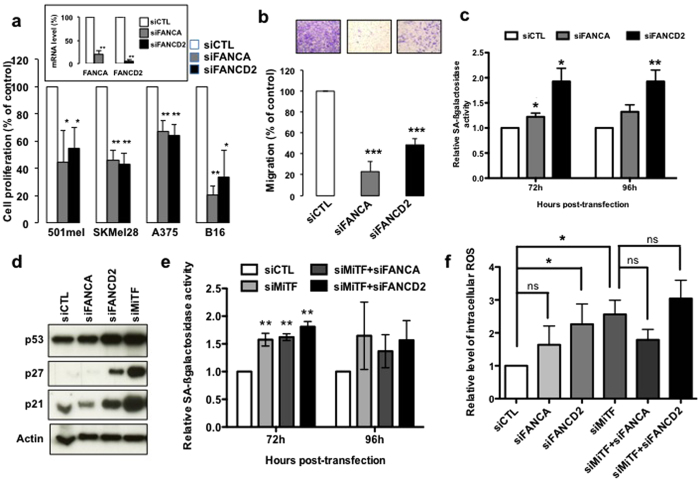
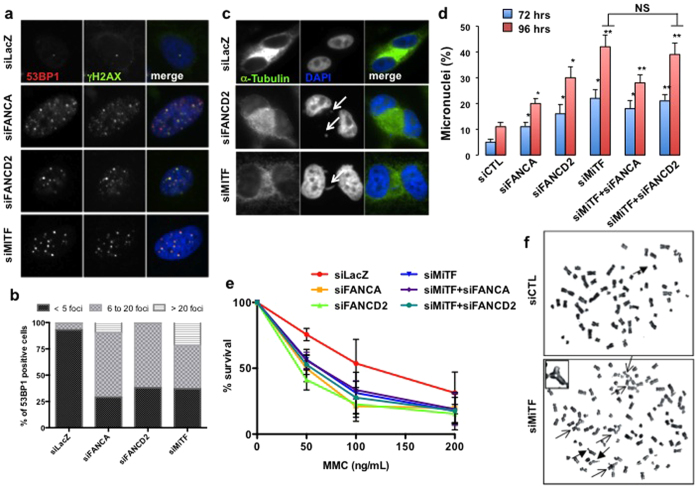
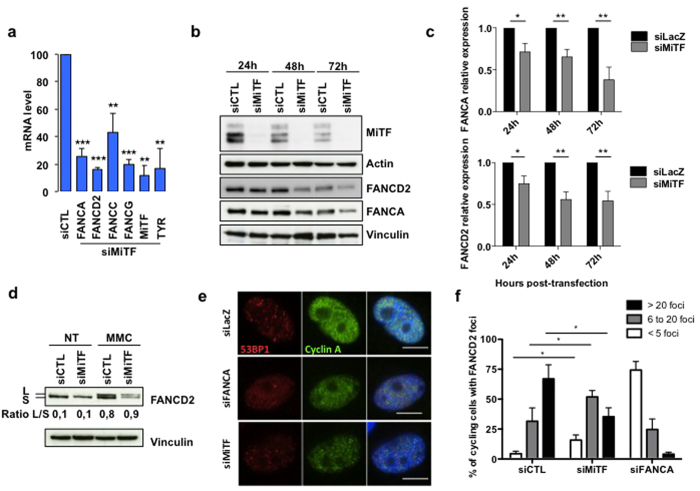
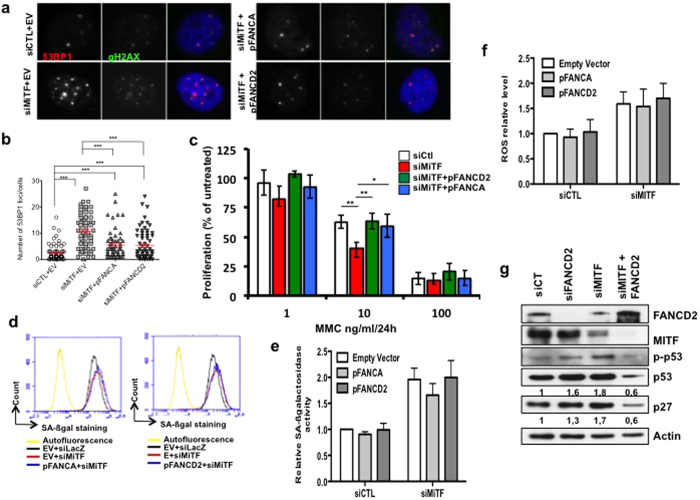
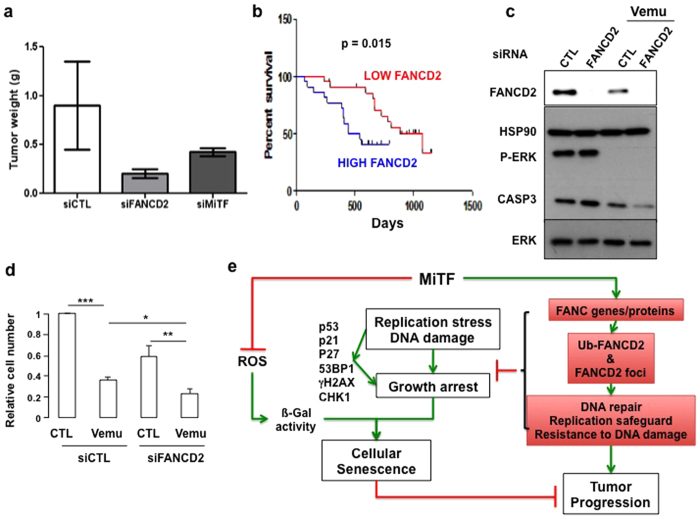
Proteins involved in genetic stability maintenance and safeguarding DNA replication act not only against cancer initiation but could also play a major role in sustaining cancer progression. Here, we report that the FANC pathway is highly expressed in metastatic melanoma harboring the oncogenic microphthalmia-associated transcription factor (MiTF). We show that MiTF downregulation in melanoma cells lowers the expression of several FANC genes and proteins. Moreover, we observe that, similarly to the consequence of MiTF downregulation, FANC pathway silencing alters proliferation, migration and senescence of human melanoma cells. We demonstrate that the FANC pathway acts downstream MiTF and establish the existence of an epistatic relationship between MiTF and the FANC pathway. Our findings point to a central role of the FANC pathway in cellular and chromosomal resistance to both DNA damage and targeted therapies in melanoma cells. Thus, the FANC pathway is a promising new therapeutic target in melanoma treatment.


Figures

Figure 1
Figure 1
(a) Cell proliferation analysis as evaluated 4 days after transfection of the indicated human melanoma cell lines with control (CTL), FANCA or FANCD2 siRNA. The efficiency of the siRNA transfection in 501 mel melanoma cells is reported in the inset. The data are the means of 3 independent experiments. The error bars indicate S.D., ** and * indicate a statistically significant difference of p < 0.01 and p < 0.05, respectively. (b) Cell migration was assessed using a Boyden chamber assay. 501 mel cells were seeded on the upper trans-well chamber, and complete DMEM was added to those in the lower chamber. The cells that had adhered to the underside of the filters were fixed with 4% PFA, stained with 0.4% crystal violet and 3 random fields were counted at 20x magnification using the NIH-ImageJ analysis software. The values represent the means + S.D. of three independent experiments; *** indicate a statistically significant difference of p < 0.001. Representative images are shown. (c) SA-βGal relative activity evaluated via FACS analysis 72 or 96 h after transfection with the indicated siRNA in 501 mel melanoma cells. The data are the means of 3 independent experiments. The error bars indicate S.D. Statistical analysis was performed using Student’s T test, * indicates p < 0.05 and ** indicates p < 0.01. (d) Immunoblot showing the effects of FANCA, FANCD2 or MiTF silencing in 501 mel melanoma cells 96 h after siRNA transfection. The expression of p53, p21 and p27 was assessed. Actin expression was used as the loading control. (e) SA-βGal relative activity evaluated via FACS analysis 72 or 96 h after transfection with the indicated siRNA in 501 mel melanoma cells. The data are the means of 3 independent experiments. Statistical analysis was performed using Student’s T test. ** indicates p < 0.01 in relation to siCTL transfected cells. (f) Relative intracellular reactive oxygen species (ROS) measured with the DCF-DA probe via flow cytometry in 501 mel cells 96 h after transfection with the indicated siRNA. The data are the means of 3 independent experiments. The error bars indicate S.D. Statistical analysis was performed using Student’s T test, * indicates p < 0.05.
Figure 2
Figure 2
(a) Photomicrographs of 501 mel cells analysed 72 h after transfection with the indicated siRNA showing the level of 53BP1 (Red) and γH2AX (Green) subnuclear foci. DNA was stained via DAPI. (b) Histograms showing the percentage of 53BP1-positive cells classified as a function of the level of foci per cell. The data shown are from one representative experiment. (c) Photomicrographs of 501 mel cells captured 72 h after transfection with the indicated siRNA showing examples of analysed mitotic abnormalities, specifically micronuclei and anaphase bridges, indicated by arrows. Cells were treated with 10 ng/ml of MMC and 2 μg/ml of Cytochalasin B over-night before fixation. (d) Histograms showing the percentage of 501 mel cells presenting micronuclei at 72 or 96 h after transfection with the indicated siRNA. The data are the means of 3 independent experiments. The error bars indicate S.D. The statistical analysis was performed using Student’s T test. * indicates p < 0.05 and ** indicates p < 0.01. N.S., Not Significant. (e) Survival analysis in 501 mel cells exposed to increasing doses of mitomycin C. Each point represents the means of 3 independent experiments. The error bars indicate S.D. (f) 501 mel cells were transfected with control or MiTF-specific siRNA; 96 h later, these cells were exposed to mitomycin C (0.01 μg/ml) for 24 h. Metaphase spreads were analysed for chromosome breaks and radial figures. Representative images of radial figures and chromosome breaks are shown. The arrow indicates chromosomal aberrations. The inset is a magnification of a tri-radial chromosome.
Figure 3
Figure 3
(a) Histograms showing the relative level of the indicated mRNA 48 h after transfection with siRNA targeting MiTF expression in 501 mel. The specific MiTF target tyrosinase (Tyr) was used as a control for the loss-of-function of the transcription factor. The data are the means of 3 independent experiments. Statistical analysis was performed using Student’s T test, ** indicates p < 0.01 and *** indicates p < 0.001. (b) Immunoblot showing the time-dependent consequences of the siRNA-mediated downregulation of MiTF on FANCD2 and FANCA levels. MiTF expression also decreased spontaneously as a consequence of culture time; FANCA and FANCD2 decreased accordingly. Actin and Vinculin were used as loading controls. (c) Histograms showing the quantification of the relative FANCA (top) or FANCD2 (bottom) levels in siMiTF-depleted 501 mel cells. Data are the means of three independent experiments. The error bars indicate S.D. Statistical analysis was performed using Student’s T test, * indicates p < 0.05 and ** indicates p < 0.01. (d) Immunoblot showing DNA damage-induced FANCD2 monoubiquitination in 501 mel cells that were untreated (NT) or exposed to MMC (1 μg/ml 1 h) 48 h after transfection with the indicated siRNA. Vinculin was used as loading control. The L/S ratio was calculated using ImageJ software. (e) Photomicrographs showing examples of FANCD2 subnuclear foci (red) in S-G2 phases cells, i.e., positively stained with Cyclin A (green). DNA was stained with DAPI. The cells were treated with MMC (1 μg/ml 1 h) 72 h after transfection with the indicated siRNA. (f) Histograms showing the quantification of the data from experiments presented in (e). The data are the means of 3 independent experiments. The statistical analysis was performed using Student’s T test, * indicates p < 0.05.
Figure 4
Figure 4
(a) Example of 501 mel cells transfected with the indicated siRNA and stained with anti-53BP1 (red) or γH2AX (green) to show the presence of subnuclear foci. DNA was stained with DAPI. (b) Quantification of the number of 53BP1 foci per nucleus. At least 75 cells from 10 different microscope fields were scored. Data are from one of three independent experiments with similar results. The statistical analysis was performed using Student’s T test, *** indicates p < 0.001. The mean and the S.E.M. are indicated in red. (c) Cell proliferation analysis of MITF-depleted or MITF-depleted and FANCD2 or FANCA overexpressing 501 mel melanoma cells exposed to increasing doses of mitomycin C. Each point represents the means of 3 independent experiments. Statistical analysis was performed using Student’s T test. * indicates p < 0.05 and ** indicates p < 0.01 in relation to siCTL or siMiTF-transfected cells. (d) SA-βGal relative activity evaluated via FACS analysis 72 h after transfection with the indicated plasmids and/or siRNA in 501 mel melanoma cells. (e) Relative SA-βGal activity in 501 mel cells 72 h after transfection with the indicated vectors and siRNA. The data are the means of at least 3 independent experiments. The error bars indicate S.D. (f) Relative intracellular ROS content in 501 mel cells 72 h after transfection with the indicated vectors and siRNA. The data are the means of at least 3 independent experiments. The error bars indicate S.D. (g) Immunoblot showing the effects of the transfection with the indicated vectors and siRNA in 501 mel melanoma cells on p53, P-p53, and p27 levels at 72 h post-transfection. Actin expression was used as a loading control.
Figure 5
Figure 5
(a) Weight of the tumors developed in nude mice injected subcutaneously with 1 × 106 B16 melanoma cells transfected with the indicated siRNA. Tumors were isolated 10 days after the injection, 3 mice for each siRNA were injected. (b) Survival curves for 44 metastatic melanoma patients were calculated using a Kaplan-Meier analysis with a Mantel-Cox long rank statistical significance test. Data are from the data set GSE19232. (c) Immunoblot of control or FANCD2-suppressed WM9 melanoma cells that were untreated or exposed to vemurafenib (1 μM for 48 h) with the indicated antibodies. (d) Proliferation of WM9 or FANCD2-silenced WM9 melanoma cells that were untreated or exposed to vemurafenib (1 μM for 48 h). The statistical analysis was performed using Student’s T test, ** indicates p < 0.01 and *** indicates p < 0.001. (e) Schematic model summarising the observations made in this manuscript. FANC pathway, contributes to DNA damage response downstream of MiTF, avoiding the DNA damage-dependent senescence programme to take place, whereas MITF controls both ROS levels as well as DNA damage response, in a FANC pathway-independent and -dependent manner, respectively.

References

    1. Rughani M. G., Gupta A. & Middleton M. R. New treatment approaches in melanoma: current research and clinical prospects. Therapeutic advances in medical oncology 5, 73–80, doi: 10.1177/1758834012463260 (2013). - DOI - PMC - PubMed
    1. Kauffmann A. et al. High expression of DNA repair pathways is associated with metastasis in melanoma patients. Oncogene 27, 565–573, doi: 10.1038/sj.onc.1210700 (2008). - DOI - PubMed
    1. Winnepenninckx V. et al. Gene expression profiling of primary cutaneous melanoma and clinical outcome. J Natl Cancer Inst 98, 472–482, doi: 10.1093/jnci/djj103 (2006). - DOI - PubMed
    1. Hosoya N. & Miyagawa K. Targeting DNA damage response in cancer therapy. Cancer science 105, 370–388, doi: 10.1111/cas.12366 (2014). - DOI - PMC - PubMed
    1. Kinzler K. W. & Vogelstein B. Cancer-susceptibility genes. Gatekeepers and caretakers. Nature 386, 761, 763, doi: 10.1038/386761a0 (1997). - DOI - PubMed

Publication types

MeSH terms