. 2016 Nov 9;11(11):e0165331.
doi: 10.1371/journal.pone.0165331. eCollection 2016.

Direct Measurements of Smartphone Screen-Time: Relationships with Demographics and Sleep

Affiliations

Direct Measurements of Smartphone Screen-Time: Relationships with Demographics and Sleep

Matthew A Christensen et al. PLoS One. .

Abstract

Background: Smartphones are increasingly integrated into everyday life, but frequency of use has not yet been objectively measured and compared to demographics, health information, and in particular, sleep quality.

Aims: The aim of this study was to characterize smartphone use by measuring screen-time directly, determine factors that are associated with increased screen-time, and to test the hypothesis that increased screen-time is associated with poor sleep.

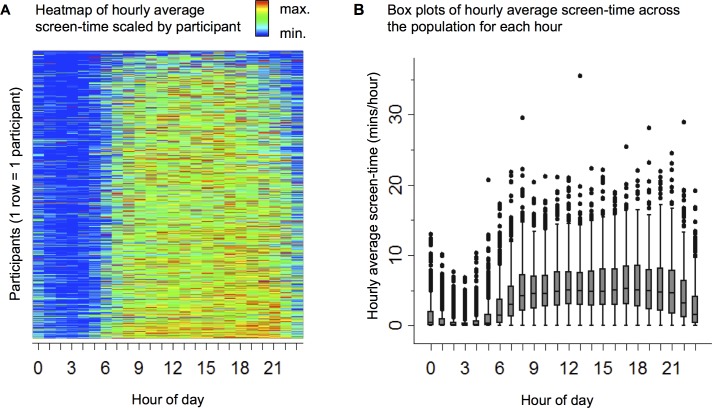
Methods: We performed a cross-sectional analysis in a subset of 653 participants enrolled in the Health eHeart Study, an internet-based longitudinal cohort study open to any interested adult (≥ 18 years). Smartphone screen-time (the number of minutes in each hour the screen was on) was measured continuously via smartphone application. For each participant, total and average screen-time were computed over 30-day windows. Average screen-time specifically during self-reported bedtime hours and sleeping period was also computed. Demographics, medical information, and sleep habits (Pittsburgh Sleep Quality Index-PSQI) were obtained by survey. Linear regression was used to obtain effect estimates.

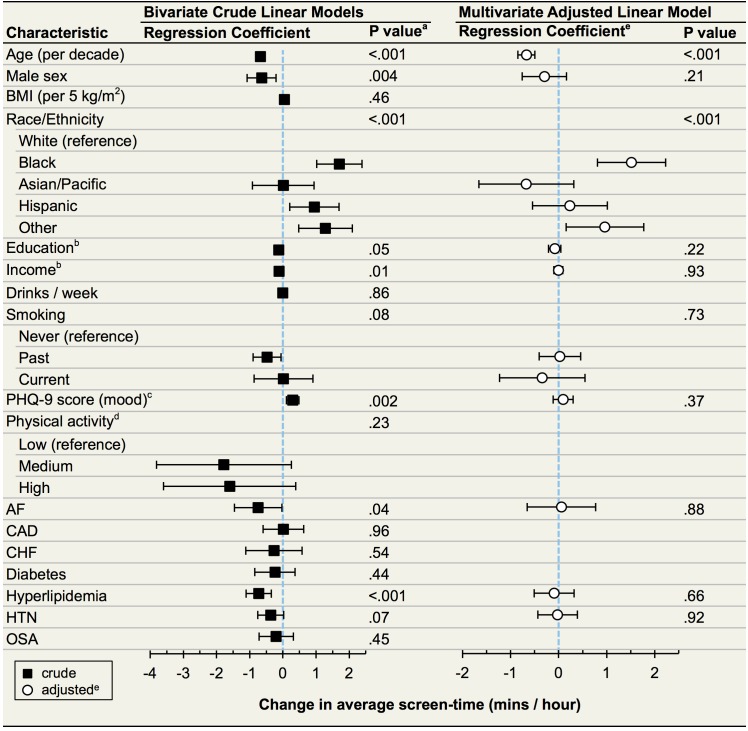
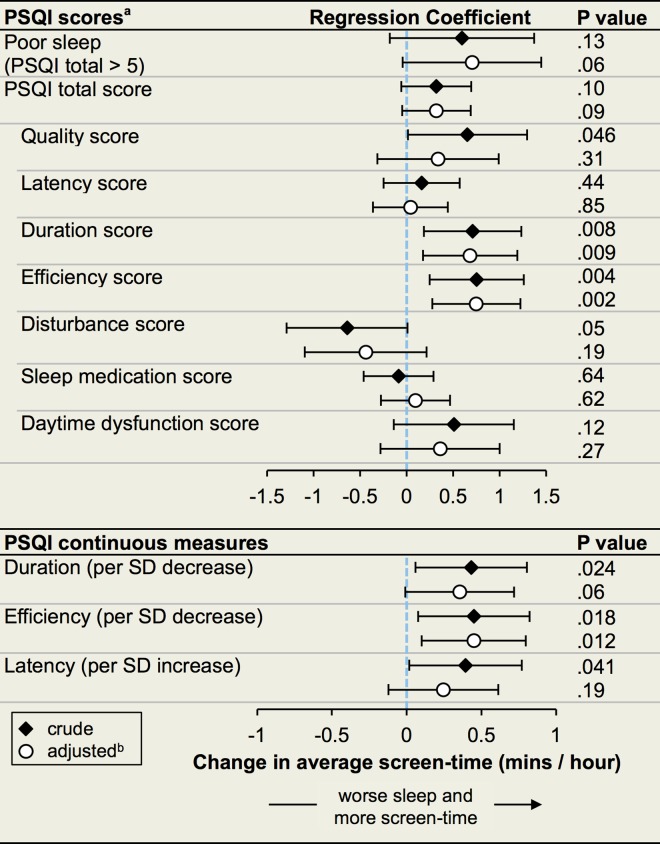
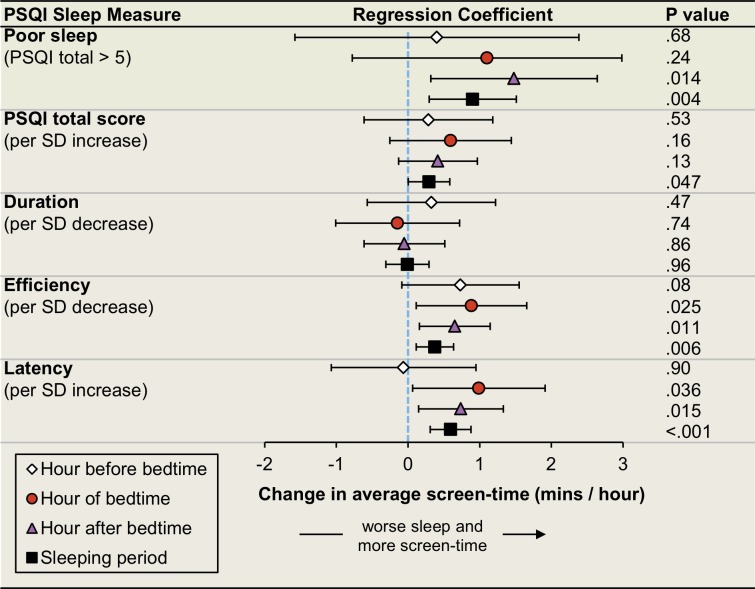
Results: Total screen-time over 30 days was a median 38.4 hours (IQR 21.4 to 61.3) and average screen-time over 30 days was a median 3.7 minutes per hour (IQR 2.2 to 5.5). Younger age, self-reported race/ethnicity of Black and "Other" were associated with longer average screen-time after adjustment for potential confounders. Longer average screen-time was associated with shorter sleep duration and worse sleep-efficiency. Longer average screen-times during bedtime and the sleeping period were associated with poor sleep quality, decreased sleep efficiency, and longer sleep onset latency.

Conclusions: These findings on actual smartphone screen-time build upon prior work based on self-report and confirm that adults spend a substantial amount of time using their smartphones. Screen-time differs across age and race, but is similar across socio-economic strata suggesting that cultural factors may drive smartphone use. Screen-time is associated with poor sleep. These findings cannot support conclusions on causation. Effect-cause remains a possibility: poor sleep may lead to increased screen-time. However, exposure to smartphone screens, particularly around bedtime, may negatively impact sleep.


Conflict of interest statement

LK and STM are employees of Ginger.io Incorporated. This does not alter our adherence to PLOS ONE policies on sharing data and materials.

Figures

Fig 1
Fig 1. Geographical Distribution of Participants in the United States.
Abbreviations: AK, Alaska; HI, Hawaii. Dots represent the number of participants that resided in the zip-code corresponding to the placement on the map. All 50 states were represented and 147 (23%) resided in California. Created with Tableau Software (www.tableau.com) and published with permission of the company (S1 File). The U.S. map was used under a CC BY-SA copyright from OpenStreetMap contributors (www.openstreetmap.org/copyright).
Fig 2
Fig 2. Distribution of Screen-Time Over the Day (Hourly Average Screen-Time).
(A) Hourly average screen-time scaled to the maximum within each participant: blue = minimum; red = maximum. Each horizontal line represents data for one participant across 24 hours in a day. (B) Box plots of population summary statistics of hourly average screen-time. Horizontal line within box = median, boxes = IQR, whiskers = 1.5 interquartile range (IQR), dots = outliers.
Fig 3
Fig 3. Associations Between Baseline Survey Data and Average Screen-Time (N = 653).
Abbreviations: BMI, body mass index; AF, atrial fibrillation; CAD, coronary artery disease; CHF, congestive heart failure; HTN, hypertension; OSA, obstructive sleep apnea. Boxes (bivariate) and circles (multivariate) represent point estimates for linear regression coefficients, which correspond to the increase in average screen-time for a unit change in the corresponding variable. Whiskers give 95% confidence intervals. For categorical covariates (race/ethnicity, smoking, activity level) p values for the overall effect of the variable are presented. a Factors significantly associated with average screen-time at the p < 0.10 level in bivariate linear models were included in a multivariate linear model. b Education and income were both ascertained with 9 levels and analyzed as continuous variables. c PHQ-9 score is scaled to a unit increase of 5, the width of each category of depression. d Data were available on 267 participants. e White circles are regression coefficients adjusted for all other variables in the model.
Fig 4
Fig 4. Associations between Baseline Sleep Quality and Average Screen-Time.
Abbreviations: PSQI, Pittsburg Sleep Quality Index; SD, standard deviation. Diamonds (unadjusted) and circles (adjusted) represent point estimates for linear regression coefficients, which correspond to the increase in average screen-time for a unit change in the corresponding variable. Whiskers give 95% confidence intervals. Each PSQI score was analyzed as a continuous variable. Coefficients for PSQI total score are reported per SD increase, coefficients for Poor sleep and other PSQI component scores are reported per unit increase. a PSQI sub-scores range from 0 (good) to 3 (poor) for each component of sleep. The total score is the sum of the sub-scores (0–21). PSQI total score > 5 is a standard dichotomous measure for overall poor sleep. Decreased sleep duration and decreased sleep efficiency correspond to higher component scores. b Adjusted for age, sex, race/ethnicity, and history of obstructive sleep apnea.
Fig 5
Fig 5. Associations between Baseline Sleep Quality and Average Screen-Time Within Sleep-Related Hours.
Abbreviations: PSQI, Pittsburg Sleep Quality Index; SD, standard deviation. Among participants with a sleep survey and full screen-time data (N = 56), self-reported bedtime and wakeup-time was used to compute average screen-time (over 30 days) during the hour before bedtime, the hour of bedtime, the hour after bedtime, and during the sleeping period (all hours from bedtime to wakeup-time). All markers represent point estimates for linear regression coefficients after adjustment for age, sex, race/ethnicity, and history of obstructive sleep apnea. Coefficients correspond to the increase in average screen-time, during the indicated period, for a unit change in the corresponding sleep measure. Whiskers give 95% confidence intervals.

References

    1. Smith A, Rainie L, McGeeney K, Keeter S, Duggan M. The Smartphone Difference [Internet]. Pew Research Center. 2015 [cited 2016 Mar 9]. Available from: http://www.pewinternet.org/2015/04/01/us-smartphone-use-in-2015
    1. Gradisar M, Wolfson AR, Harvey AG, Hale L, Rosenberg R, Czeisler CA. The sleep and technology use of Americans: Findings from the National Sleep Foundation’s 2011 sleep in America poll. J Clin Sleep Med. 2013;9(12):1291–9. 10.5664/jcsm.3272 - DOI - PMC - PubMed
    1. Cappuccio FP, Cooper D, D’Elia L, Strazzullo P, Miller MA. Sleep duration predicts cardiovascular outcomes: a systematic review and meta-analysis of prospective studies. Eur Heart J [Internet]. 2011. June 2 [cited 2015 Jun 12];32(12):1484–92. Available from: http://eurheartj.oxfordjournals.org/content/32/12/1484 10.1093/eurheartj/ehr007 - DOI - PubMed
    1. Grandner MA, Jackson NJ, Pak VM, Gehrman PR. Sleep disturbance is associated with cardiovascular and metabolic disorders. J Sleep Res. 2012;21(4):427–33. 10.1111/j.1365-2869.2011.00990.x - DOI - PMC - PubMed
    1. Duffy JF, Czeisler C a. Effect of Light on Human Circadian Physiology. Sleep Med Clin [Internet]. 2009. June;4(2):165–77. Available from: http://linkinghub.elsevier.com/retrieve/pii/S1556407X09000058 10.1016/j.jsmc.2009.01.004 - DOI - PMC - PubMed

LinkOut - more resources