

AutoAnnotate: A Cytoscape app for summarizing networks with semantic annotations
- PMID: 27830058
- PMCID: PMC5082607
- DOI: 10.12688/f1000research.9090.1
AutoAnnotate: A Cytoscape app for summarizing networks with semantic annotations
Abstract
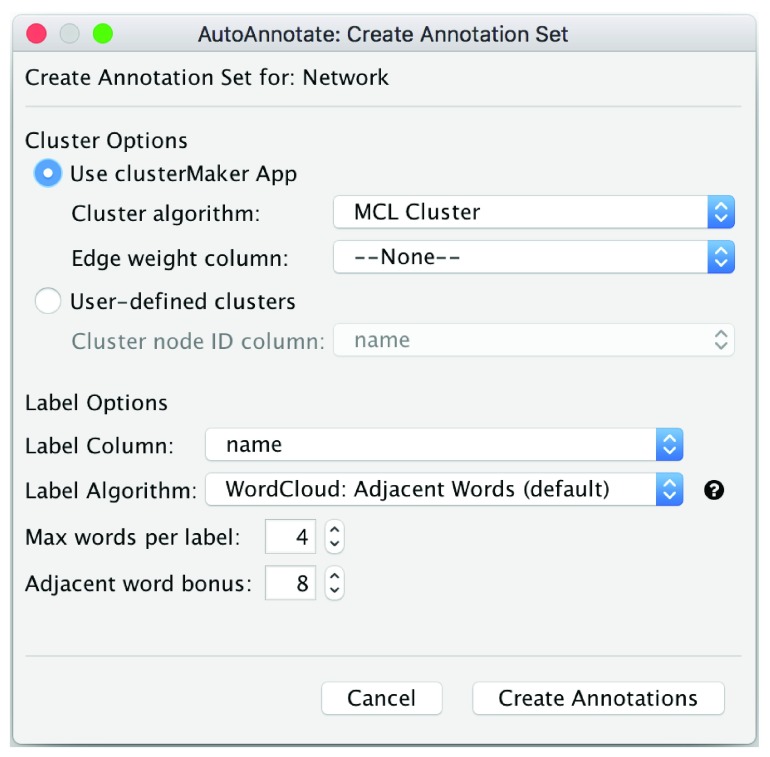
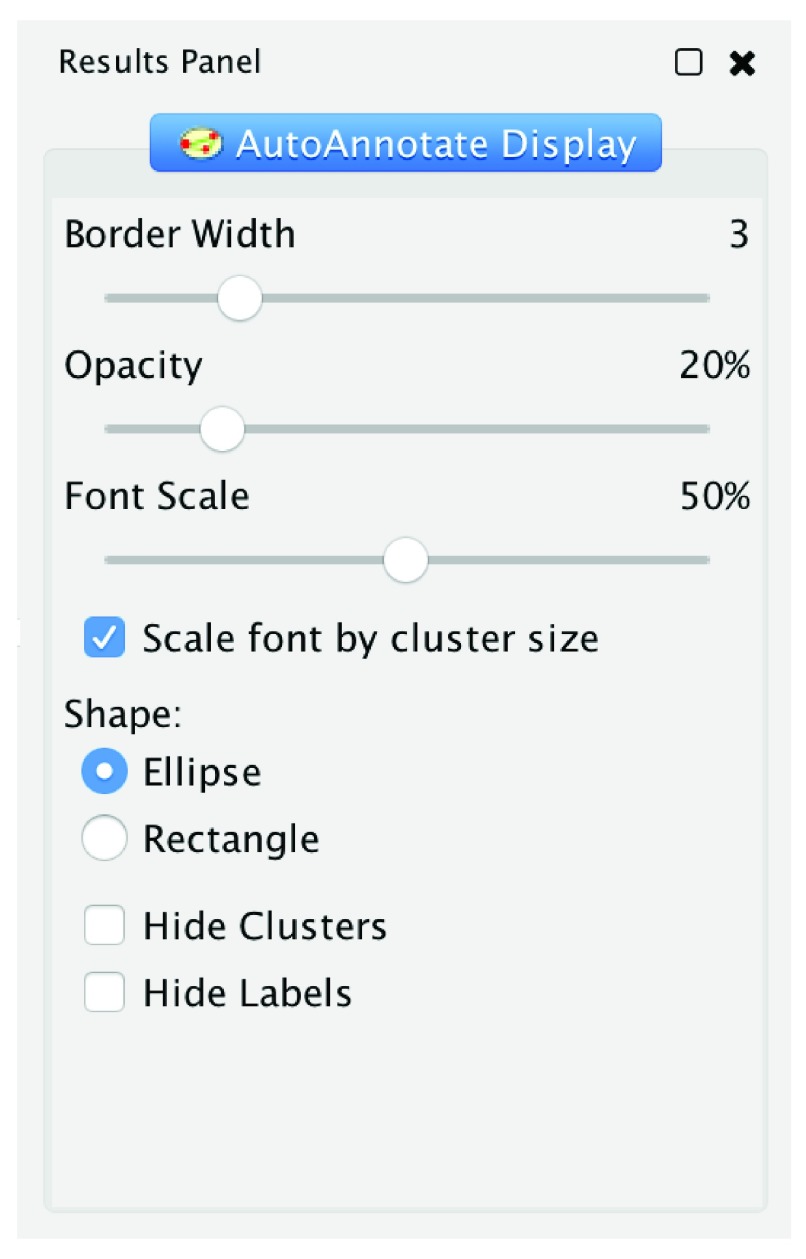
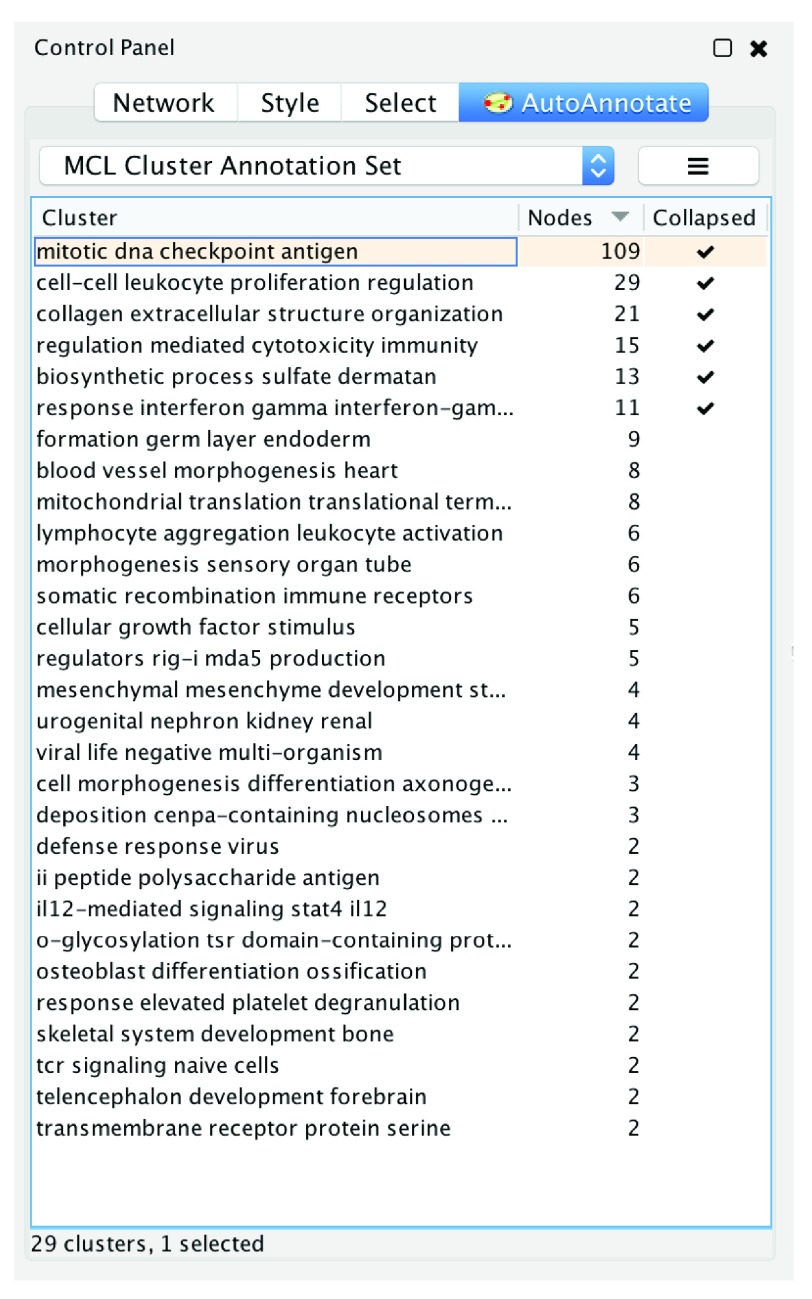
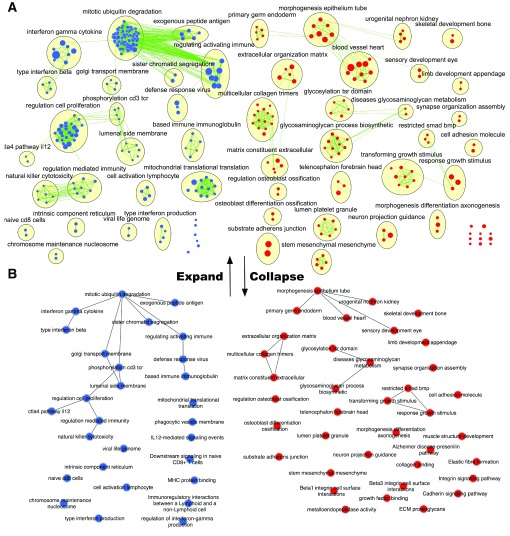
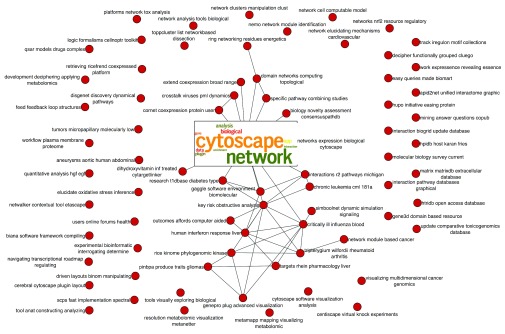
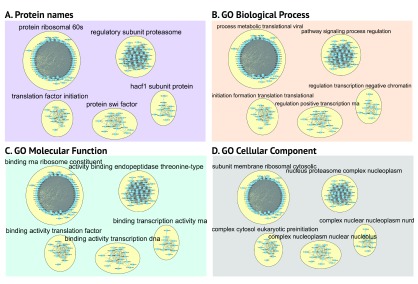
Networks often contain regions of tightly connected nodes, or clusters, that highlight their shared relationships. An effective way to create a visual summary of a network is to identify clusters and annotate them with an enclosing shape and a summarizing label. Cytoscape provides the ability to annotate a network with shapes and labels, however these annotations must be created manually one at a time, which can be a laborious process. AutoAnnotate is a Cytoscape 3 App that automates the process of identifying clusters and visually annotating them. It greatly reduces the time and effort required to fully annotate clusters in a network, and provides freedom to experiment with different strategies for identifying and labelling clusters. Many customization options are available that enable the user to refine the generated annotations as required. Annotated clusters may be collapsed into single nodes using the Cytoscape groups feature, which helps simplify a network by making its overall structure more visible. AutoAnnotate is applicable to any type of network, including enrichment maps, protein-protein interactions, pathways, or social networks.
Keywords: annotations; complexity reduction; cytoscape; enrichment map; modular networks; network analysis; network clustering; tag cloud.
Conflict of interest statement
There are no competing interests.
Figures


Similar articles
-
WordCloud: a Cytoscape plugin to create a visual semantic summary of networks.Source Code Biol Med. 2011 Apr 7;6:7. doi: 10.1186/1751-0473-6-7. Source Code Biol Med. 2011. PMID: 21473782 Free PMC article.
-
Identifying Gene Interaction Networks.Methods Mol Biol. 2017;1666:539-556. doi: 10.1007/978-1-4939-7274-6_27. Methods Mol Biol. 2017. PMID: 28980264
-
Cytoscape StringApp: Network Analysis and Visualization of Proteomics Data.J Proteome Res. 2019 Feb 1;18(2):623-632. doi: 10.1021/acs.jproteome.8b00702. Epub 2018 Dec 5. J Proteome Res. 2019. PMID: 30450911 Free PMC article.
-
eXamine: exploring annotated modules in networks.BMC Bioinformatics. 2014 Jul 10;15:201. doi: 10.1186/1471-2105-15-201. BMC Bioinformatics. 2014. PMID: 25002203 Free PMC article.
-
DyNetViewer: a Cytoscape app for dynamic network construction, analysis and visualization.Bioinformatics. 2018 May 1;34(9):1597-1599. doi: 10.1093/bioinformatics/btx821. Bioinformatics. 2018. PMID: 29293938
Cited by
-
Tissue-specific RNA-seq defines genes governing male tail tip morphogenesis in C. elegans.bioRxiv [Preprint]. 2024 Jan 12:2024.01.12.575210. doi: 10.1101/2024.01.12.575210. bioRxiv. 2024. Update in: Development. 2024 Sep 15;151(18):dev202787. doi: 10.1242/dev.202787. PMID: 38260477 Free PMC article. Updated. Preprint.
-
A multi-level approach reveals key physiological and molecular traits in the response of two rice genotypes subjected to water deficit at the reproductive stage.Plant Environ Interact. 2023 Sep 15;4(5):229-257. doi: 10.1002/pei3.10121. eCollection 2023 Oct. Plant Environ Interact. 2023. PMID: 37822730 Free PMC article. Review.
-
netDx: interpretable patient classification using integrated patient similarity networks.Mol Syst Biol. 2019 Mar 14;15(3):e8497. doi: 10.15252/msb.20188497. Mol Syst Biol. 2019. PMID: 30872331 Free PMC article.
-
APOE4 confers transcriptomic and functional alterations to primary mouse microglia.Neurobiol Dis. 2022 Mar;164:105615. doi: 10.1016/j.nbd.2022.105615. Epub 2022 Jan 11. Neurobiol Dis. 2022. PMID: 35031484 Free PMC article.
-
Recapitulating kidney development in vitro by priming and differentiating mouse embryonic stem cells in monolayers.NPJ Regen Med. 2020 Apr 20;5:7. doi: 10.1038/s41536-020-0092-5. eCollection 2020. NPJ Regen Med. 2020. PMID: 32351711 Free PMC article.
References
-
- Vlissides J, Helm R, Johnson R, et al. : Design patterns: Elements of reusable object-oriented software.Reading: Addison-Wesley.1995;49(120):11 Reference Source
Grants and funding
LinkOut - more resources
Full Text Sources
Other Literature Sources