. 2016 Nov 22;113(47):E7418-E7427.
doi: 10.1073/pnas.1604847113. Epub 2016 Nov 8.

Synthetic genome readers target clustered binding sites across diverse chromatin states

Affiliations

Synthetic genome readers target clustered binding sites across diverse chromatin states

Graham S Erwin et al. Proc Natl Acad Sci U S A. .

Abstract

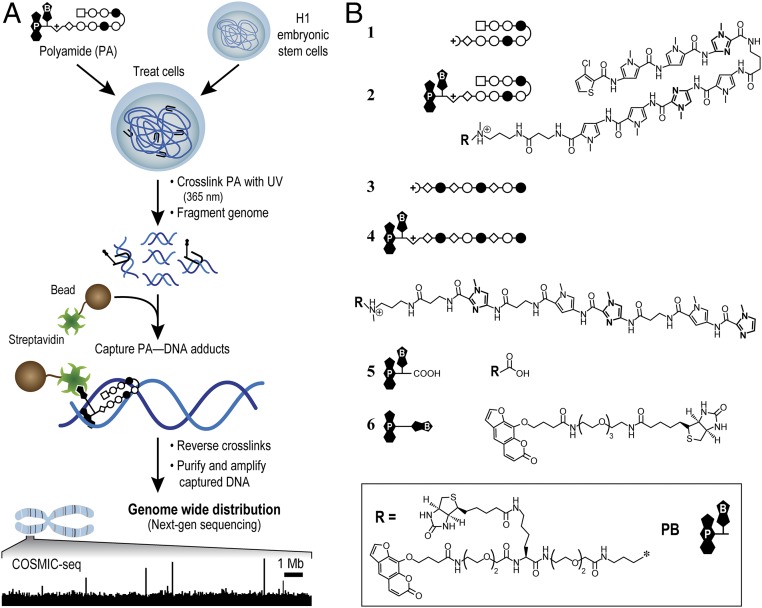
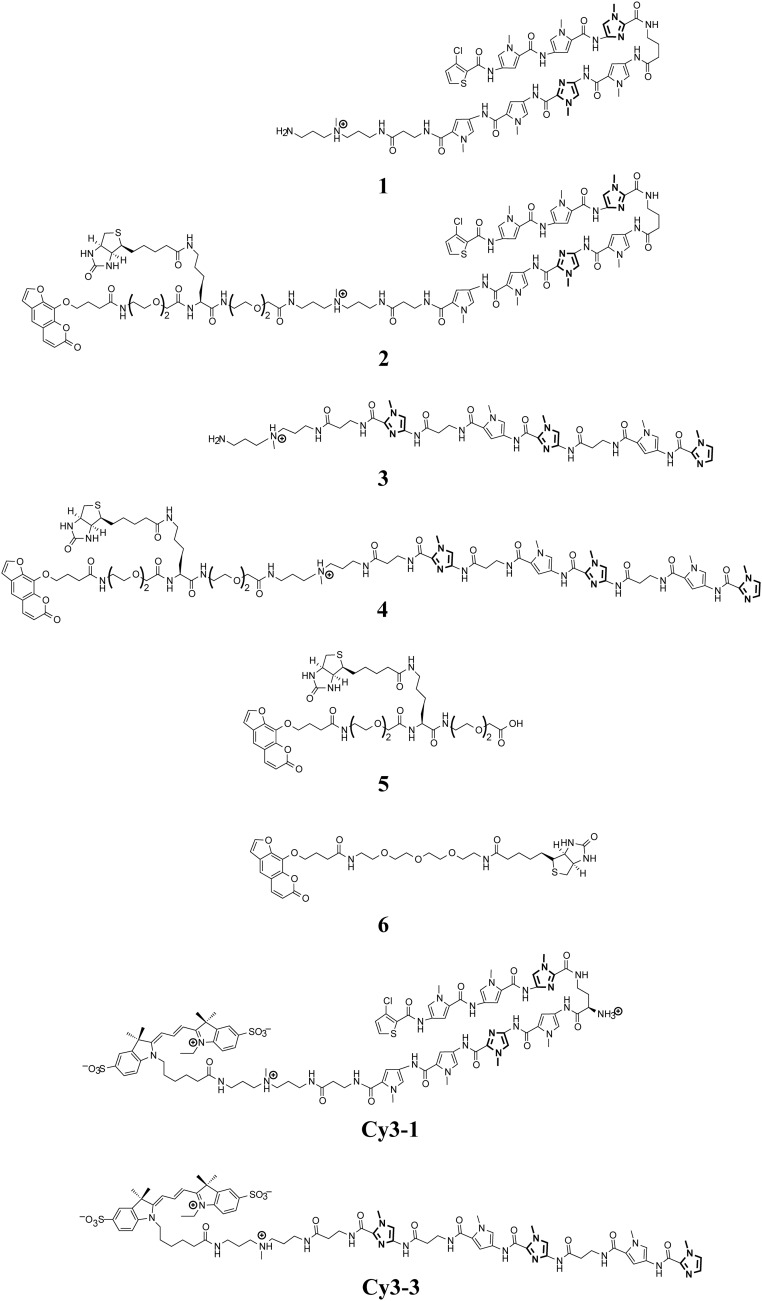
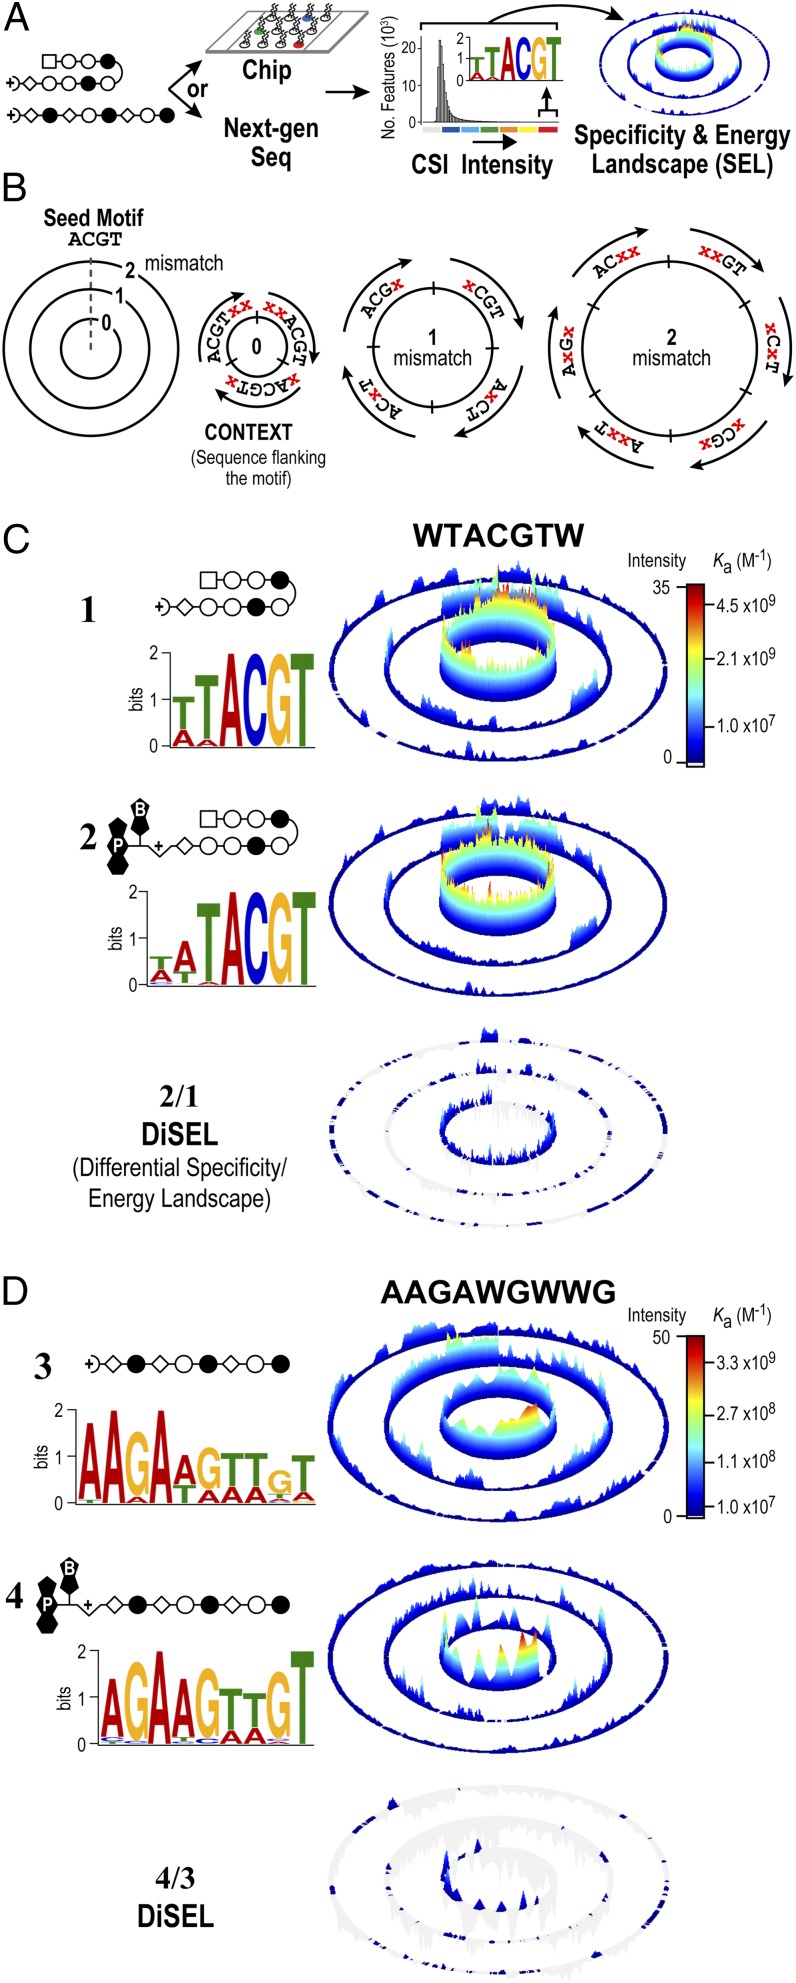
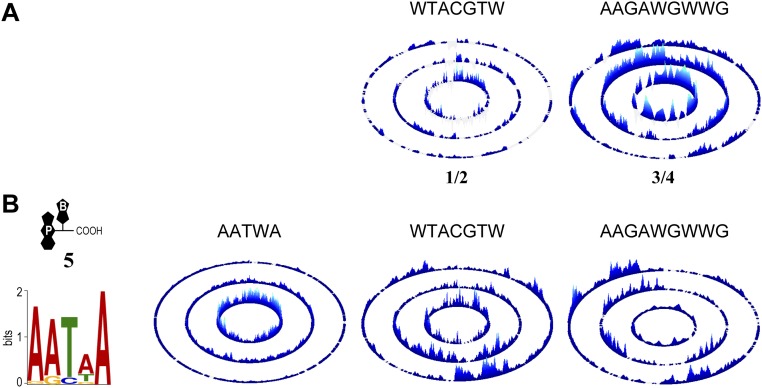
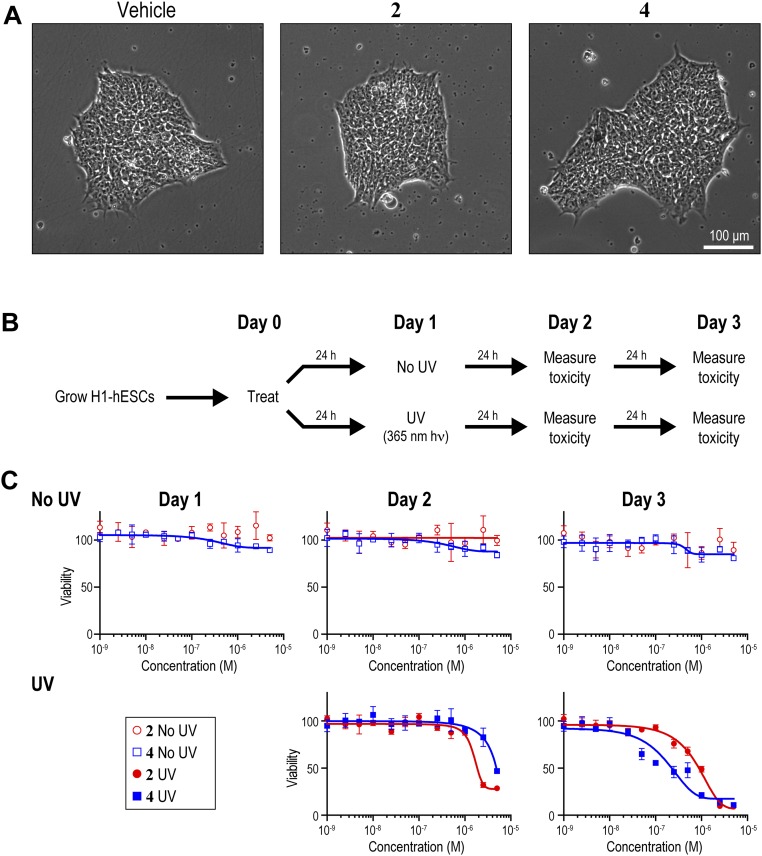
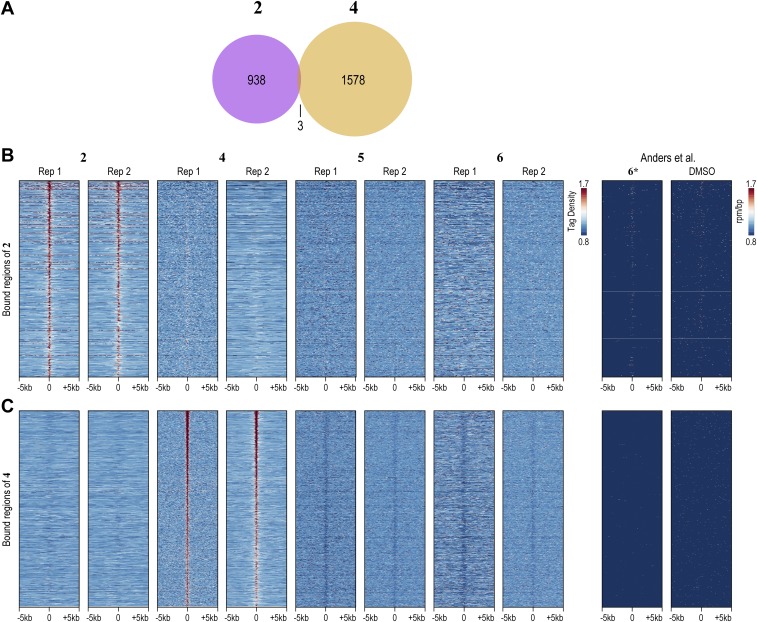
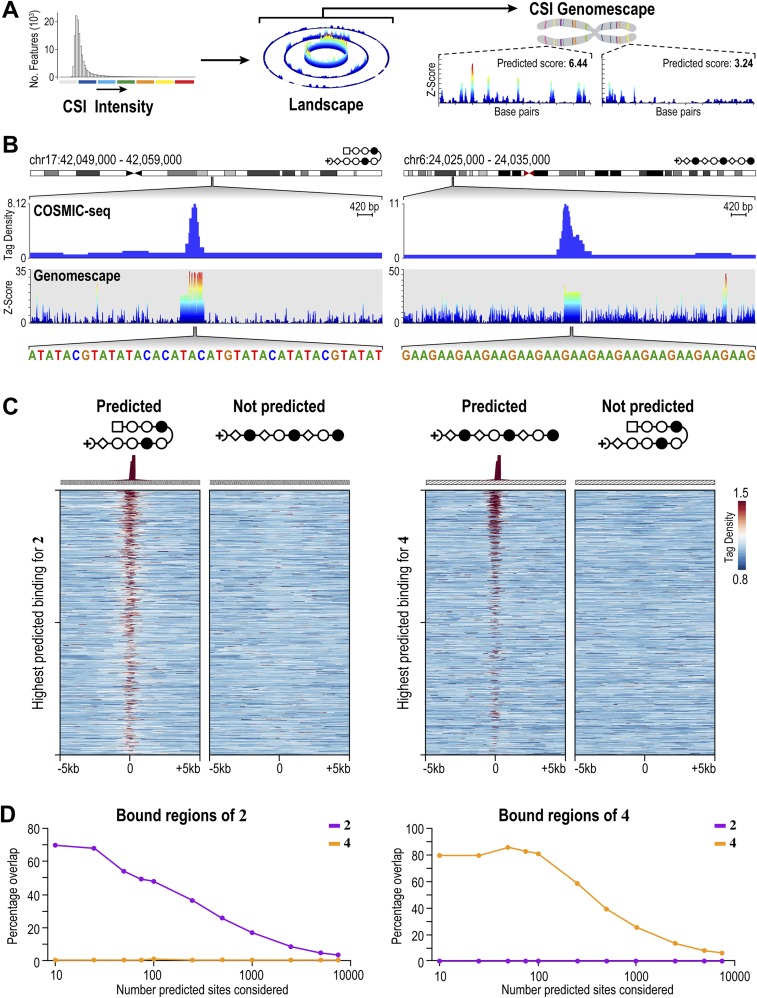
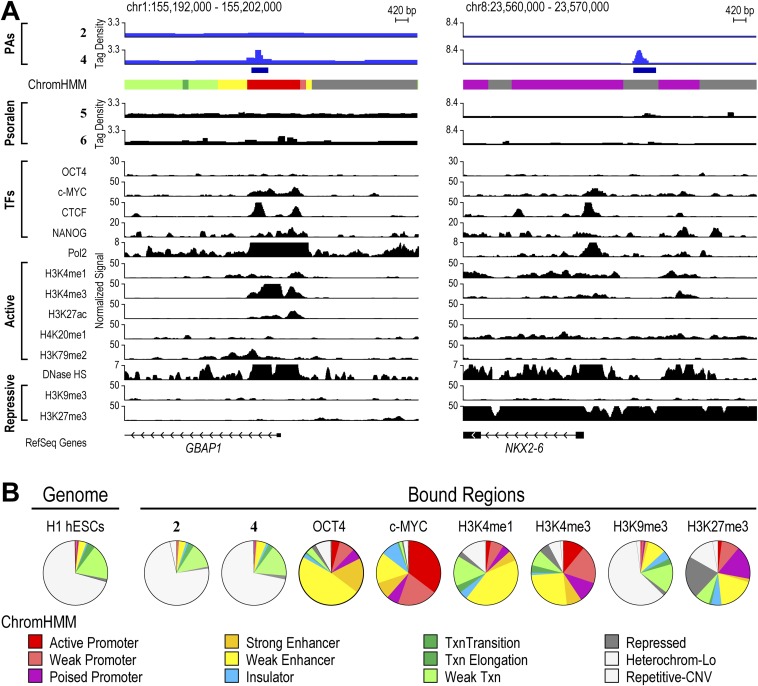
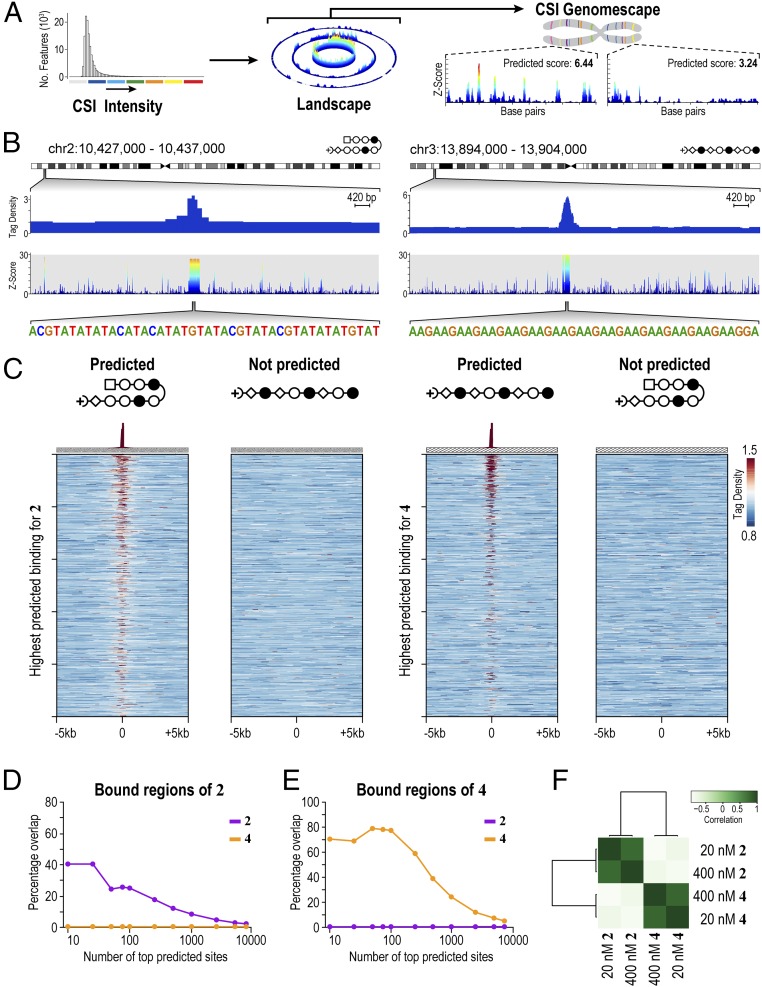
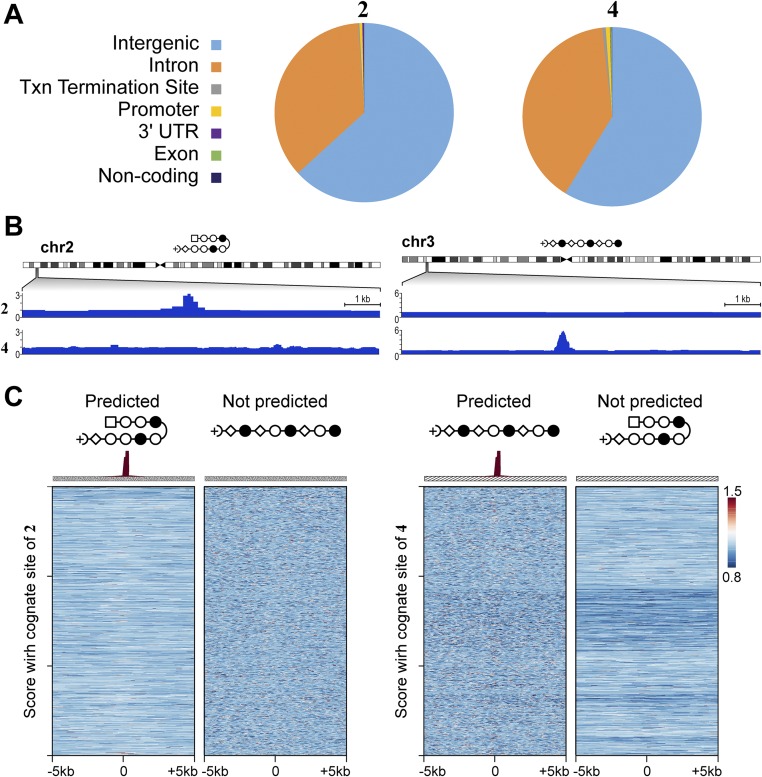
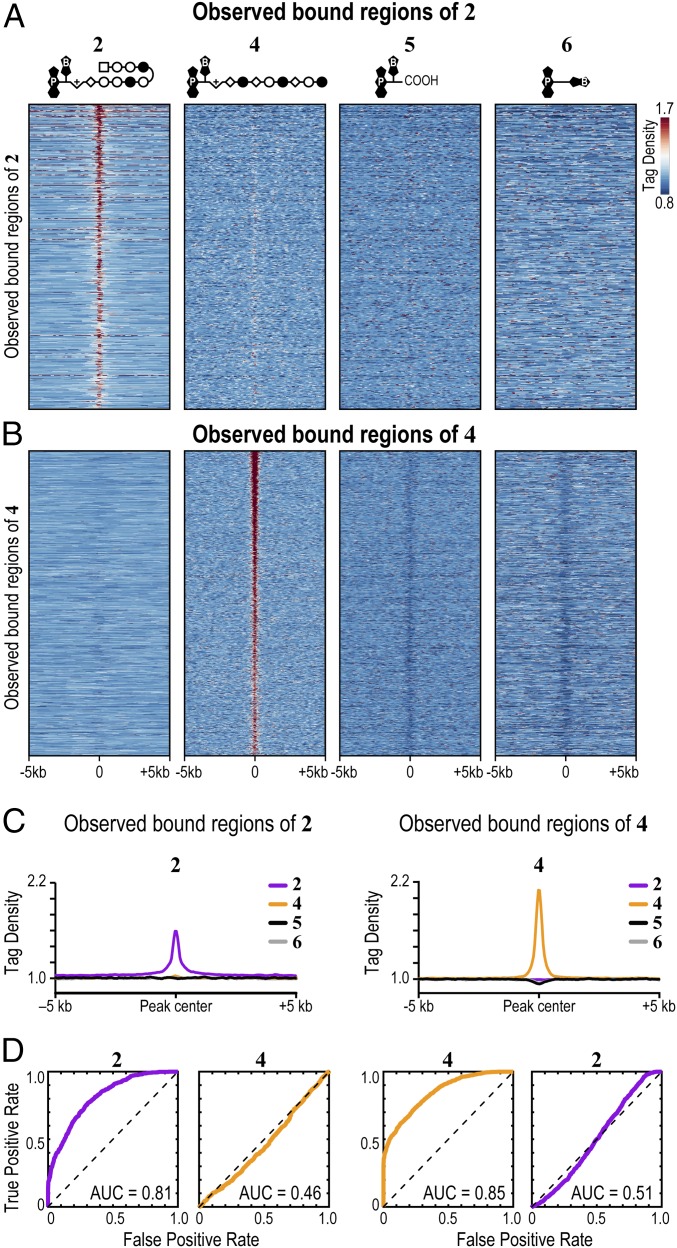
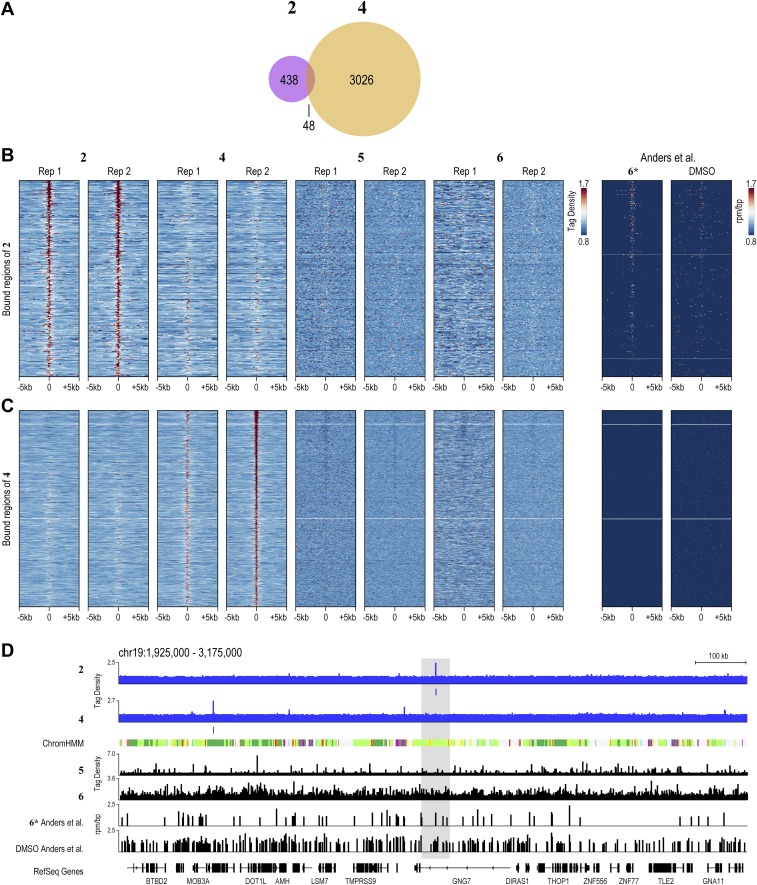
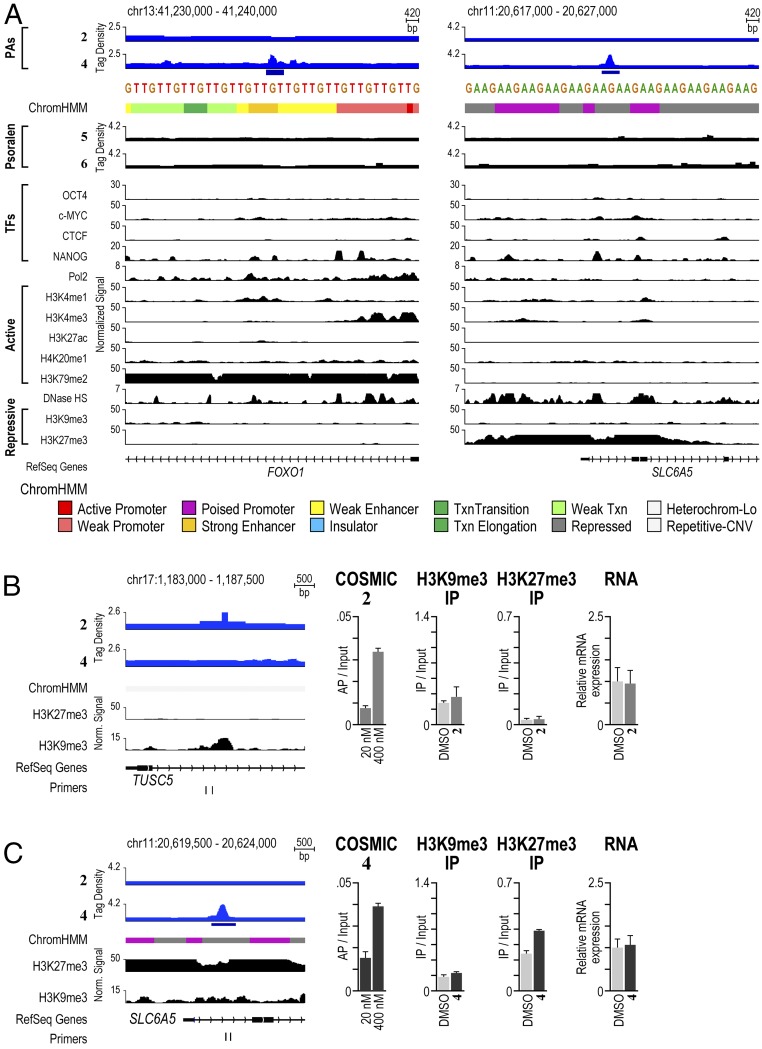
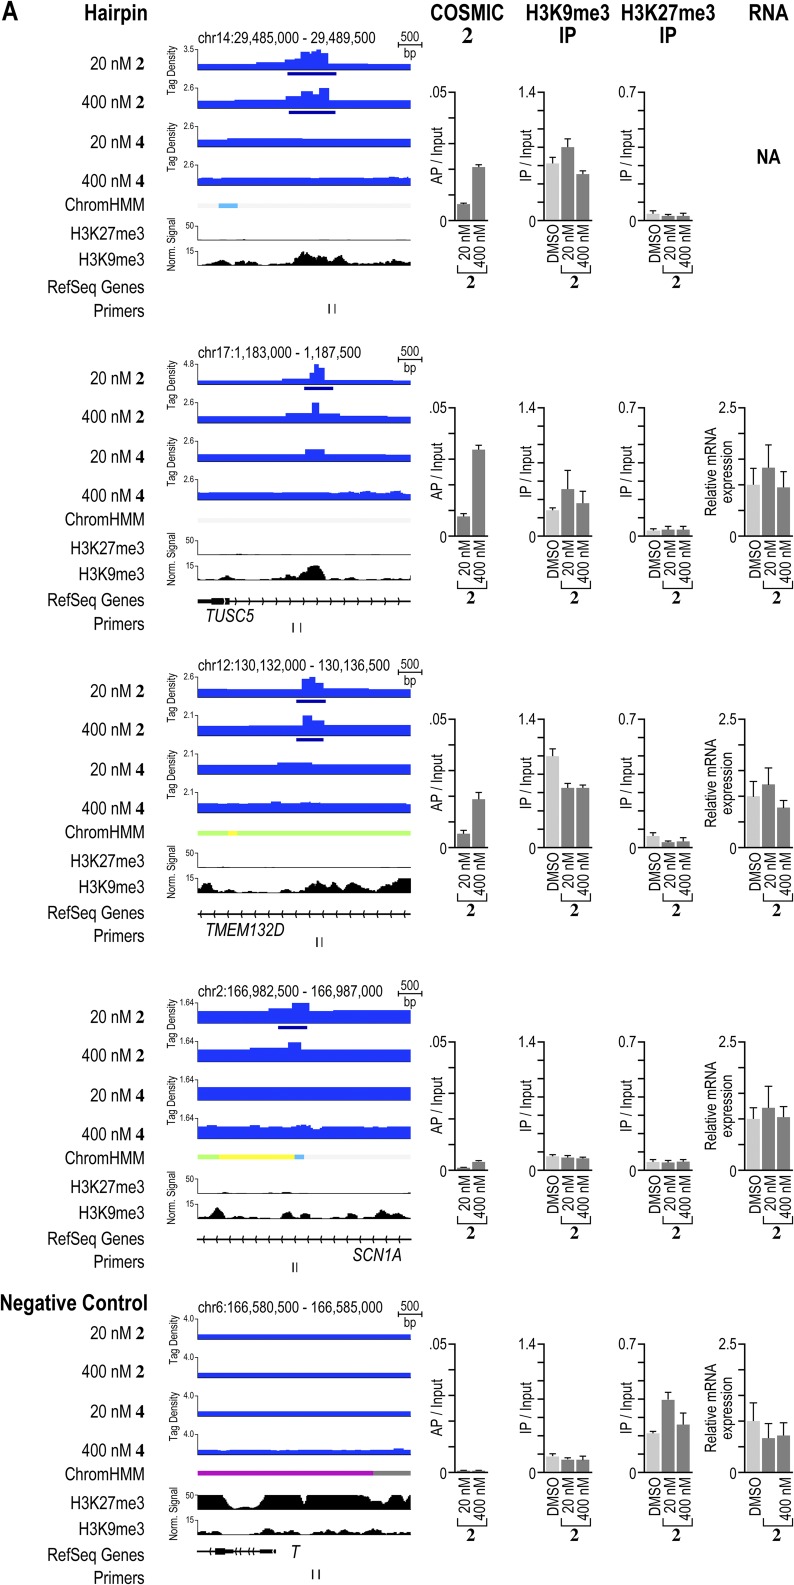
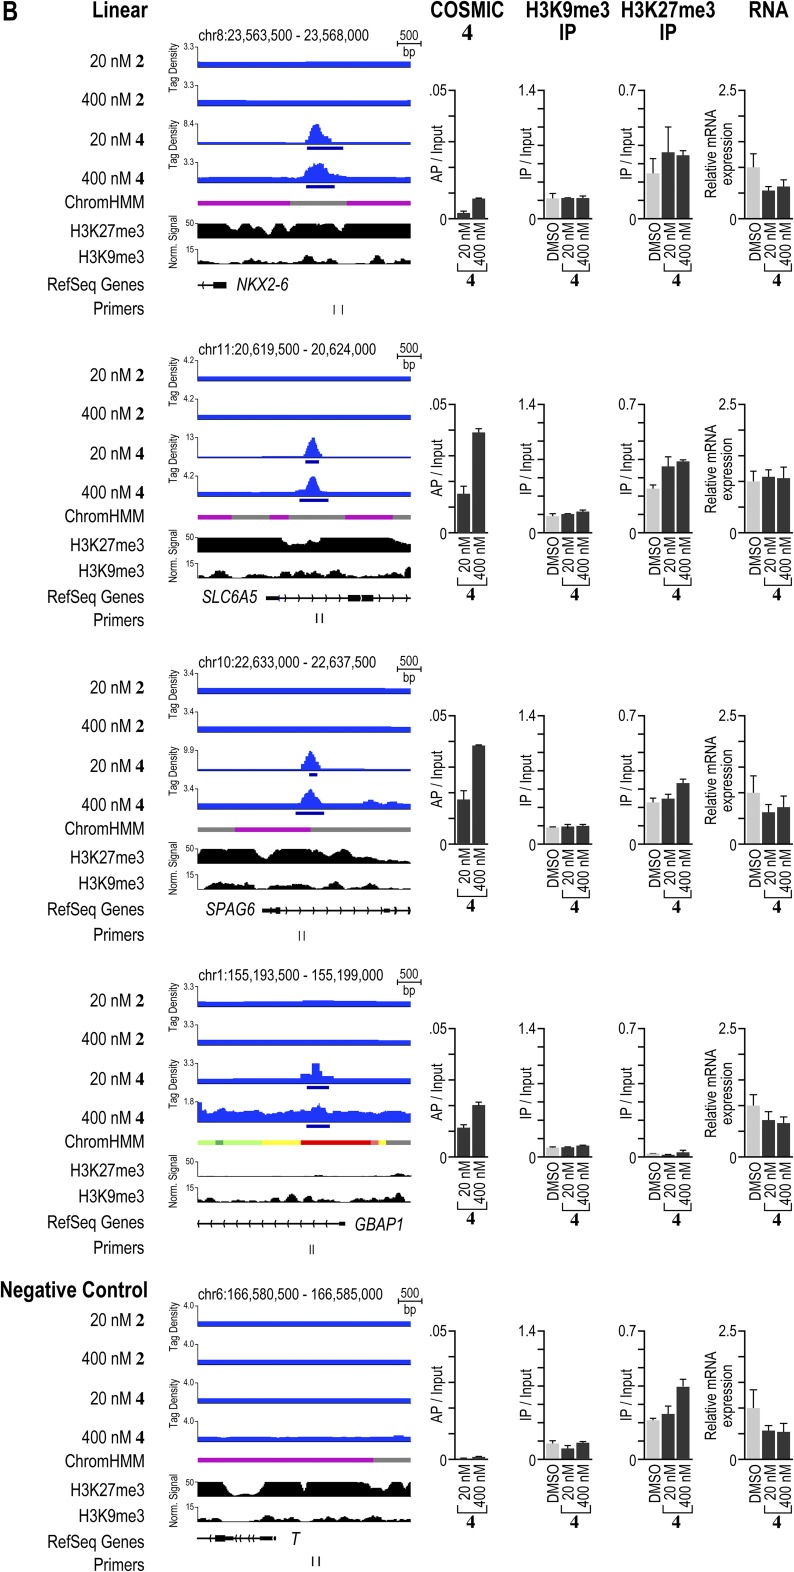
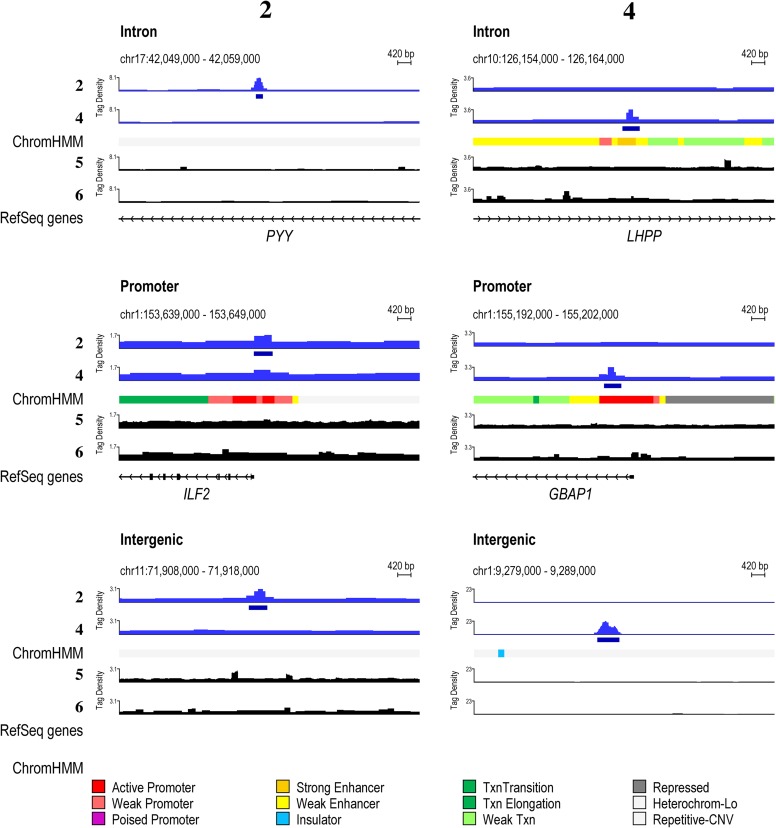
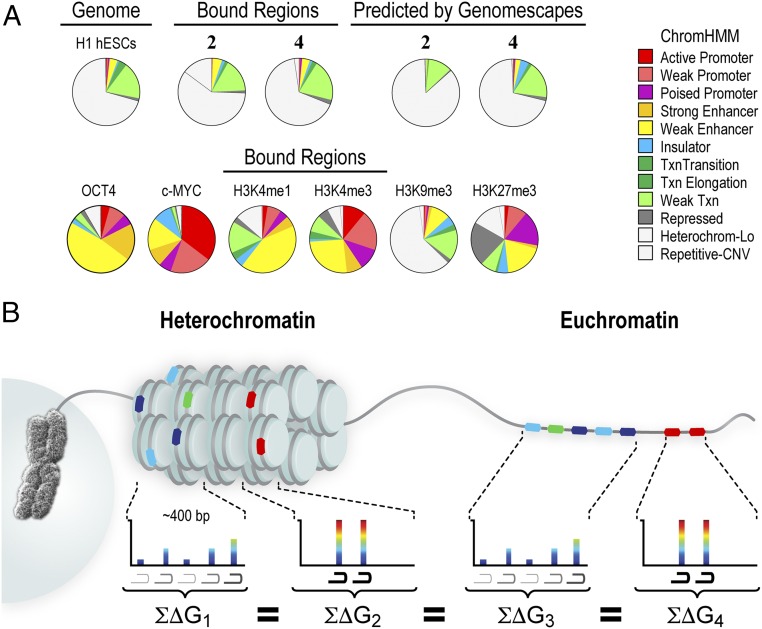
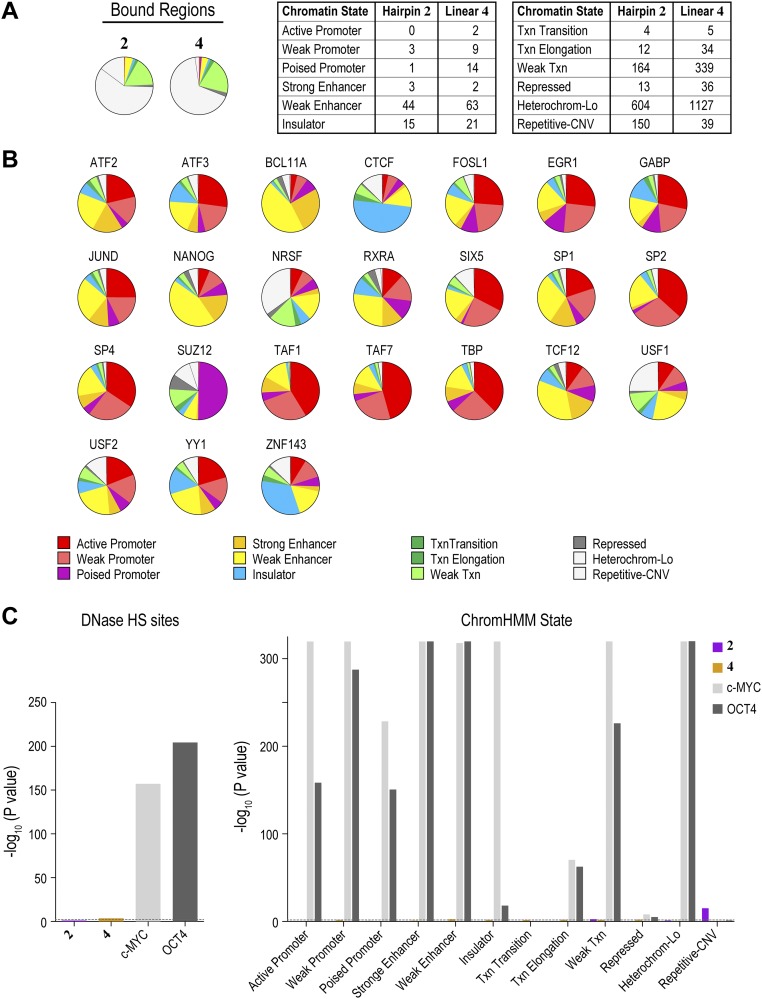
Targeting the genome with sequence-specific DNA-binding molecules is a major goal at the interface of chemistry, biology, and precision medicine. Polyamides, composed of N-methylpyrrole and N-methylimidazole monomers, are a class of synthetic molecules that can be rationally designed to "read" specific DNA sequences. However, the impact of different chromatin states on polyamide binding in live cells remains an unresolved question that impedes their deployment in vivo. Here, we use cross-linking of small molecules to isolate chromatin coupled to sequencing to map the binding of two bioactive and structurally distinct polyamides to genomes directly within live H1 human embryonic stem cells. This genome-wide view from live cells reveals that polyamide-based synthetic genome readers bind cognate sites that span a range of binding affinities. Polyamides can access cognate sites within repressive heterochromatin. The occupancy patterns suggest that polyamides could be harnessed to target loci within regions of the genome that are inaccessible to other DNA-targeting molecules.

Keywords: COSMIC; chemical genomics; genome targeting; molecular recognition; polyamide.


Conflict of interest statement

A.Z.A. is the sole member of VistaMotif, LLC and founder of the nonprofit WINStep Forward.

Figures

Fig. 1.
Fig. 1.
Bioactive polyamides and COSMIC scheme. (A) COSMIC-seq. Cells are treated with trifunctional derivatives of polyamide (PA). After cross-linking with 365 nm of UV irradiation, cells are lysed and genomic DNA is sheared. Streptavidin-coated magnetic beads are added to capture polyamide–DNA adducts. The DNA is released and analyzed by qPCR or by NGS. (B) Hairpin polyamides 1 and 2 target the DNA sequence 5′-WACGTW-3′, where W = A or T. Linear polyamides 3 and 4 target 5′-AAGAAGAAG-3′. Two derivatives of psoralen, 5 and 6, were also examined. Rings of N-methylimidazole are bolded for clarity. N-methylpyrrole (○), N-methylimidazole (●), 3-chlorothiophene (□), and β-alanine (◇) are shown. Psoralen (P) and biotin (B) are denoted.
Fig. S1.
Fig. S1.
Chemical structures of molecules. Structures of molecules used in this study are illustrated. Heterocycles of N-methylimidazole are bolded for clarity. Cy, cyanine.
Fig. 2.
Fig. 2.
Comprehensive sequence specificity landscapes of synthetic genome readers. (A) Workflow to generate CSI sequence SELs. Specificity data can be derived by two different methods. A DNA microarray contains approximately half a million spatially resolved features that each display a unique sequence as a DNA hairpin, with all sequence variants of DNA, up to 12 bp, represented on the array (–22). Polyamides are added to the microarray to obtain intensity values simultaneously for every DNA sequence. Alternatively, a library of DNA with all possible N-mers (e.g., 1012 unique 20-mers) can be added to a polyamide in solution (22). The polyamide–DNA interactions can be captured with an affinity handle to the polyamide (e.g., biotin/streptavidin), with the DNA amplified by PCR and sequenced with NGS (31). (B) Organization of a model SEL (21, 22, 63). The recognition preferences of DNA-binding molecules are displayed with SELs. A seed sequence (4 bp) is used to organize a dataset composed of all possible 6-mer combinations. (C and D) DNA logos and SELs reveal that the psoralen moiety has little impact on sequence specificity. Hairpin (C) and linear (D) polyamides with and without the psoralen moiety attached are shown. Scale bars show quantile-normalized CSI intensities. The difference between the two SELs is plotted as a DiSEL. Sequences preferred by 2 and 4 appear as colored peaks in the DiSELs of C and D, respectively.
Fig. S2.
Fig. S2.
DiSELs and SELs. (A) Reciprocal DiSELs from Fig. 2 C and D. (B) Consensus motif of 5 was used as a seed motif. As a control, the seed motifs of 2 and 4 were used to organize the specificity data.
Fig. S3.
Fig. S3.
Dose–response of 2 and 4. H1-hESCs were treated with two (20 nM and 400 nM) concentrations of 2 or 4 and profiled by COSMIC-qPCR. Genomescapes for each locus are shown for reference. Predicted scores, derived from the summation model, are included for reference. Results are mean ± SEM (n = 2).
Fig. S4.
Fig. S4.
(A) Cellular morphology of H1-hESCs after 24 h of treatment with 0.1% DMSO (vehicle), 400 nM 2 or 400 nM 4. (B) Experimental outline to assess cellular toxicity. Cells were treated for 24 h, beginning on day 0, with the indicated concentration of polyamide. On day 1, cells were exposed briefly (1 min) to 365 nm UV irradiation, or not exposed to UV irradiation, as indicated above. Toxicity was monitored on days 1, 2, and 3. (C) Cell viability after treatment with vehicle, 2, or 4. Results are mean ± SEM (n = 3).
Fig. S5.
Fig. S5.
Reproducibility and specificity of COSMIC-seq in hESCs. (A) Overlap of regions bound by 2 and 4. (B) Heat maps of COSMIC signal centered on the bound regions of 2. (C) Heat maps of COSMIC signal centered on the bound regions of 4. Rep, replicate. Psoralen derivative 6 and DMSO from Anders et al. (48) are included for reference.
Fig. S6.
Fig. S6.
Genome-wide distribution of 2 and 4 at 20 nM shows polyamides bind to loci predicted by genomescapes. (A) Process to generate genomescapes. Genomescapes are generated by assigning an intensity to every 10-bp sequence in the genome from the CSI-SEL data. (B) Examples of 2 and 4 binding loci predicted by genomescapes. Signal tracks show the occupancy of 2 and 4. Tag density is plotted on the y axis (normalized to input DNA and 107 tags). Genomescapes of each polyamide are shown below the COSMIC tracks. (C) Heat maps reveal the selective enrichment of 2 and 4 at top predicted loci. We predicted binding of 2 and 4 to each locus in the genome with a model that incorporates clustered binding, designated the “summation model” (31). (Left) Tag density of each polyamide is shown for the top 1,000 nonoverlapping predicted hairpin loci. (Right) Tag density of each polyamide is shown for the top 1,000 nonoverlapping predicted linear loci. (D) Comparison of the top predicted sites with the bound regions of 2 and 4.
Fig. S7.
Fig. S7.
Distribution of bound regions of 2 and 4 at 20 nM across active and repressive chromatin sites. (A) Polyamides binding to loci in active and repressive chromatin states. Patterns of 2 and 4 compared with patterns of the indicated factors and chromatin states in H1-hESCs. The signal traces are grouped in polyamides (PAs), transcription factors (TFs), RNA polymerase II (Pol2), histone PTMs associated with active chromatin (active), chromatin accessibility as measured by hypersensitivity to the enzyme DNase (DNase HS), and histone PTMs associated with repressive chromatin (repressive) (32). ChromHMM demarcates the genome into one of 12 different chromatin states (legend at bottom of figure) (49). Polyamides 2 and 4 are plotted by normalized tag density (tags per 107 tags normalized to input), and ChIP-seq data are plotted by normalized signal. (B) Polyamide-bound regions distribute across diverse chromatin states. The distribution of the bound regions of 2 and 4 across the 12 different chromatin states is shown. By contrast, chromatin marks, transcription factors, and the chromatin landscape in H1-hESCs are highly biased for particular chromatin states.
Fig. 3.
Fig. 3.
Genome-wide distribution of 2 and 4 shows polyamides bind to loci predicted by genomescapes. (A) Process to generate genomescapes. Genomescapes are generated by assigning an intensity to every 10-bp sequence in the genome from the CSI-SEL data. (B) Examples of 2 and 4 binding loci predicted by genomescapes. Signal tracks showing the occupancy of 2 and 4. Tag density is plotted on the y axis (normalized to input DNA and 107 tags). Genomescapes of each polyamide are shown below the COSMIC tracks. (C) Heat maps reveal the selective enrichment of 2 and 4 at top predicted loci. We predicted binding of 2 and 4 to each locus in the genome with a model that incorporates clustered binding, designated the SOS model (31). (Left) Tag density of each polyamide is shown for the top 1,000 nonoverlapping predicted hairpin loci. (Right) Tag density of each polyamide is shown for the top 1,000 nonoverlapping predicted linear loci. (D) Comparison of the top predicted sites to the bound regions of 2. (E) As in D for the bound regions of 4. (F) Correlation between COSMIC-seq datasets. The bound regions of 2 and 4 from 20 nM and 400 nM treatments were correlated with deepTools.
Fig. S8.
Fig. S8.
Comparison of the genome-wide distribution of 2 and 4 with functional elements. (A) Annotation of peaks across functional elements. Txn, transcription. (B) For each of the two loci in Fig. 3B, we show the signal track of the polyamide not predicted to be bound as a control. (C) Predictions based on scoring loci with a single cognate site do not show enrichment. Heat maps of COSMIC signal for 2 and 4. Here, we scored each locus for only its highest affinity consensus motifs 2 and 4. (Left) Tag density of each polyamide (normalized to input DNA and 107 tags) is shown for the top 1,000 nonoverlapping predicted hairpin loci. (Right) Tag density of each polyamide is shown for the top 1,000 nonoverlapping predicted linear loci.
Fig. 4.
Fig. 4.
Observed bound regions of 2 and 4 show specific enrichment at loci explained by CSI-genomescapes. (A) COSMIC signals from 4, 5, and 6 show no pattern of overlap with loci bound by 2. (B) COSMIC signals from 2, 5, and 6 show no pattern of overlap with loci bound by 4. (C) Specific enrichment of polyamides at bound regions shown by metagene analysis. Psoralen analogs 5 and 6 are not enriched at polyamide-bound regions. The average signal from biological duplicates in 50-bp bins is shown. (D) Bound regions of 2 and 4 are explained by the SOS model. ROC curves of bound regions for 2 and 4 are shown. CSI-derived specificity data of 4 failed to explain binding patterns of 2, and vice versa. The area under the ROC curve (AUC) quantifies the degree to which the SOS model could distinguish bound regions from unbound regions. AUC = 0.5 represents no accuracy, whereas AUC = 1.0 represents perfect accuracy.
Fig. S9.
Fig. S9.
Reproducibility and specificity of 20 nM COSMIC-seq data in hESCs. (A) Overlap of bound regions of 2 or 4, as indicated. Anders et al. (48). (B) Heat maps of COSMIC signal centered on the bound regions of 2. (C) Heat maps of COSMIC signal centered on the bound regions of 4. (D) Locus bound by 2 reveals pervasive low level signal from DMSO and 6* from Anders et al. (48). Psoralen derivative 6 and DMSO from Anders et al. are included for reference.
Fig. 5.
Fig. 5.
Polyamide-based genome readers can access their target sites in active and repressive chromatin sites. (A) Polyamides binding to loci in active and repressive chromatin states. Patterns of 2 and 4 compared with patterns of the indicated factors and chromatin states in H1-hESCs. On the left, the signal traces are grouped in PAs, transcription factors (TFs), RNA polymerase II (Pol2), histone PTMs associated with active chromatin (active), chromatin accessibility as measured by hypersensitivity to the enzyme DNase (DNase HS), and histone PTMs associated with repressive chromatin (repressive) (32). ChromHMM demarcates the genome into one of 12 different chromatin states (49). Polyamides 2 and 4 are plotted by normalized tag density (tags per 107 tags normalized to input DNA), and ChIP-seq data are plotted by normalized signal. (B) Analysis of a repressive region enriched in 2. The locus was profiled by COSMIC-qPCR to verify enrichment of 2. In addition, ChIP was performed to profile the enrichment of the repressive chromatin marks H3K9me3 and H3K27me3. Finally, the expression of the nearby gene, TUSC5, was profiled by RT-PCR. (C) As in B, for a repressive region enriched in binding by 4. The expression of the nearby gene, SLC6A5, was profiled by RT-PCR.
Fig. S10.
Fig. S10.
Validation of polyamide enrichment and chromatin state at several loci. (A) Comparison of signal traces, COSMIC-qPCR validation, ChIP of the repressive marks H3K9me3 and H3K27me3, and gene expression profiling by RT-PCR for several regions enriched in binding by 2 found in repressive or active chromatin states. (B) As in A for loci enriched in binding by 4. As a negative control, a locus near Brachyury (T) was chosen. This locus does not show enrichment for polyamides 2 or 4. We designed the primer pairs to be situated as closely to the bound region of interest as possible, to bind uniquely in the human genome, to enrich amplicons <250 bp, and to avoid the direct amplification of repetitive clustered sites.
Fig. S10.
Fig. S10.
Validation of polyamide enrichment and chromatin state at several loci. (A) Comparison of signal traces, COSMIC-qPCR validation, ChIP of the repressive marks H3K9me3 and H3K27me3, and gene expression profiling by RT-PCR for several regions enriched in binding by 2 found in repressive or active chromatin states. (B) As in A for loci enriched in binding by 4. As a negative control, a locus near Brachyury (T) was chosen. This locus does not show enrichment for polyamides 2 or 4. We designed the primer pairs to be situated as closely to the bound region of interest as possible, to bind uniquely in the human genome, to enrich amplicons <250 bp, and to avoid the direct amplification of repetitive clustered sites.
Fig. S11.
Fig. S11.
Summary of synthetic genome readers binding to different functional elements and chromatin states. Polyamide derivatives 2 and 4 bind introns, promoters, and intergenic regions. Patterns of 20 nM 2 and 4 compared with psoralen analogs 400 nM 5 and 6 as well as chromatin states in hESCs.
Fig. 6.
Fig. 6.
Polyamide binding in diverse chromatin states across the genome. (A) Polyamide-bound regions distribute across diverse chromatin states. The distribution of the bound regions of 2 and 4 across the 12 different chromatin states is shown. By contrast, chromatin marks, transcription factors, and the chromatin landscape in H1-hESCs are highly biased for particular chromatin states (more examples are shown in Fig. S12). CNV, copy number variation; Lo, low; Txn, transcription. (B) Polyamides bind to target sites found within both repressive heterochromatin and euchromatin. Binding is best explained by a model in which clustered sites, composed either of a few high-affinity sequences or of multiple moderate- and weak-affinity sites, exhibit equivalent polyamide occupancies across the genome. In heterochromatin, we show nucleosomes as discs with 146 bp wrapped around the histone octamer. We next show the SOS model in euchromatin.
Fig. S12.
Fig. S12.
Synthetic genome readers distribute across diverse chromatin states. (A) Polyamide derivatives 2 and 4 show distributions across chromatin states that resemble the distributions predicted by CSI-Genomescapes. Distribution of loci predicted to be bound by 2 and 4 across the 12 chromatin states. For reference, the distribution of regions observed by COSMIC-seq is shown. (B) Distribution of 24 endogenous transcription factors across the 12 chromatin states in hESCs (32). (C) Two-tailed Fisher’s exact test confirms that endogenous transcription factors exhibit strong preferences for specific DNase HS sites and chromatin states, whereas 2 and 4 show little preference for DNase HS sites or specific chromatin states. The dashed line indicates a Bonferroni-adjusted P value of 0.0038.

References

    1. Wang D, Lippard SJ. Cellular processing of platinum anticancer drugs. Nat Rev Drug Discov. 2005;4(4):307–320. - PubMed
    1. Hurley LH. DNA and its associated processes as targets for cancer therapy. Nat Rev Cancer. 2002;2(3):188–200. - PubMed
    1. Rodriguez R, Miller KM. Unravelling the genomic targets of small molecules using high-throughput sequencing. Nat Rev Genet. 2014;15(12):783–796. - PubMed
    1. Dervan PB. Molecular recognition of DNA by small molecules. Bioorg Med Chem. 2001;9(9):2215–2235. - PubMed
    1. Dickinson LA, et al. Inhibition of Ets-1 DNA binding and ternary complex formation between Ets-1, NF-kappaB, and DNA by a designed DNA-binding ligand. J Biol Chem. 1999;274(18):12765–12773. - PubMed

Publication types