. 2016 Nov 10:7:13348.
doi: 10.1038/ncomms13348.

Sensing of HSV-1 by the cGAS-STING pathway in microglia orchestrates antiviral defence in the CNS

Affiliations

Sensing of HSV-1 by the cGAS-STING pathway in microglia orchestrates antiviral defence in the CNS

Line S Reinert et al. Nat Commun. .

Abstract

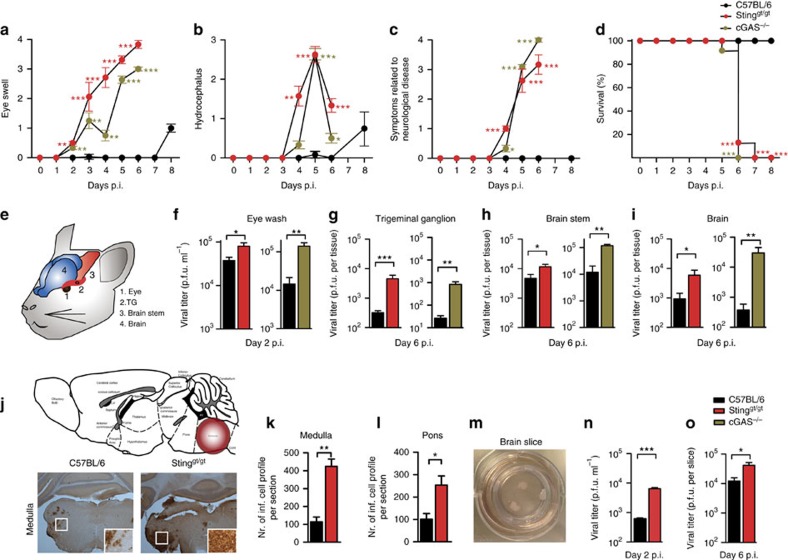
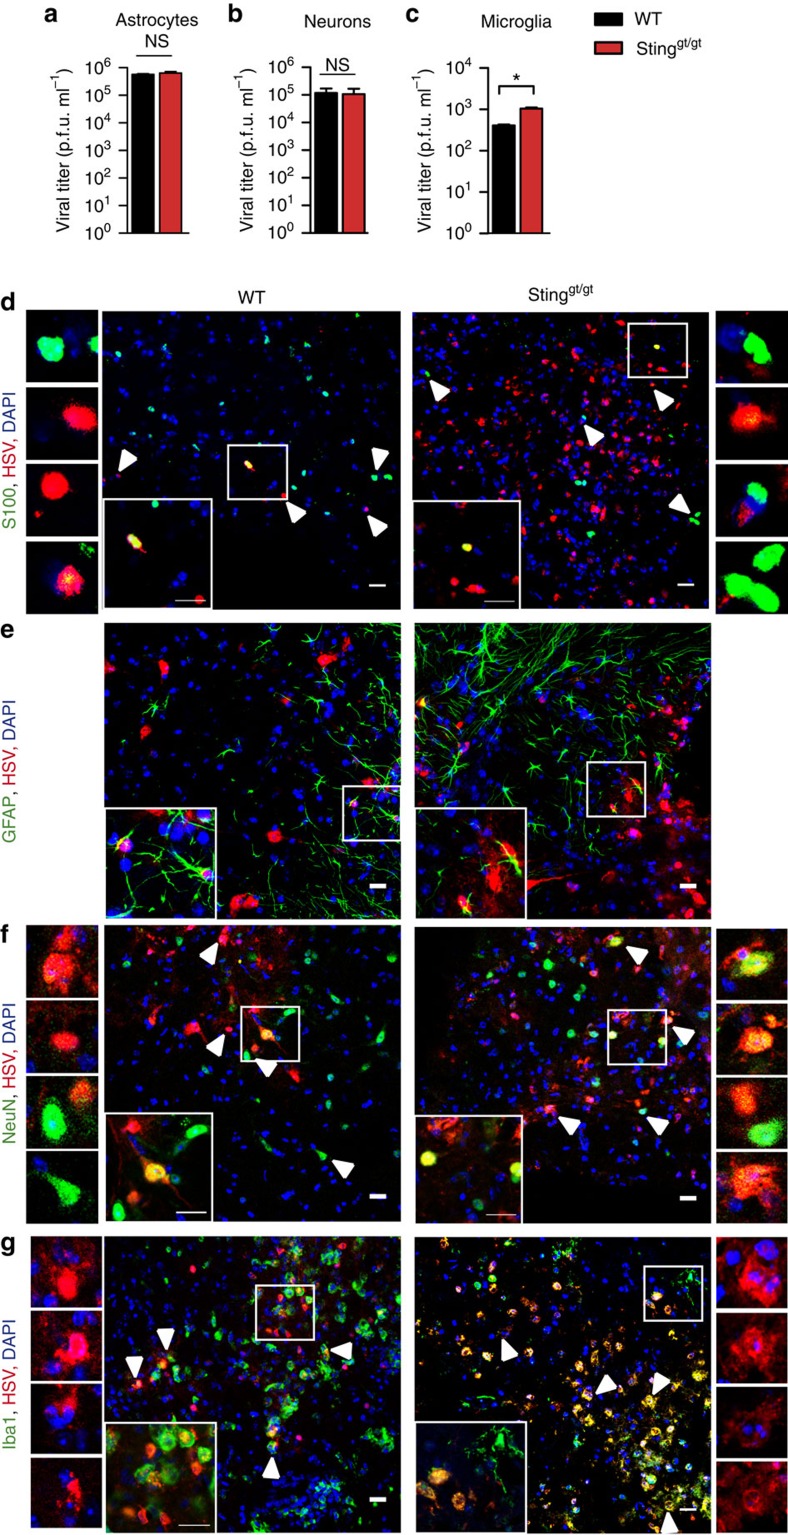
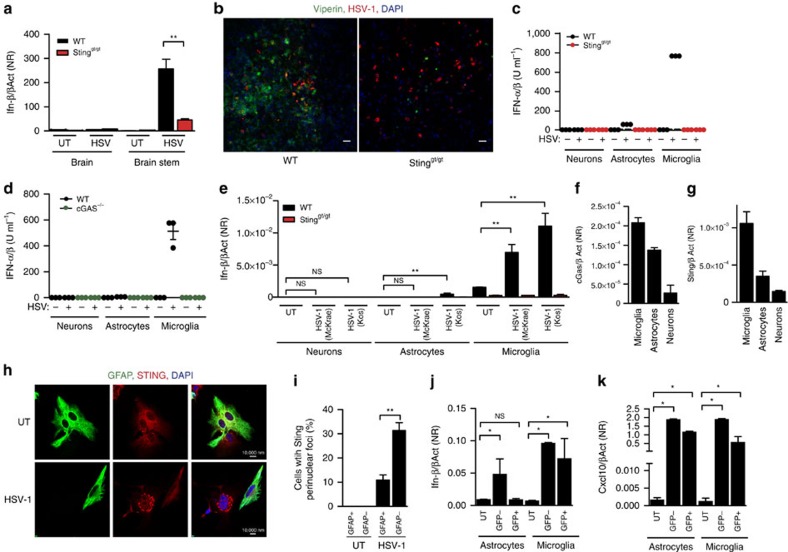
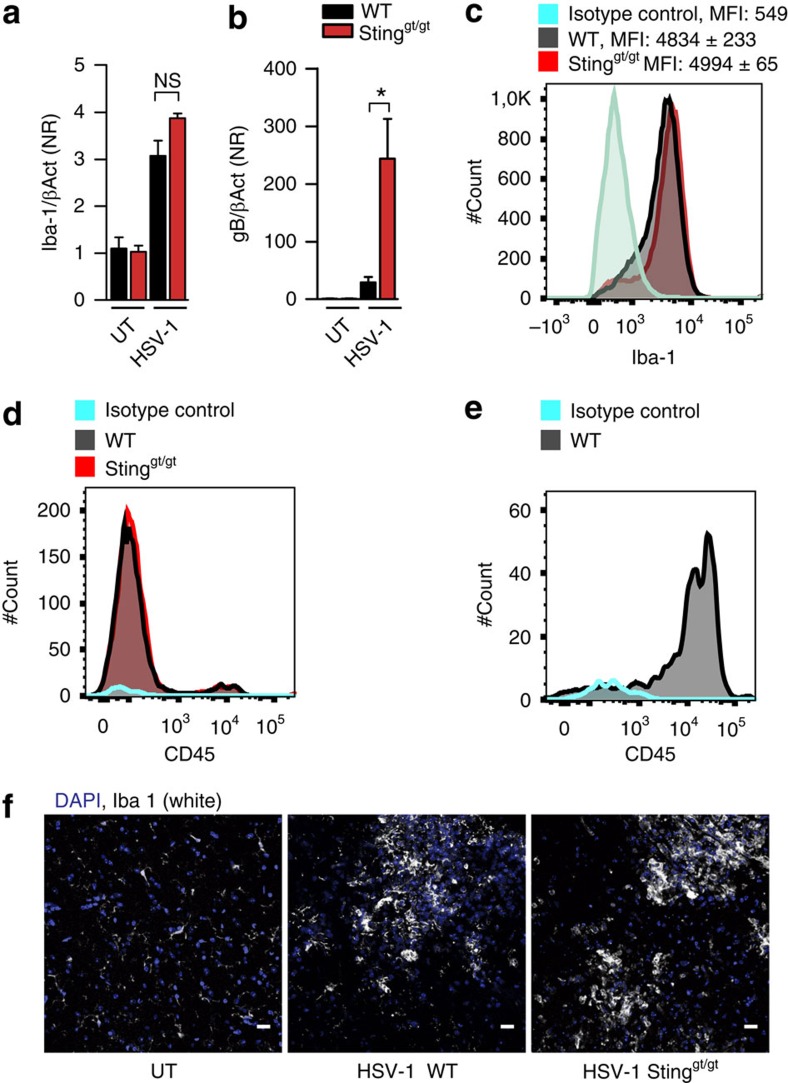
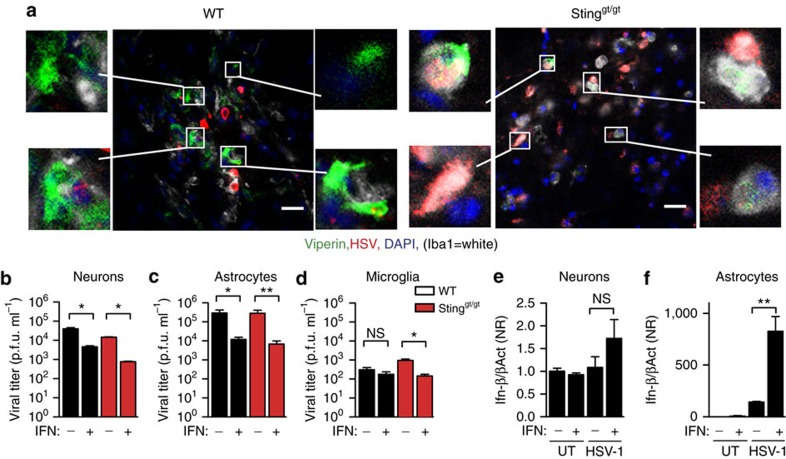
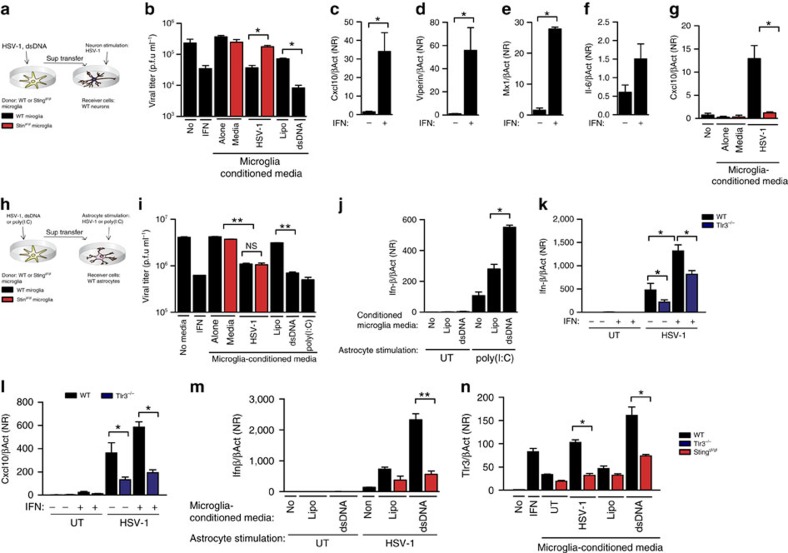
Herpes simplex encephalitis (HSE) is the most common form of acute viral encephalitis in industrialized countries. Type I interferon (IFN) is important for control of herpes simplex virus (HSV-1) in the central nervous system (CNS). Here we show that microglia are the main source of HSV-induced type I IFN expression in CNS cells and these cytokines are induced in a cGAS-STING-dependent manner. Consistently, mice defective in cGAS or STING are highly susceptible to acute HSE. Although STING is redundant for cell-autonomous antiviral resistance in astrocytes and neurons, viral replication is strongly increased in neurons in STING-deficient mice. Interestingly, HSV-infected microglia confer STING-dependent antiviral activities in neurons and prime type I IFN production in astrocytes through the TLR3 pathway. Thus, sensing of HSV-1 infection in the CNS by microglia through the cGAS-STING pathway orchestrates an antiviral program that includes type I IFNs and immune-priming of other cell types.


Figures

Figure 1
Figure 1. Mice deficient in cGAS or STING are susceptible to HSE and exhibit impaired antiviral responses.
Mice were infected in the cornea with 1 × 10⁶ PFU per eye of HSV-1 (strain Mckrae). On subsequent days, animals were scored for (a) eye swelling, (b) hydrocephalus, and (c) symptoms related to neurological disease and (d) survival. (e) Route of virus spread from the eye to the CNS. (fi) Eye washes, trigeminal ganglia, brain stem and brains were isolated on the indicated time points post infection, and viral load was quantified using plaque assay. n=9 mice per group (ai). (j) Tissue section from the brain stem of WT and Stinggt/gt mice infected for 6 days with HSV-1 were stained with anti-HSV-1. n=5-6 mice per group. The original magnifications are 2.5 × and 20 × for the zoomed in images. (kl) The number of HSV-1-positive cells in six tissue sections from the medulla and pons were quantified, and presented as means ± s.e.m. n=3–9 per group. (mo) Organotypic brain slices from WT and Stinggt/gt mice were cultured and infected with 5 × 10³ PFU of HSV-1. The viral load in (n) the culture medium on day 2 and (o) in homogenized brain slices on 6 days post infection was determined by plaque assay. Data are shown as mean values ± s.e.m., n=6–8 wells with three brain slices in each. Symbols for P-values used in the figures: *0.01<P<0.05; **0.001<P<0.01; ***P<0.001; NS, not significant. Red and green asterisks indicate P-values between WT and relevant KO mice at specific days post infection.
Figure 2
Figure 2. STING is essential for restriction of HSV-1 in microglia in vitro and for antiviral control in neurons in vivo.
(ac) Astrocytes, neurons and microglia from WT and Stinggt/gt mice were cultured in vitro and infected with HSV-1 (MOI 1). Supernatants were collected 48 h later and virus was quantified by plaque assay. Data are presented as means ± s.e.m. *0.01<P<0.05; NS, not significant, n=5–8 per group. (dg) Tissue sections from the brain stem of six WT and 6 Stinggt/gt mice isolated 6 days after infection with HSV-1 (1 × 10⁶ PFU per eye) were stained with an antibody against HSV-1 and antibodies against cell-type-specific markers: (d) S100, a nuclear astrocyte marker; (e) GFAP, a fibrillary astrocyte marker; (f) NeuN, neurons; and (g) Iba1, microglia. Scale bar, 20 μm. Cells marked by arrow-heads are magnified in the images to the left and right of the large images in d,f and g. The magnified images in g show staining for HSV-1 and DAPI without the cell-type-specific marker (Iba1).
Figure 3
Figure 3. Microglia utilize the cGAS–STING pathway to mount strong IFN responses to HSV-1 infection.
(a) RNA from brain stem of WT and Stinggt/gt mice infected for 6 days with HSV-1 (1 × 10⁶ PFU per eye) or media alone (UT) were analysed by RT–qPCR for levels of Ifn-β mRNA. (b) Tissue sections of brain stems from WT and Stinggt/gt mice infected for 6 days with HSV-1 were stained with antibodies against viperin and HSV-1. n=5–6 mice per group. (ce) Astrocytes, neurons and microglia from WT, cGas−/− and Stinggt/gt mice were cultured in vitro and infected with HSV-1 (MOI 1). Supernatants or total RNA were collected 24 and 6 h later, respectively. The supernatants were assayed for type I IFN bioactivity, and the RNA was analysed for IFN-β mRNA levels. (c,d) Data are representative of three repeats and are presented as individual measurements. (f,g) Total RNA from purified microglia, astrocytes, and neurons were analysed for expression of cGAS and STING. (h,i) Isolated astrocytes and microglia were mixed and infected with HSV-1. The cells were fixed 4 h later and stained with antibodies against GFAP and STING. (i) Cells with translocation of STING from diffuse to perinuclear foci staining patterns were quantified in GFAP+ (astrocytes) and GFAP (microglia) and presented as means of eight measurements ± s.e.m. (j,k) Mixed cultures of astrocytes and microglia were infected with HSV-1-expressing eGFP driven by the CMV promoter (MOI 3). 6 h later, the cells were sorted into GFP+ and GFP populations, and further sorted into astrocytes and microglia. Total RNA from the four populations was analysed together with uninfected controls for expression of IFN-β and CXCL10. UT, GFP-negative population originating from uninfected mixed cultures. All RT–qPCR data in this figure were normalized to β-actin and presented as means ± s.e.m. n=5–8 per group Symbols for P-values used in the figures: *0.01<P<0.05; **0.001<P<0.01; ***P<0.001; NS, not significant.
Figure 4
Figure 4. Microglia accumulate at sites of infection in the CNS in a STING-independent manner.
(a,b) RNA from brain stem of WT and Stinggt/gt mice infected for 6 days with either HSV-1 (1 × 10⁶ PFU per eye) or media alone (UT) were analysed by RT–qPCR for levels of Iba1 and gB mRNA. The data were normalized to β-actin and are presented as (means ± s.e.m.) fold induction relative to the WT UT. n=3–5 per group. (c,d) Single cells isolated from brain stems of WT and Stinggt/gt mice infected for 6 days with HSV-1 were analysed by flow cytometry for expression of (c) Iba-1 or (d) CD45 staining of CD11b+ sub-gated cells. Data from representative mice from each group is shown together with median fluorescence intensity (MFI) ±s.d. n=6 per group (e) as control for CD45hi staining, CD45 staining of CD11b+ sub-gated splenocytes was performed on a non-infected mouse. (f) Tissue sections of brain stems from WT and Stinggt/gt mice infected for 6 days with HSV-1 or media alone (UT) were stained with an antibody against Iba1, n=4–5 per group, Scale bar, 20 μm.
Figure 5
Figure 5. Dissemination of the IFN response in the infected brain depends on STING.
(a) Tissue sections from the brain stem of WT and Stinggt/gt mice infected for 6 days with HSV-1 (1 × 10⁶ PFU per eye) were stained with an antibody against viperin, HSV-1 and Iba1 (microglia), n=4–6 mice per group. Scale bar, 20 μm. Boxed cells are magnified in the images to the left and right of the large images. (bd) Astrocytes, neurons and microglia from WT and Stinggt/gt mice were cultured in vitro, treated with IFN-α/β (25 U ml−1) and infected with HSV-1 (MOI 1). Supernatants were isolated 48 h later, and virus yield was measured by plaque assay. Data are presented as means ± s.e.m., n=5–8. (e,f) Neurons and astrocytes were cultured in vitro and treated with IFN-α/β (25 U ml−1) and infected with HSV-1 (MOI 1). Total RNA was isolated 6 h later and analysed for IFN-β mRNA levels. Data are normalized to β-actin levels and are presented as (means ± s.e.m.) fold induction relative to the WT UT, n=5–8 per group Symbols for P-values used in the figures: *0.01<P<0.05; **0.001<P<0.01; ***P<0.001; NS, not significant.
Figure 6
Figure 6. Microglia induce STING dependent antiviral programs in neurons and prime the TLR3 pathway in astrocytes.
(a,h) Illustration of a cellular model used to study intercellular communication between cells of the CNS. Supernatants from WT or Stinggt/gt microglia cultures treated for 24 h with HSV-1 (MOI 1), Lipofectamine, dsDNA (2 μg ml−1) or poly(I:C) (5 μg ml−1) were ultraviolet-inactivated and transferred to (b,g) neuron and (i,j,m,n) astrocyte cultures. Some cultures received IFN-α/β (25 U ml−1) or medium alone. After pretreatmet with microglia supernatants or IFN-α/β for 17 h (b,i) the neuron and astrocyte cultures were infected with HSV-1 (MOI 1). Supernatants were harvested 48 h later and virus yield was measured by plaque assay. (cg) Total RNA from neuron cultures stimulated with IFN-α/β (25 U ml−1) for 17 h was analysed for expression of (ce) the ISGs Cxcl10, viperin, Mx1 and (f) the inflammatory cytokine Il6. (g) Total RNA from neuron cultures stimulated with conditioned media from untreated or HSV-1-infected microglia was analysed for expression of Cxcl10 by RT–qPCR. (j) Astrocytes pretreated with the indicated conditioned microglia media were stimulated with extracellular poly(I:C) (5 μg ml−1) for 6 h, total RNA was isolated and Ifnβ mRNA was measured. (k,l) WT and TLR3−/− astrocyte cultures were treated with IFN-α/β (25 U ml−1) and infected with HSV-1 (MOI 1). Total RNA was isolated 6 h later and analysed for levels of Ifn-β and Cxcl10 mRNA. (m) Supernatants from WT and Stinggt/gt microglia cultures were transferred to WT astrocytes, which were stimulated with HSV-1 (MOI 1) for 6 h. Total RNA was isolated and levels of Ifn-β were measured. (n) The WT astrocytes were stimulated with IFN-α/β (25 U ml−1) or supernatants from microglia stimulated with dsDNA or HSV-1, 6 h after the TLR3 mRNA were measured. Data are presented as means ±s.e.m. All RT–qPCR data in this figure were normalized to β-actin levels and are presented as (means ± s.e.m.) fold induction relative to the WT UT. Symbols for P-values used in the figures: *0.01<P<0.05; **0.001<P<0.01; ***P<0.001; NS, not significant, n=5–8 per group.

Similar articles

Cited by

References

    1. Roizman B., Knipe D. M. & Whitley R. J. Herpes simplex viruses in Fields Virology. eds Knipe D. M., Howley P. M. 2501–2602Lippincott, Williams and Wilkins (2007).
    1. Paludan S. R., Bowie A. G., Horan K. A. & Fitzgerald K. A. Recognition of herpesviruses by the innate immune system. Nat. Rev. Immunol. 11, 143–154 (2011). - PMC - PubMed
    1. McNab F., Mayer-Barber K., Sher A., Wack A. & O'Garra A. Type I interferons in infectious disease. Nat. Rev. Immunol. 15, 87–103 (2015). - PMC - PubMed
    1. Goubau D., Deddouche S. & Reis e Sousa C. Cytosolic sensing of viruses. Immunity 38, 855–869 (2013). - PMC - PubMed
    1. Paludan S. R. Activation and regulation of DNA-driven immune responses. Microbiol. Mol. Biol. Rev. 79, 225–241 (2015). - PMC - PubMed

Publication types

MeSH terms

LinkOut - more resources