. 2016 Nov 10:7:13325.
doi: 10.1038/ncomms13325.

Theranostic barcoded nanoparticles for personalized cancer medicine

Affiliations

Theranostic barcoded nanoparticles for personalized cancer medicine

Zvi Yaari et al. Nat Commun. .

Abstract

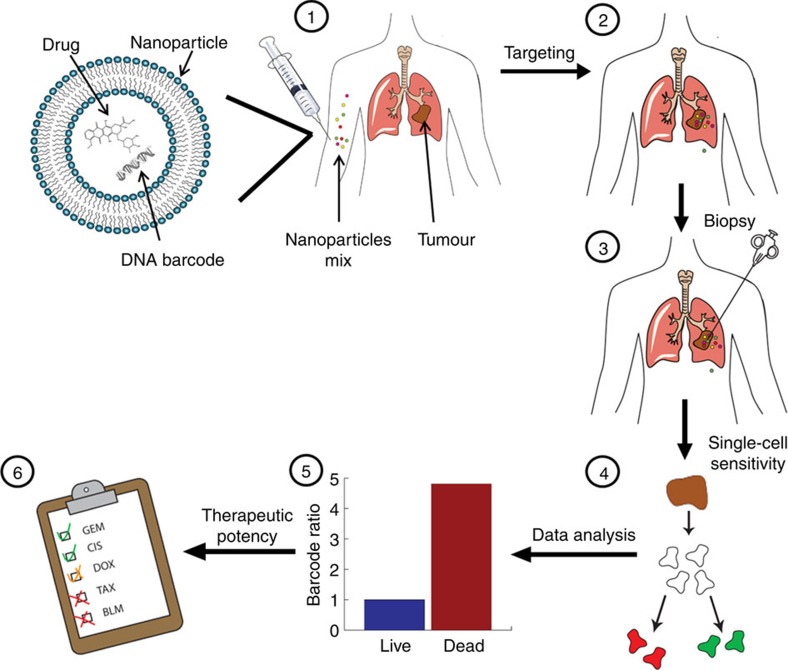
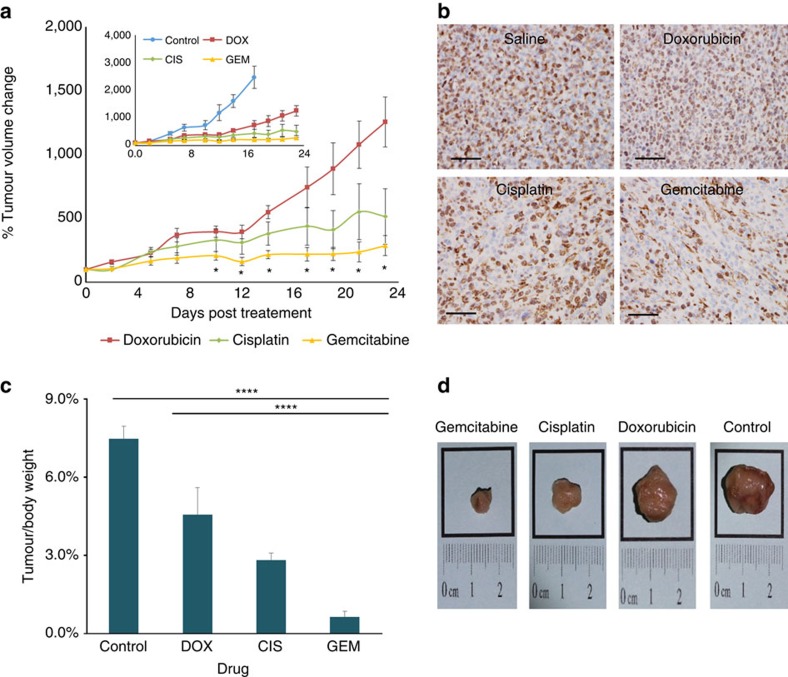
Personalized medicine promises to revolutionize cancer therapy by matching the most effective treatment to the individual patient. Using a nanoparticle-based system, we predict the therapeutic potency of anticancer medicines in a personalized manner. We carry out the diagnostic stage through a multidrug screen performed inside the tumour, extracting drug activity information with single cell sensitivity. By using 100 nm liposomes, loaded with various cancer drugs and corresponding synthetic DNA barcodes, we find a correlation between the cell viability and the drug it was exposed to, according to the matching barcodes. Based on this screen, we devise a treatment protocol for mice bearing triple-negative breast-cancer tumours, and its results confirm the diagnostic prediction. We show that the use of nanotechnology in cancer care is effective for generating personalized treatment protocols.


Figures

Figure 1
Figure 1. Using nanotechnology to probe the sensitivity of cancer to medicines.
Barcoded nanoparticles (BNPs) were loaded with different drugs and corresponding DNA barcodes. (1) A cocktail of BNPs was injected intravenously. (2) The BNPs targeted the tumour and each of the drugs carried out its therapeutic activity inside different tumour cells. (3) Forty-eight hours later, a biopsy was taken from the tumour, and the biopsied tissue was dissociated into a single-cell suspension. (4) Each of the cells was sorted according to its viability (live/dead). (5) The barcodes were extracted from the live/dead cells and amplified using real-time PCR. The codes were detected by sequencing. The activity of the drugs inside the tumour was analysed by recording the number of each barcode found in the live cells, versus the number of barcodes found inside the dead cells. In this manner, the orthotropic tumour was used as a miniature laboratory, which was diagnosed with the nanoparticles at a cellular level. (6) Based on the screened results, a suggested treatment protocol was devised. In our studies, we found this predictive assay to achieve the best therapeutic results. The overall diagnosis takes less than 72 h.
Figure 2
Figure 2. DNA was used as a barcode for labelling and detecting nanoparticles in single cells.
Synthetic DNA strands were embedded in 100 nm liposome together with a corresponding drug. (a) The barcodes were constructed to be in the range of 50 to 120 bp long, and detected using PCR and sequencing. Barcoded nanoparticles were taken up spontaneously by triple-negative breast cancer cells in culture and in tumours. (b) Gel electrophoresis of PCR-amplified barcodes derived from 100 cells, and (c) from a single cell. (d) Different strand lengths of barcodes (50, 85, 120 bp) can be detected within a single-cell suspension. Negative control wells are designated NC, and repeats are numbered 1–3. (e) A confocal microscopy image of uptake of BNPs by a triple-negative breast cancer 4T1 cell labelled for membrane (red), nucleus (blue) and DNA barcodes (green). The single-cell uptake of barcoded nanoparticles is not affected by the cargo (f). Barcoded nanoparticles, all 100 nm in diameter but loaded with different cargo, were added to triple-negative breast cancer cells in culture, or injected intravenously into tumour-bearing mice. To ensure the uptake of multiple particles per cell, a dose 1,000 times higher than that used for the diagnostic procedure was administered. The cells were collected from the dish (after 24 h), or a biopsy was taken from the tumour (after 48 h). The tissue was then dissociated, and 60 individual cells were examined for the presence of each of the different barcodes. Each cell contained a similar number of each of the barcodes, indicating that the internal payload of the nanoparticles does not affect their cellular uptake. The data were calculated as the mean±s.e.m. of n=60.
Figure 3
Figure 3. Barcoded nanoparticles accumulate in triple-negative breast cancer tumour cells.
Barcoded nanoparticles, containing the diagnostic imaging agent indocyanine green (ICG), were injected intravenously to BALB/c mice bearing a tumour in their hind leg. The animals were imaged over 48 h: before the injection (a), 24 h (b) and 48 h after the injection (c). The fluorescent ICG intensity is presented by the red–yellow scale bar on the right side of each sub-figure. The left mouse on each figure is a healthy control and all the animals to the right are tumour-bearing mice; all animals were injected with 150 μl of barcoded ICG nanoparticles. After 48 h, the tumour was resected and examined histologically. The tumour tissue was stained with haematoxylin and eosin stain (H&E) (d). The tumour is closely packed where three major parts can be observed: necrotic tissue (1), multiple blood vessels that contribute to the EPR effect (2) and cancerous cells (3). To detect the liposomal accumulation in the tumour tissue, an overlay fluorescent image is presented (e); the cell nuclei were stained with DAPI (blue) and the particles with rhodamine (red). To detect the barcoded nanoparticles in single cells within the tumour, the barcode was labelled with fluorescein (f, green) and the particle membrane was labelled with rhodamine (g, red). Co-localization of the barcodes and the particles can be seen inside single cells (hk). The scale bar in the histology images represents 100 μm, in the fluorescent images 50 μm (eg) and in the fluorescent single cells 10 μm (hk).
Figure 4
Figure 4. Predicting the therapeutic potency of multiple drugs using barcoded nanoparticles.
Mice bearing triple-negative breast cancer tumours were administered five different barcoded nanoparticles, simultaneously. The nanoparticles contained either one of the anticancer agents: doxorubicin, gemcitabine or cisplatin, or were loaded with caffeine, or empty (barcode alone). The barcoded nanoparticle cocktail was injected intravenously and accumulated in the tumour cells over a period of 48 h. After 48 h, the tumour tissue was biopsied and dissociated into single cells. The cells were sorted according to their viability (live/dead) and the barcodes in each of these populations were extracted, analysed and quantified using RT–PCR and sequencing. The activity of each of the agents was measured at the single-cell level; data from 80 representative cells are shown (a,b). A noise level below 20% was set as the threshold for determining the activity of a single agent at the single-cell level. In addition, (c) the overall activity of each of the agents in the tumour was determined by analysing the barcode abundance in groups of at least three million live or dead cells. (d) To compare between the potency of the different drugs, a potency scale was plotted. The comparative potency is based on the ratio of barcodes found in the dead cells to those found in live cells. On the basis of this comparative diagnostic scale, a treatment protocol was devised. To ensure statistical significance, each screen was based on at least three million cells extracted from the tumour. The data were calculated as the mean±s.e.m. of n=6, in two independent experimental replicates.
Figure 5
Figure 5. Treating mice according to the barcode analysis.
Based on the barcoded nanoparticle drug screen, a treatment protocol was devised. Mice bearing triple-negative breast cancer tumours were administered doxorubicin, gemcitabine, cisplatin or saline (control). Tumour growth (a) was recorded and postmortem resection (c) and histology (b) of each of the groups was performed. Each group received a therapeutic weekly dose of chemotherapy—doxorubicin (5 mg kg−1), cisplatin (6 mg kg−1) or gemcitabine (125 mg kg−1), while the control group was administered saline. The tumours were resected 23 days after starting the treatment. Tissue slides (b) were immunohistochemically stained with rabbit monoclonal anti-Ki67 antibody to compare the proliferation rate of each group. These show a reduction in the proliferation rate in the gemcitabine-treated tumours compared with the other groups. The data were calculated as the mean±s.e.m. of n=6 per group; *P<0.01; ****P<0.0001. Differences between the two means were tested using an unpaired, two-sided Student's t-test. The efficacy of the treatment is also shown in the tumour size (d), thereby indicating the potency of the treatment. Before introducing the treatment, all the mice had the same average tumour size.

Comment in

References

    1. Symmans W. F. et al.. Measurement of residual breast cancer burden to predict survival after neoadjuvant chemotherapy. J. Clin. Oncol. 25, 4414–4422 (2007). - PubMed
    1. Thomas E. et al.. The use of alternate, non-cross-resistant adjuvant chemotherapy on the basis of pathologic response to a neoadjuvant doxorubicin-based regimen in women with operable breast cancer: long-term results from a prospective randomized trial. J. Clin. Oncol. 22, 2294–2302 (2004). - PubMed
    1. Buzdar A. U. et al.. Prospective evaluation of paclitaxel versus combination chemotherapy with fluorouracil, doxorubicin, and cyclophosphamide as neoadjuvant therapy in patients with operable breast cancer. J. Clin. Oncol. 17, 3412–3417 (1999). - PubMed
    1. Roxbury D. et al.. Hyperspectral microscopy of near-infrared fluorescence enables 17-chirality carbon nanotube imaging. Sci. Rep. 5, 14167 (2015). - PMC - PubMed
    1. Sotiriou C. & Piccart M. J. Taking gene-expression profiling to the clinic: when will molecular signatures become relevant to patient care? Nat. Rev. Cancer. 7, 545–553 (2007). - PubMed

Publication types

MeSH terms