. 2016 Nov 10:7:13270.
doi: 10.1038/ncomms13270.

Rapid construction of a whole-genome transposon insertion collection for Shewanella oneidensis by Knockout Sudoku

Affiliations

Rapid construction of a whole-genome transposon insertion collection for Shewanella oneidensis by Knockout Sudoku

Michael Baym et al. Nat Commun. .

Abstract

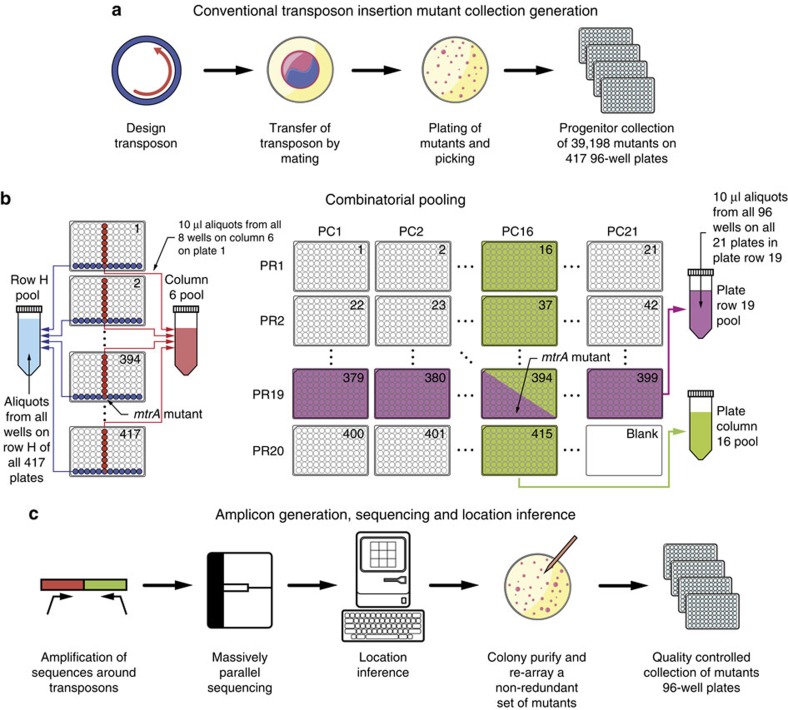
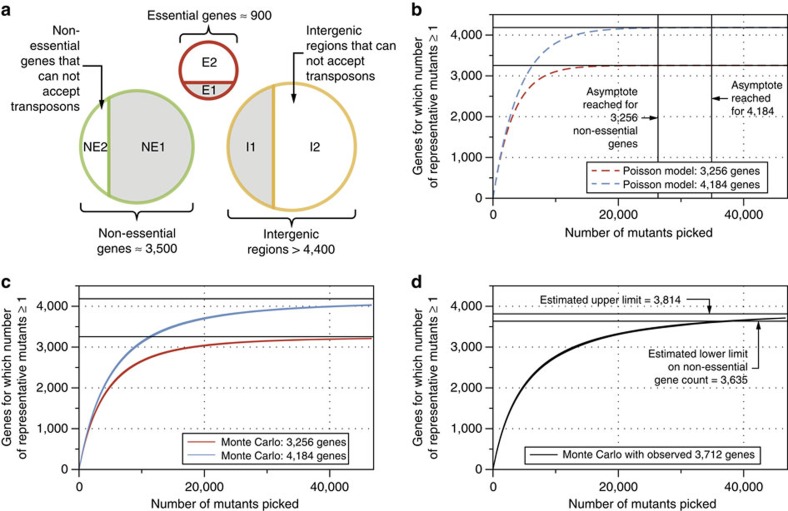
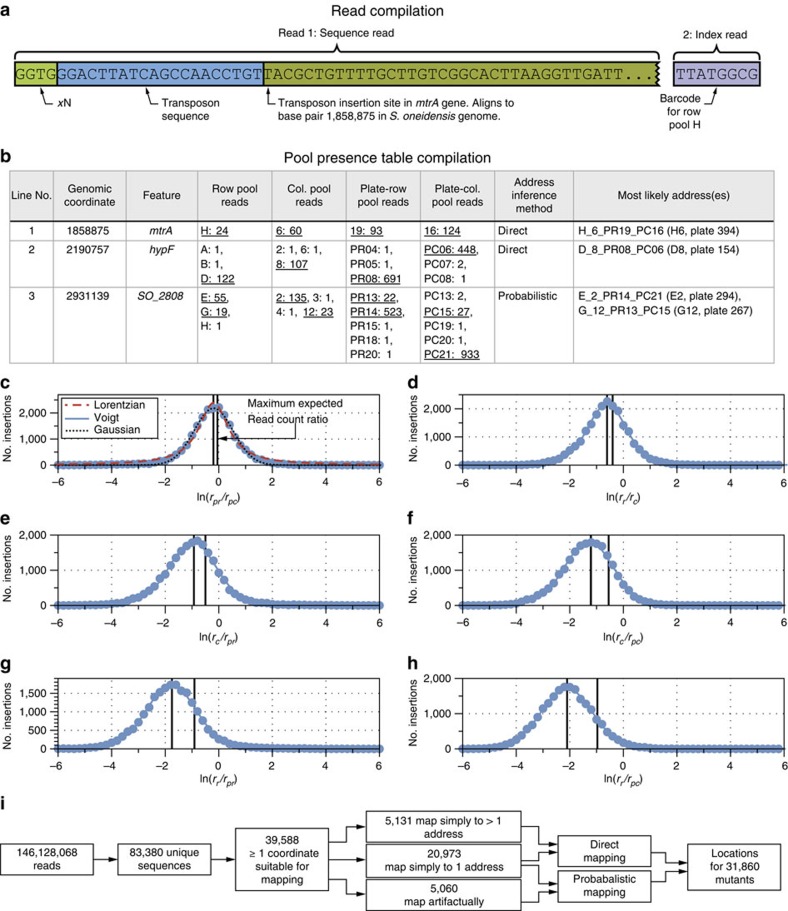
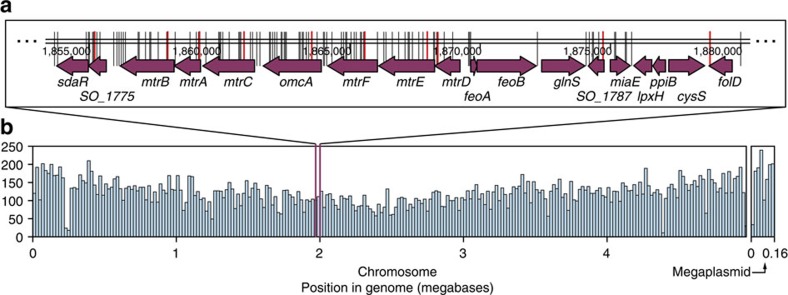
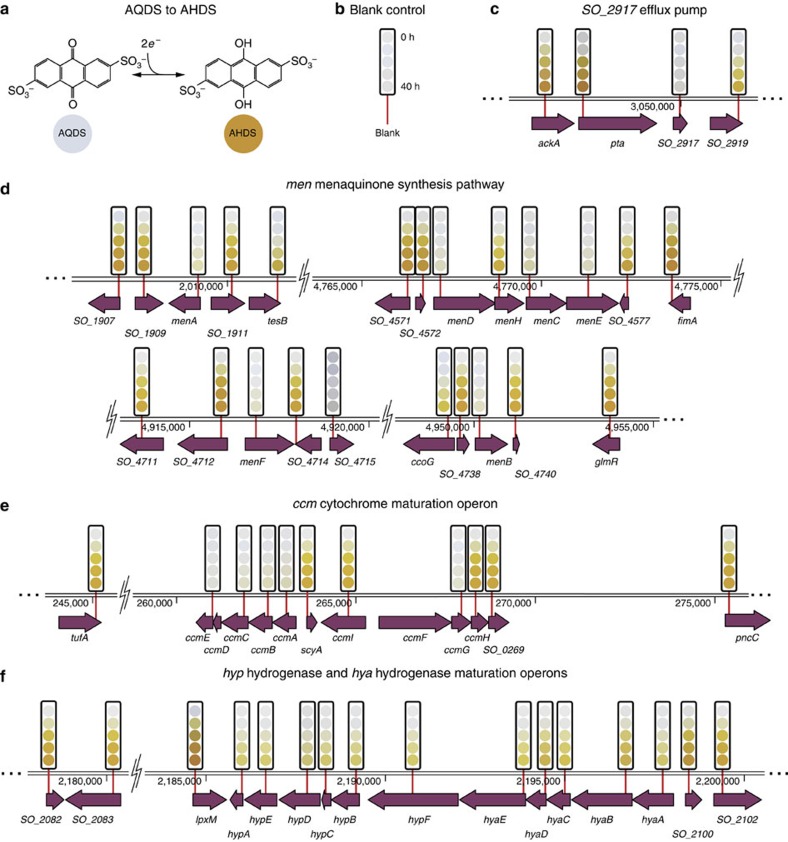
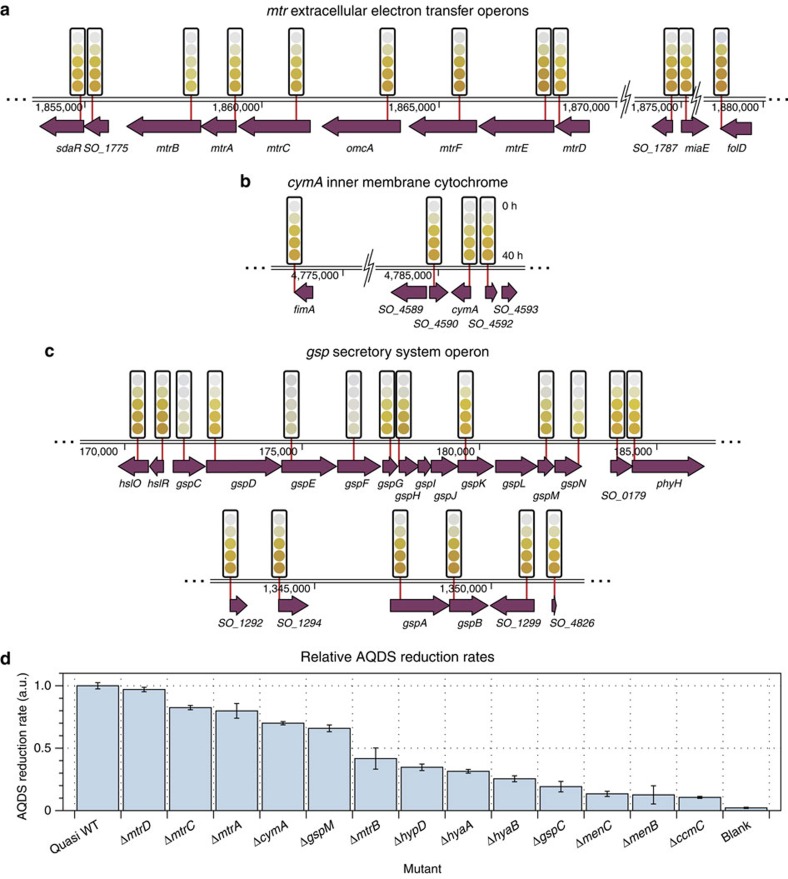
Whole-genome knockout collections are invaluable for connecting gene sequence to function, yet traditionally, their construction has required an extraordinary technical effort. Here we report a method for the construction and purification of a curated whole-genome collection of single-gene transposon disruption mutants termed Knockout Sudoku. Using simple combinatorial pooling, a highly oversampled collection of mutants is condensed into a next-generation sequencing library in a single day, a 30- to 100-fold improvement over prior methods. The identities of the mutants in the collection are then solved by a probabilistic algorithm that uses internal self-consistency within the sequencing data set, followed by rapid algorithmically guided condensation to a minimal representative set of mutants, validation, and curation. Starting from a progenitor collection of 39,918 mutants, we compile a quality-controlled knockout collection of the electroactive microbe Shewanella oneidensis MR-1 containing representatives for 3,667 genes that is functionally validated by high-throughput kinetic measurements of quinone reduction.


Conflict of interest statement

M.B., L.S., I.A., O.A. and B.B are seeking patent protection for the probabilistic reconstruction algorithm used in the Knockout Sudoku method.

Figures

Figure 1
Figure 1. Workflow for creation of the quality-controlled S. oneidensis Sudoku collection by Knockout Sudoku.
(a) A massively oversampled mutant collection is created by conventional transposon mutagenesis. (b) Combinatorial pooling is used to prepare mutant libraries for barcoding. (c) Mutants are located by construction of a next-generation sequencing library by amplicon generation and barcoding, next-generation sequencing, mutant location inference, mutant selection and construction of a quality-controlled mutant collection.
Figure 2
Figure 2. Model of transposon insertion.
(a) Genome feature type breakdown for S. oneidensis. Regions of the genome (essential genes, non-essential genes and intergenic regions) into which transposons can be inserted (E1, NE1 and I1) are coloured grey. (b) Estimate number of genes for which the number of representative mutants ≥1 (represented gene count) as a function of mutant collection size by a Poisson model for genomes with 3,256 (red lines) and 4,184 (blue lines) non-essential genes. (c) Estimate of represented gene count by a Monte Carlo model for genomes with 3,256 (red curves) and 4,184 non-essential genes (blue curves). The centre of the solid curves is the mean value of the unique gene disruption count from 1,000 simulations while the upper and lower curves represent two standard deviations around this mean. (d) Estimate of represented gene count using a random drawing without replacement from the observed set of transposon insertion mutants. The centre of the solid curves is the mean value of the unique gene disruption count from 1,000 simulations, while the upper and lower curves represent two s.d.s around this mean.
Figure 3
Figure 3. Knockout Sudoku sequence data analysis.
(a) Reduction of read data to transposon insertion coordinates and pool barcode identities. (b) Compilation of pool presence table that summarizes pool barcodes of reads aligning to each genomic coordinate. Validations of predictions in lines 2 and 3 can be found in Supplementary Data 3. (ch) Distribution of read count ratios for pool presence table lines that unambiguously map to single addresses (line 1). (c) Plate-row (pr) to plate-column (pc) and comparison of log-Voigt, Gaussian and Lorentzian fits for the read count ratio distribution; (d): row (r) to column (c); (e) column to plate-row; (f) column to plate-column; (g) row to plate-row; (h) row to plate-column. The maximum read count ratios that would be expected for uncorrelated underlying read count distributions are marked as vertical dashed lines in ch (Supplementary Data 2). (i) Condensation of sequencing reads to mutant addresses.
Figure 4
Figure 4. Location of transposon mutants in progenitor collection.
(a) Map of locations of transposons in the progenitor collection (black lines) and those chosen for the quality-controlled collection (red lines) in the vicinity of the mtrCAB and mtrDEF extracellular electron transport operons. It is important to note that the chosen mutant was not always the one closest to the translation start, as in a number of cases our selection algorithm (Methods) estimated that the benefits to gene disruption were outweighed by the difficulties of isolation. (b) Histogram showing the density of transposons in the progenitor S. oneidensis Sudoku collection (bin width is 20,000 base pairs).
Figure 5
Figure 5. Gene disruptions that change AQDS reduction rate.
(a) AQDS (anthraquinone-2,6-disulfonate) redox reaction. AQDS changes colour from clear to orange when reduced. (b) Blank control. (cf) Selected gene disruptions that produce changes to AQDS reduction rate that are observable to the unaided eye. The state of the AQDS dye at 10 h intervals is indicated by a series of coloured circles above the location of the transposon chosen to disrupt each gene (Methods).
Figure 6
Figure 6. Gene disruptions that change AQDS reduction rate.
(ac) AQDS reduction screen results showing gene disruptions that produce small but detectable changes in AQDS reduction rate. (d) Linear AQDS reduction rates of selected mutants relative to an averaged quasi wild-type (WT) control (Methods). Error bars are the s.d. of three replicates. A full listing of rates for all mutants can be found in Supplementary Data 6.

References

    1. Sydow A., Krieg T., Mayer F., Schrader J. & Holtmann D. Electroactive bacteria--molecular mechanisms and genetic tools. Appl. Microbiol. Biotechnol. 98, 8481–8495 (2014). - PubMed
    1. Heidelberg J. F. et al.. Genome sequence of the dissimilatory metal ion–reducing bacterium Shewanella oneidensis. Nat. Biotechnol. 20, 1118–1123 (2002). - PubMed
    1. Calas G. & McMillan P. F. Environmental mineralogy: new challenges, new materials. Elements 11, 247–252 (2015).
    1. Fredrickson J. K. et al.. Towards environmental systems biology of Shewanella. Nat. Rev. Microbiol. 6, 592–603 (2008). - PubMed
    1. Tiedje J. M. Shewanella--the environmentally versatile genome. Nat. Biotechnol. 20, 1093–1094 (2002). - PubMed

Publication types

Substances