. 2016 Nov 10;539(7628):242-247.
doi: 10.1038/nature20111.

Evolution of Osteocrin as an activity-regulated factor in the primate brain

Affiliations

Evolution of Osteocrin as an activity-regulated factor in the primate brain

Bulent Ataman et al. Nature. .

Abstract

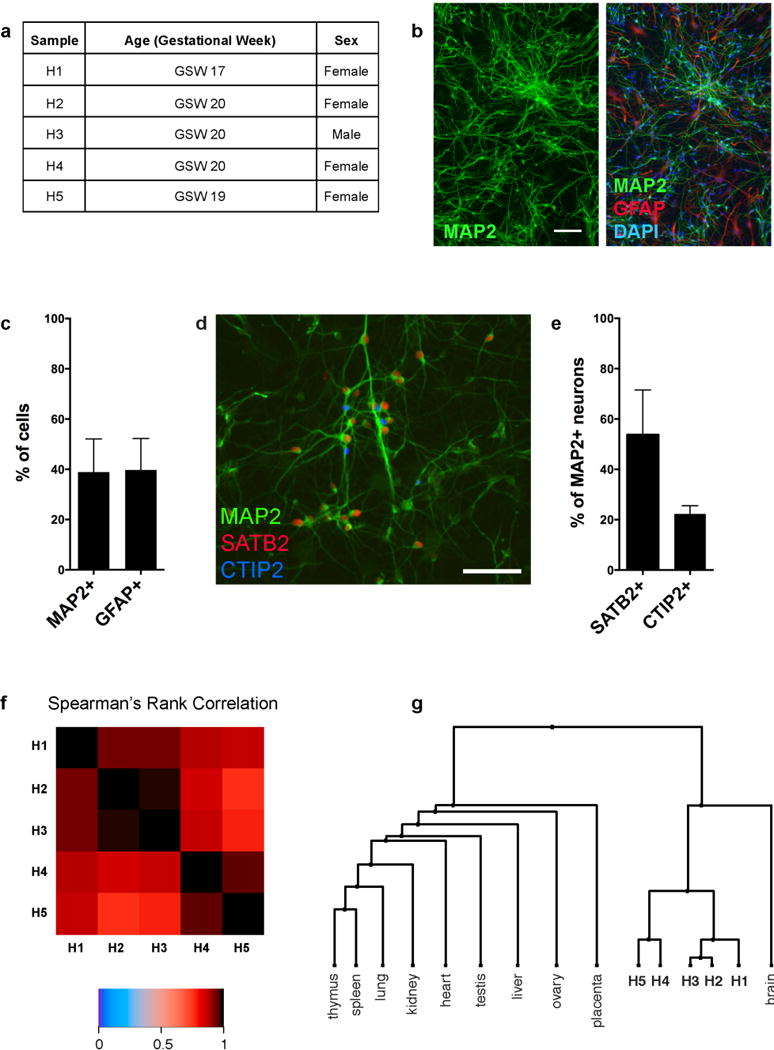
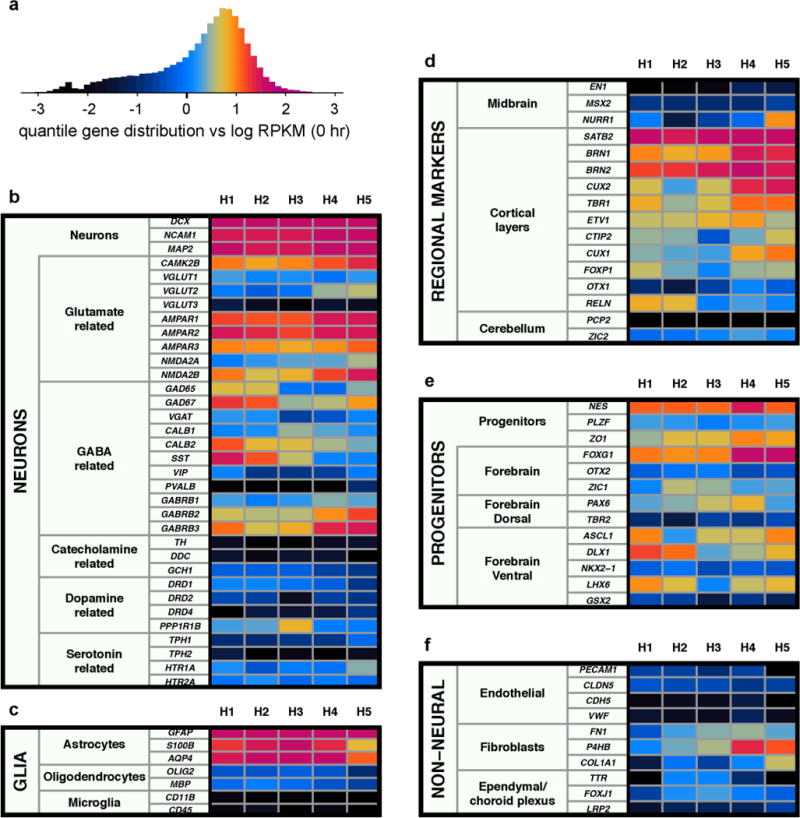
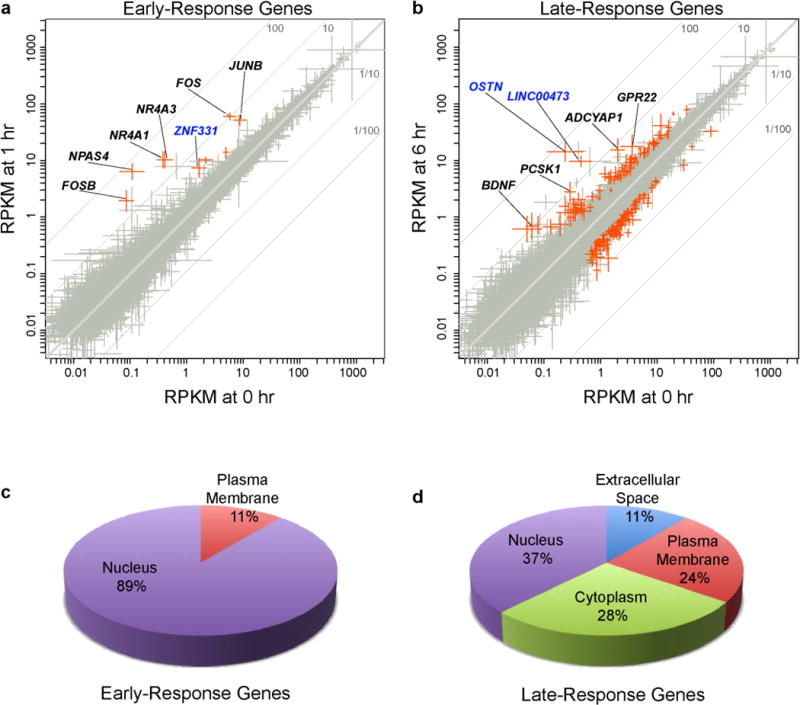
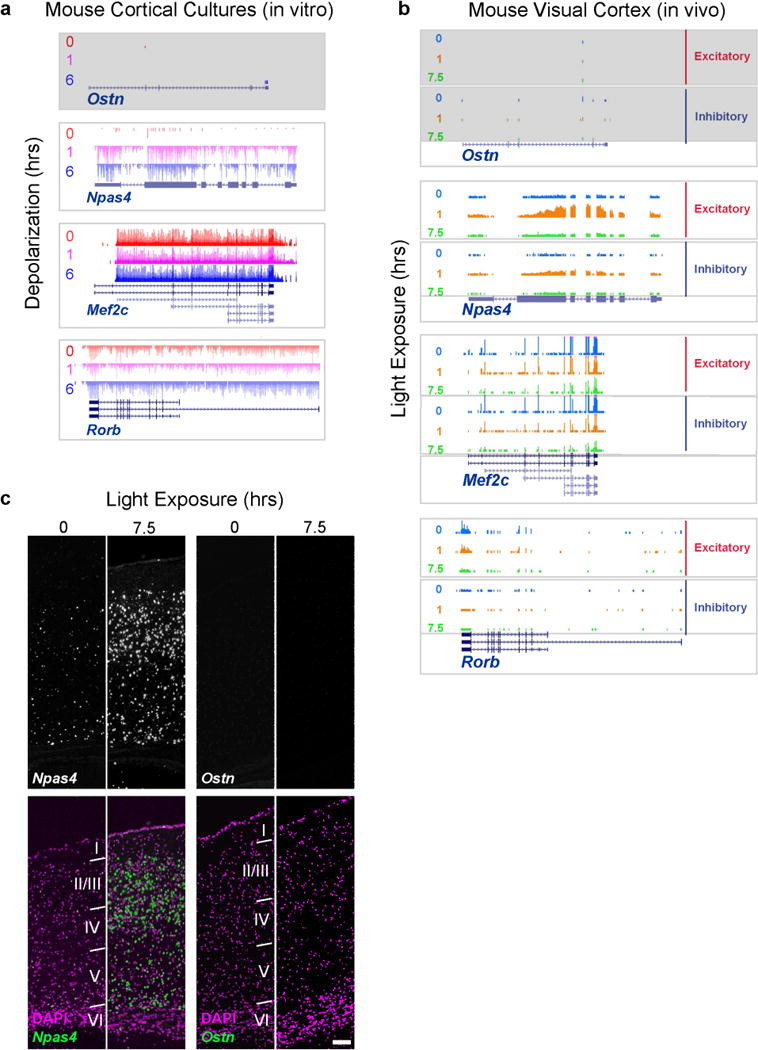
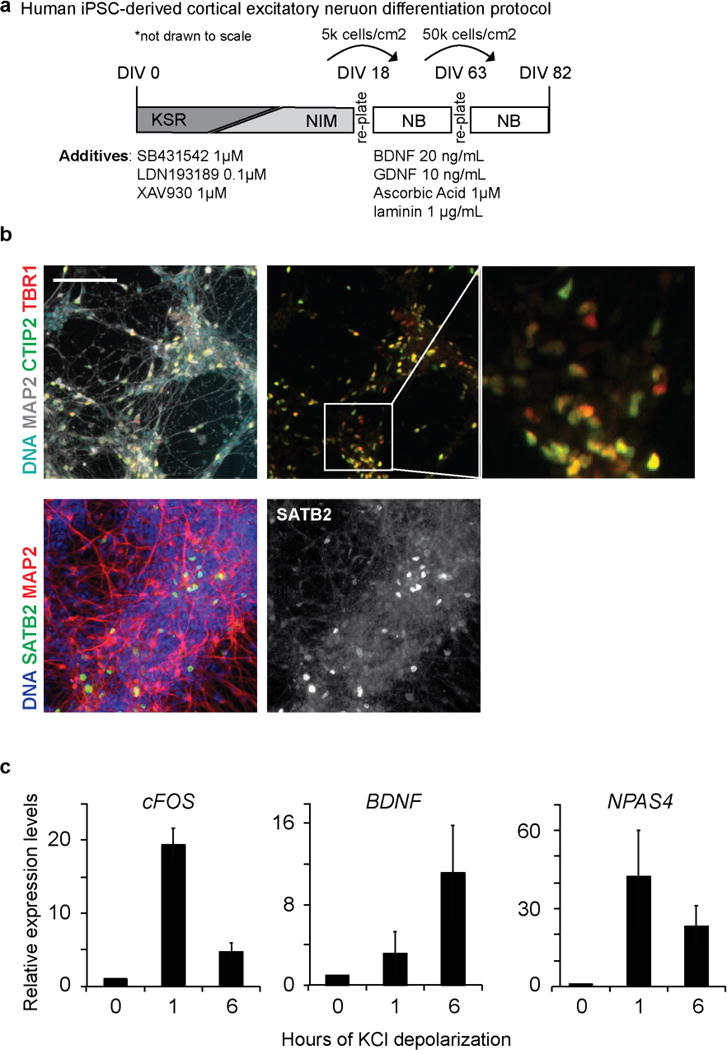
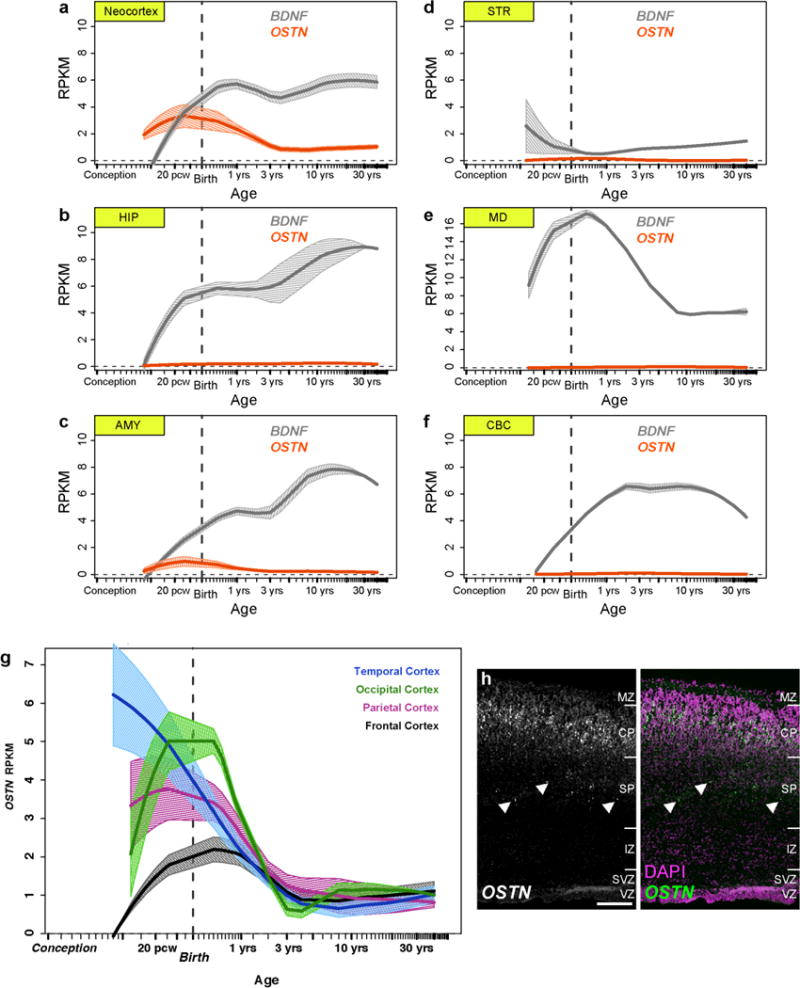
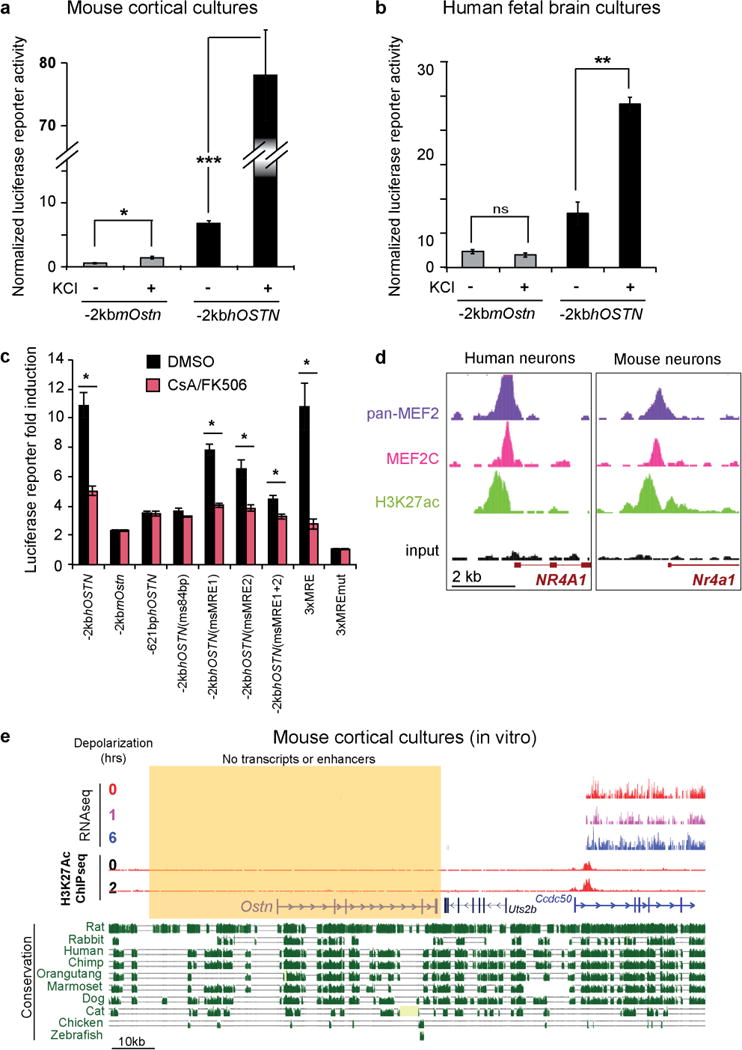
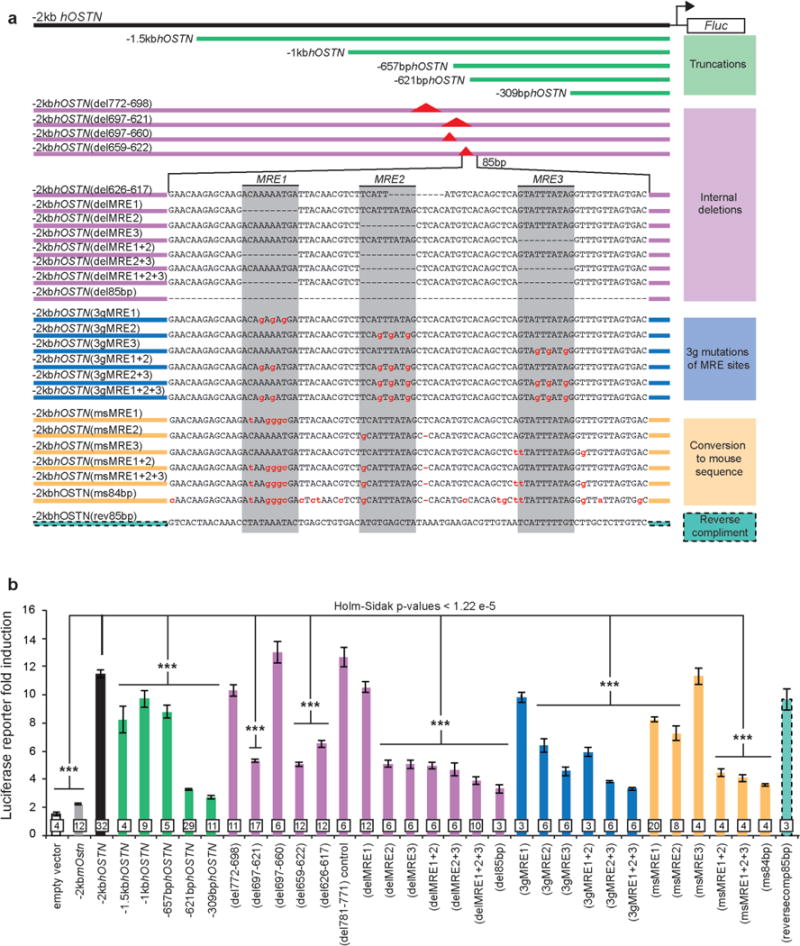
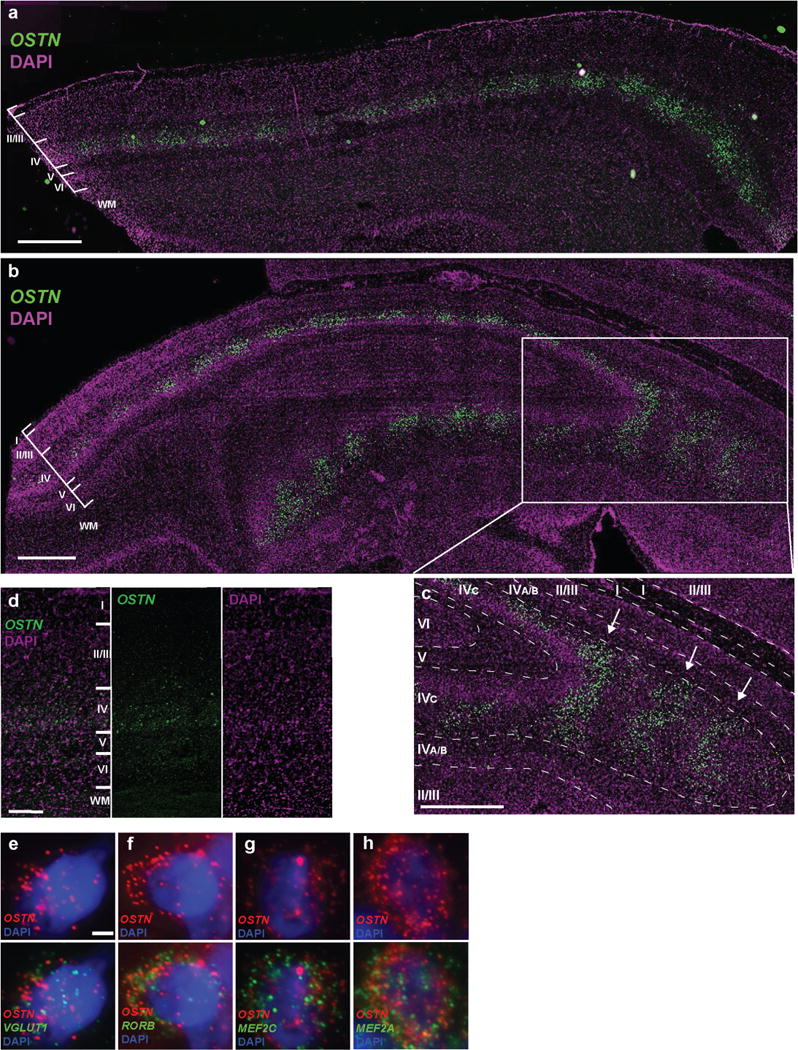
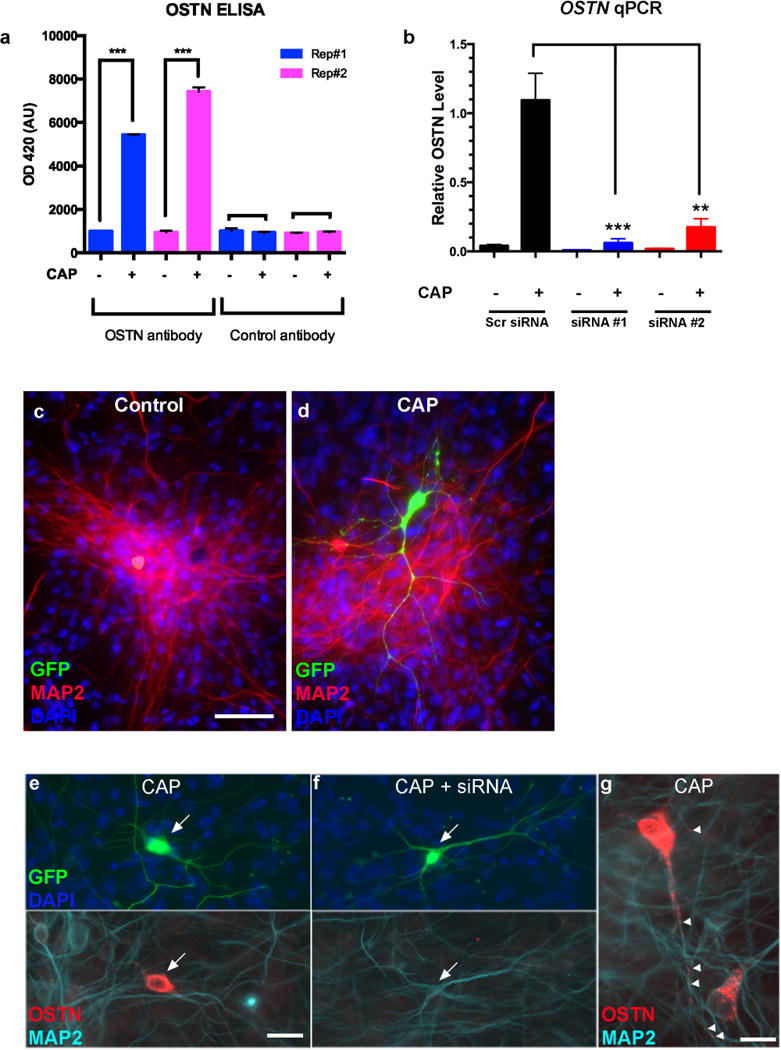
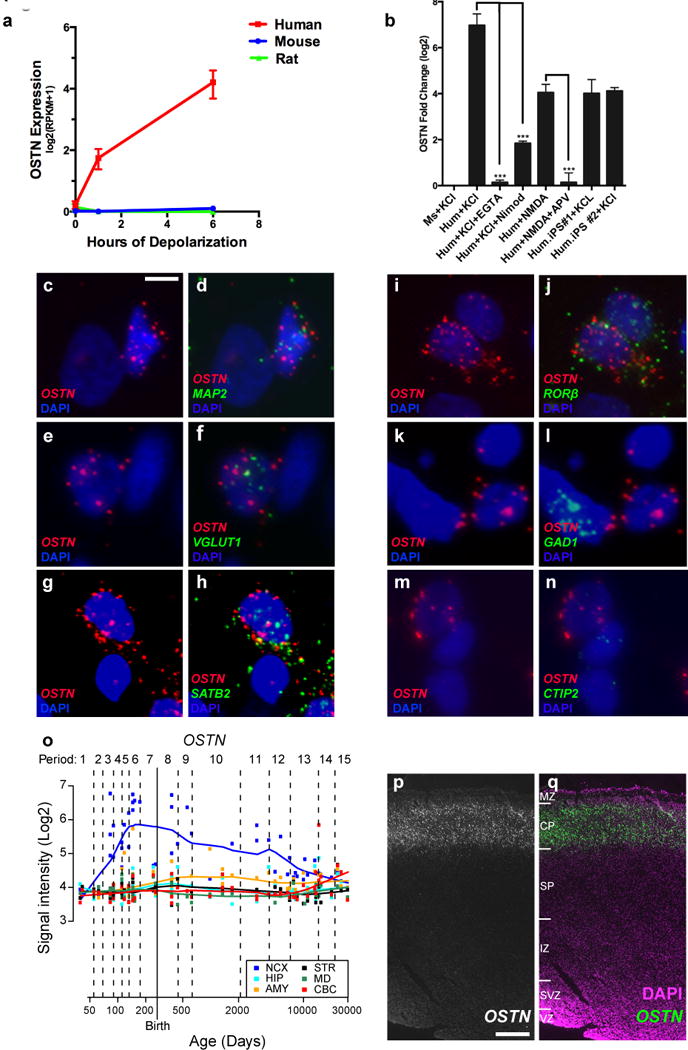
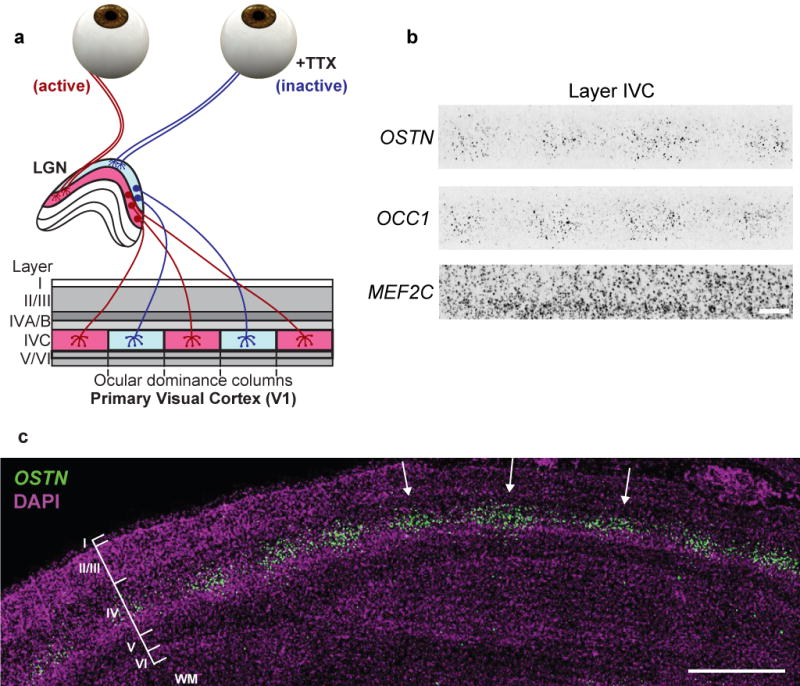
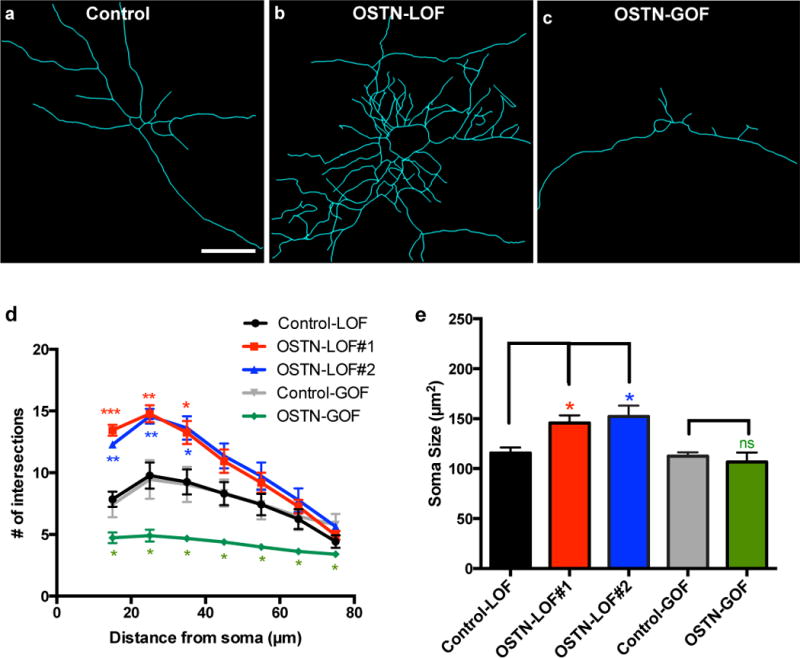
Sensory stimuli drive the maturation and function of the mammalian nervous system in part through the activation of gene expression networks that regulate synapse development and plasticity. These networks have primarily been studied in mice, and it is not known whether there are species- or clade-specific activity-regulated genes that control features of brain development and function. Here we use transcriptional profiling of human fetal brain cultures to identify an activity-dependent secreted factor, Osteocrin (OSTN), that is induced by membrane depolarization of human but not mouse neurons. We find that OSTN has been repurposed in primates through the evolutionary acquisition of DNA regulatory elements that bind the activity-regulated transcription factor MEF2. In addition, we demonstrate that OSTN is expressed in primate neocortex and restricts activity-dependent dendritic growth in human neurons. These findings suggest that, in response to sensory input, OSTN regulates features of neuronal structure and function that are unique to primates.


Conflict of interest statement

The authors declare no competing financial interests. Readers are welcome to comment on the online version of the paper.

Figures

Extended Data Figure 1
Extended Data Figure 1. hFBCs are mixed neuronal cultures that show high reproducibility
a, Gestational week and sex of hFBC samples used in profiling of activity-dependent gene expression. b, Representative images of DIV6 hFBC neurons immunostained with the neuronal marker MAP2 alone or together with the glial marker GFAP and DAPI nuclear dye. Scale bar, 75 μm. c, Quantification of MAP2- and GFAP-positive cells in hFBCs. Mean ± s.d. from three independent cultures shown. d, Representative image of hFBC neurons immunostained with MAP2 (green), SATB2 (red) and CTIP2 (blue). Scale bar, 57 μm. e, Quantification of the SATB2- and CTIP-immunoreactive subpopulations of MAP2-positive hFBC neurons. Mean ± s.d. from three independent cultures shown. f, Heatmap showing the Spearman correlation rS of coding gene expression profiles among five biological hFBC replicates (H1–5) (unstimulated neurons). g, Dendrogram of correlations among the gene expression profiles of hFBC replicates (H1–H5) and 10 human tissues, including whole brain, based on hierarchical clustering with distance measure 1 – rS.
Extended Data Figure 2
Extended Data Figure 2. hFBCs are mixed neuronal cultures with a substantial representation of cortical neuronal subtypes
a, Quantile distribution constructed from combined log-gene expression levels of five unstimulated hFBC samples, with associated colour scale (see Methods). b–e, Expression of selected marker genes classified by neuronal subtype (b), glial cell type (c), brain region (d), neural progenitor cell type (e), and non-neural cell type (f).
Extended Data Figure 3
Extended Data Figure 3. RNA-seq profiling of activity-dependent gene expression in human neuronal cultures
a, b, RNA-seq analysis of membrane depolarization-induced hFBC gene expression changes after 1 h (a) or 6 h (b). Scatterplots depict the geometric mean of genes’ non-zero expression values ± s.e.m. from five independent hFBC cultures. Fold change is proportional to distance from the diagonal. Genes passing filters for expression and significant activity-dependent changes are highlighted in red (BH-corrected P values controlled for FDR ≤ 0.15 based on a negative binomial model, magnitude of change (ratio ≥ 2.0 or ≤ 0.5), and above-background expression (RPKM > 0.57) on either axis, total reads ≥ 3 per time point). Selected genes exhibiting activity-regulated expression in human neurons but not in mouse neurons are indicated in blue. c, d, Pie charts showing the predicted subcellular localization of hFBC activity-responsive gene products induced following 1 h (c) or 6 h (d) KCl treatment. Analysis was performed using Ingenuity and GeneCards databases.
Extended Data Figure 4
Extended Data Figure 4. Ostn is neither expressed nor activity-regulated in mouse cortical neurons in vitro and in vivo
a, UCSC genome browser tracks for RNA-seq data from DIV7 cultured mouse cortical neurons depolarized for 0, 1 or 6 h with 55 mM KCl. The Ostn locus (grey) shows neither basal expression nor activity-dependent induction. The known activity-regulated gene Npas4 shows clear activity-dependent induction at 1 and 6 h. Finally, the cortex-enriched transcription factor Mef2C and the layer IV marker RorB show no significant expression changes in response to depolarization. b, UCSC genome browser tracks for RNA-seq data from visual cortices of dark-adapted (P42–P56) mice that were exposed to light for 0, 1, and 7.5 h. RNAs from excitatory and inhibitory neurons were isolated through the expression of a RiboTag transgene using Emx and Gad2 Cre-lines, respectively. The Ostn (grey), Npas4, Mef2C and RorB loci show similar responses as in a. All genome browser tracks y-axis min = 0 and max = 10. c, FISH images of radial sections from primary visual cortex of dark-adapted (P42–P56) mice exposed to light for 0 and 7.5 h. Upper panels, grey-scale images of Npas4 (left) and Ostn (right) probes. Lower panels, green-coloured images from upper panels, with nuclei marked with DAPI (magenta). Scale bar, 110 μm; cortical layers I–VI are indicated.
Extended Data Figure 5
Extended Data Figure 5. Differentiation and characterization of human iPSC-derived cortical neurons
a, Schematic of the iPSC cortical neuron differentiation protocol (see Methods). b, Immunostaining of DIV82 iPSC-derived neurons shows expression of cortical layer markers TBR1 (layer VI), CTIP2 (layer V), and SATB2 (layers II–IV). c, Quantitative RT–PCR analysis of known activity-dependent genes from DIV82 iPSC-derived neurons 0, 1, and 6 h after membrane depolarization with 55 mM KCl. Data shown as mean ± s.e.m. from two independent iPSC lines. Scale bar, 100 μm.
Extended Data Figure 6
Extended Data Figure 6. OSTN is primarily expressed in the neocortex of human brain
BrainSpan (http://www.brainspan.org) RNA-seq data showing expression levels of OSTN (red) and BDNF (grey) in 6 human brain regions (a–f; neocortex, hippocampus (HIP), amygdala (AMY), striatum (STR), mediodorsal nucleus of the thalamus (MD), and cerebellar cortex (CBC)) and OSTN in subregions of the human cortex from 8 pcw through 40 years old (g). Loess-fit curves depict mean expression with bands showing one s.e.m. h, FISH images showing OSTN expression in a radial section of human fetal brain (pcw16) illustrating selective enrichment of OSTN in the developing cortical plate of the paracentral lobule. Isolated OSTN signal also appears to be localized to migrating neurons (arrowheads) of the subplate. Scale bar, 200 μm. MZ, marginal zone; CP, cortical plate; SP, subplate; IZ, intermediate zone; SVZ, subventricular zone; VZ, ventricular zone.
Extended Data Figure 7
Extended Data Figure 7. Luciferase and ChIP assays in human and mouse neurons
Direct comparison of the ability of the human and mouse –2kb regulatory sequences to drive reporter expression in mouse (a; n = 8) and human (b; n = 3) neuronal cultures in response to KCl depolarization. n = number of biological replicates. Mean normalized firefly luciferase activity (Fluc/Ren) ± s.e.m., Student’s t-test, ns = not significant, *P < 0.05, **P < 0.01, ***P < 0.001. c, Luciferase assays performed in mouse neurons in the presence of calcineurin inhibitors (CsA and FK506, red) or vehicle (DMSO, black), Student’s t-test, *P < 0.05. d, ChIP–seq using a pan-MEF2 antibody (purple), an MEF2C-specific antibody (fuschia), and an antibody specific for H3K27ac (green) in hFBCs (left) and mouse cortical neuron cultures (right) shows enrichment for MEF2 binding at the known MEF2-regulated gene Nr4a1 (also known as Nur77). Y-axis scales here and in Fig. 2e were adjusted for each experiment to normalize for variability in ChIP efficiency between these two different culture systems. We chose scales by setting MEF2 and H3K27ac enrichment to approximately equal levels at this positive-control locus, yielding all human tracks at max 10, mouse pan-Mef2, Mef2c, and input tracks at max 20, and mouse active chromatin (H3K27ac) at max 50. e, UCSC genome browser tracks for RNA-seq, ChIP–seq and vertebrate evolutionary conservation at the mouse Ostn locus, shaded yellow. RNA-seq tracks show no Ostn expression or induction in DIV7 mouse cortical neuron cultures following KCl depolarization (0, 1 and 6 h). ChIP–seq tracks show H3K27ac peaks that mark active cis-regulatory regions at two time points: 0 h and 2 h after KCl depolarization. The nearby genes Uts2b and Ccdc50 are also shown for comparison. No active cis-regulatory sites were found surrounding the Ostn locus. H3K27ac tracks are shown with max 5 and RNA-seq tracks with max 10.
Extended Data Figure 8
Extended Data Figure 8. Luciferase reporter constructs and the complete set of assays
a, Detailed summary of all luciferase assay reporter construct variants of the human genomic sequence –2 kb upstream of the OSTN transcription start site. b, Summary of all luciferase assays performed in mouse cortical cultures. Categories of construct modifications are indicated and grouped by colour. Biological replicate numbers are indicated on the graph. Significant differences tested for by one-way ANOVA DF = (33, 266) and P < 1.0 × 10⁻¹³. Pair-wise comparisons were made using Holm–Sidak test for multiple comparisons using an overall error rate of 0.05, ***P < 1.22 × 10⁻⁵. All values are mean ± s.e.m.
Extended Data Figure 9
Extended Data Figure 9. FISH for OSTN mRNA in macaque brain
Layer IVC of active ocular dominance columns in primary visual cortex (V1) shows expression of OSTN after monocular inactivation of monkey#1 (a) and monkey#2 (b). Scale bar, 1,000 μm. c, Expanded panel shows detail of partially tangential portion of tissue section in which OSTN is expressed in layer IVC ocular dominance column stripes. Scale bar, 1,000 μm. d, OSTN expression is also enriched in layer IV of the multimodal parietal cortex. Scale bar, 250 μm. e–h, Representative FISH images of layer IVC neurons from the active columns, showing co-expression of OSTN with various cell-type markers, including VGLUT1 (glutamatergic neurons, e; 94.2 ± 2.8% of OSTN+ cells were VGLUT1+, n = 170), RORB (layer IV, f; 93.3 ± 6.1% of OSTN+ cells were RORB+, n = 92), MEF2C (g; 100% ± 0 of OSTN+ cells were MEF2C+, n = 148), and MEF2A (h; 100% ± 0 of OSTN+ cells were MEF2A+, n = 148). Data are represented as mean ± s.d. Nuclei are visualized with DAPI. Scale bar (eh), 2 μm.
Extended Data Figure 10
Extended Data Figure 10. Biochemical detection and immunolocalization of endogenous OSTN protein in human neurons
a, ELISA quantification of secreted OSTN in the culture medium of hFBCs under CAP conditions in two biological replicates (Rep#1 and #2). Rat monoclonal anti-OSTN antibody and rat monoclonal anti-CD31 (control antibody) were used as the detection antibodies. n = number of biological replicates. Mean ± s.e.m., Student’s t-test ***P < 0.001. b, Quantitative RT–PCR analysis of OSTN induction in hFBC neurons treated with scrambled siRNA (n = 5) or two independent siRNAs against the OSTN transcript (#1; n = 5 and #2; n = 4) for three days in the presence and absence of CAP. OSTN expression is normalized to GAPDH. c, d, Immunofluorescence images of DIV28 hFBC neurons transfected with –2kbhOSTN:GFP and left untreated (c) or maintained under CAP conditions (d). e–g, Immunofluorescence images of DIV28 hFBC neurons transfected with –2kbhOSTN:GFP (arrows) and treated with CAP for 3 days with (f) or without (e) treatment with siRNA targeting OSTN. Endogenous OSTN is predominantly localized in the soma and primary dendrites. Scale bar, 15 μm. (g) Higher magnification of OSTN immunostaining after 3 day CAP treatment reveals punctate structures (arrowheads) in the dendrites. Scale bars, 48 μm (c, d), 23 μm (e, f), 15 μm (g).
Figure 1
Figure 1. OSTN is an activity-regulated factor in human neocortex
a, OSTN expression in response to membrane depolarization as measured by RNA-seq in hFBCs (n = 5), rat (n = 3) and mouse (n = 4) cortical neuronal cultures. Data shown as mean ± s.e.m. b, Quantitative RT–PCR for OSTN induction in mouse cortical cultures (Ms, n = 2), hFBCs (Hum), iCell neurons (Hum. iPS#1, n = 3), and in vitro differentiated cortical neurons (Hum. iPS#2, n = 2) after treatment relative to untreated. KCl depolarization (KCl, n = 4), glutamate receptor agonist (NMDA, n = 2), calcium chelator (EGTA, n = 3), L-type calcium channel blocker nimodopine (Nimod, n = 3), NMDA receptor antagonist (2-amino-5-phosphonovalerate; APV, n = 2). OSTN expression normalized to GAPDH. n = number of biological replicates. Mean ± s.e.m., ***P < 0.001, Student’s t-test. c–n, FISH of depolarized hFBCs showing co-expression of OSTN with MAP2 (pan-neuronal; c, d), VGLUT1 (glutamatergic neurons; e, f), SATB2 (cortical layer II–IV; g, h), and RORB (layer IV; i, j). OSTN mRNA is excluded from cells positive for GAD1 (inhibitory neurons; k, l) and CTIP2 (cortical layer V; m, n). Nuclei are marked with DAPI (blue). Scale bar, 6.5 μm (cf, i, j) or 5 μm (g, h, kn). o, OSTN expression in regions of the developing human brain from HBT database, including striatum (STR), amygdala (AMY), neocortex (NCX), hippocampus (HIP), mediodorsal nucleus of the thalamus (MD), and cerebellar cortex (CBC). p, q, FISH of human fetal brain (pcw16) coronal section showing selective expression of OSTN in the cortical plate of temporal cortex in greyscale (p), or overlay (q) with DAPI nuclear stain. Scale bar, 390 μm. MZ, marginal zone; CP, cortical plate; SP, subplate; IZ, intermediate zone; SVZ, subventricular zone; VZ, ventricular zone.
Figure 2
Figure 2. Primate-specific enhancer regulation by MEF2 drives neuronal activity-dependent induction of OSTN
a, The 2-kb human genomic region upstream of OSTN (–2kbhOSTN, black), but not the homologous mouse sequence (–2kbmOstn, grey), drives the expression of a luciferase reporter gene in response to membrane depolarization (55 mM KCl) in mouse cortical cultures. Truncations (green) of –2kbhOSTN identify an 85-bp region that is critical for luciferase induction. Reversal of the 85-bp sequence orientation does not affect gene induction (teal dashed), unlike point mutations that disrupt MEF2 binding (3g mutations, blue). b, Luciferase assays with –2kbhOSTN, mutating the individual MREs or the entire 85-bp enhancer to the corresponding mouse sequence (gold). See Extended Data Fig. 8b. One-way ANOVA degrees of freedom = (33, 266), P < 1.0 × 10⁻¹³, Holm-Sidak overall error rate of 0.05, ***P < 1.22 × 10⁻⁵. c, Quantitative RT–PCR for endogenous OSTN and NPAS4 gene induction in days in vitro (DIV) 21 hFBCs following 6 h of KCl depolarization. Addition of calcineurin inhibitors (CsA and FK506, n = 4) or siRNAs targeting MEF2C (MEF2 siRNA, n = 4) specifically affected OSTN induction. n = number of biological replicates. Mean ± s.e.m., Student’s t-test **P < 0.01, ***P < 0.001, n.s. = not significant. d, Sequence conservation map of the 85-bp enhancer element. Conserved bases are grey, non-conserved bases are black, gaps in alignment are dashed, and sequence changes predicted to disrupt MEF2 binding are red. e, ChIP–seq using a pan-MEF2 antibody (purple), a MEF2C-specific antibody (fuschia), and an H3K27ac antibody (green) indicating active chromatin from hFBCs (left) and mouse cortical cultures (right) shows enrichment for MEF2 binding at the primate-specific 85-bp enhancer region (blue highlight) in hFBCs but not in mouse neurons.
Figure 3
Figure 3. OSTN expression is induced by sensory experience in the primate cortex
a, Schematic diagram of macaque visual pathway and monocular inactivation assay. For simplicity, only one hemisphere is depicted. b, High magnification FISH images of monocularly inactivated layer IVC neurons for OSTN, OCC1, and MEF2C transcripts. Scale bar, 188 μm. c, FISH image of OSTN from a radial section of monocularly inactivated macaque primary visual cortex. Scale bar, 1,000 μm. Cortical layers I–VI and white matter (WM) are labelled, and active ocular dominance columns are indicated with arrows.
Figure 4
Figure 4. OSTN regulates activity-dependent dendritic growth
a–c, Representative GFP tracings of individual hFBC neurons transfected with –2kbhOSTN:GFP and treated with scrambled siRNA (Control, a) or OSTN siRNA#1 (OSTN-LOF, b), or co-transfected with an OSTN overexpression construct (OSTN-GOF, c) in the presence of CAP for 3 days. Scale bar, 30 μm. d, Sholl analysis plot showing numbers of dendritic intersections as a function of distance from soma for scrambled siRNA (Control-LOF, in 5 biological replicates, 184 neurons analysed (5; 184)), OSTN siRNA#1 (OSTN-LOF#1 (5; 166)), OSTN siRNA#2 (OSTN-LOF#2 (3; 104)), empty vector transfected (Control-GOF (4; 99)), and OSTN overexpression construct transfected (OSTN-GOF (4; 112)). e, Summary of average soma sizes. Mean ± s.e.m., ***P < 0.001; **P < 0.01; *P < 0.05, ns = not significant Student’s t-test.

Comment in

References

    1. Defelipe J. The evolution of the brain, the human nature of cortical circuits, and intellectual creativity. Front Neuroanat. 2011;5:29. - PMC - PubMed
    1. Bufill E, Agustí J, Blesa R. Human neoteny revisited: The case of synaptic plasticity. Am J Hum Biol. 2011;23:729–739. - PubMed
    1. Geschwind DH, Rakic P. Cortical evolution: judge the brain by its cover. Neuron. 2013;80:633–647. - PMC - PubMed
    1. Johnson MB, et al. Single-cell analysis reveals transcriptional heterogeneity of neural progenitors in human cortex. Nat Neurosci. 2015;18:637–646. - PMC - PubMed
    1. Pollen AA, et al. Molecular identity of human outer radial glia during cortical development. Cell. 2015;163:55–67. - PMC - PubMed

Publication types

MeSH terms