

Ontogeny of Norepinephrine Transporter Expression and Antidepressant-Like Response to Desipramine in Wild-Type and Serotonin Transporter Mutant Mice
- PMID: 27831486
- PMCID: PMC5193070
- DOI: 10.1124/jpet.116.237305
Ontogeny of Norepinephrine Transporter Expression and Antidepressant-Like Response to Desipramine in Wild-Type and Serotonin Transporter Mutant Mice
Abstract
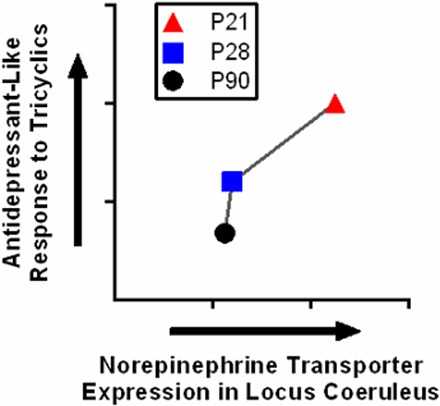
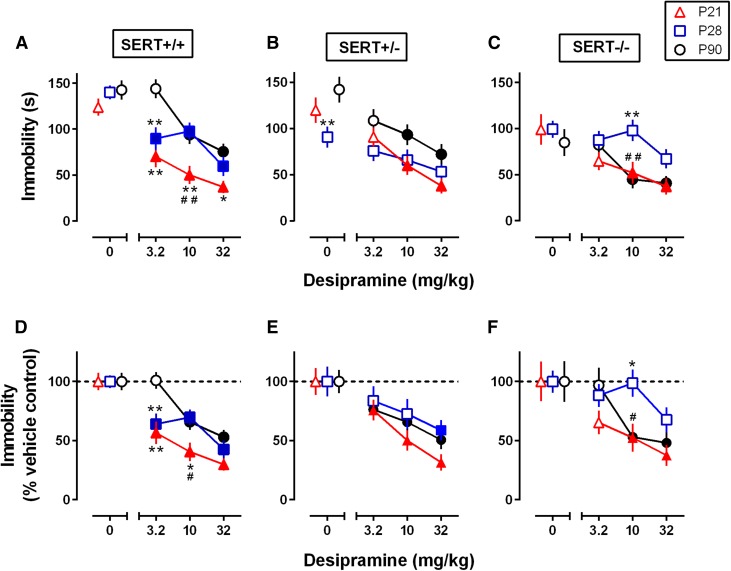
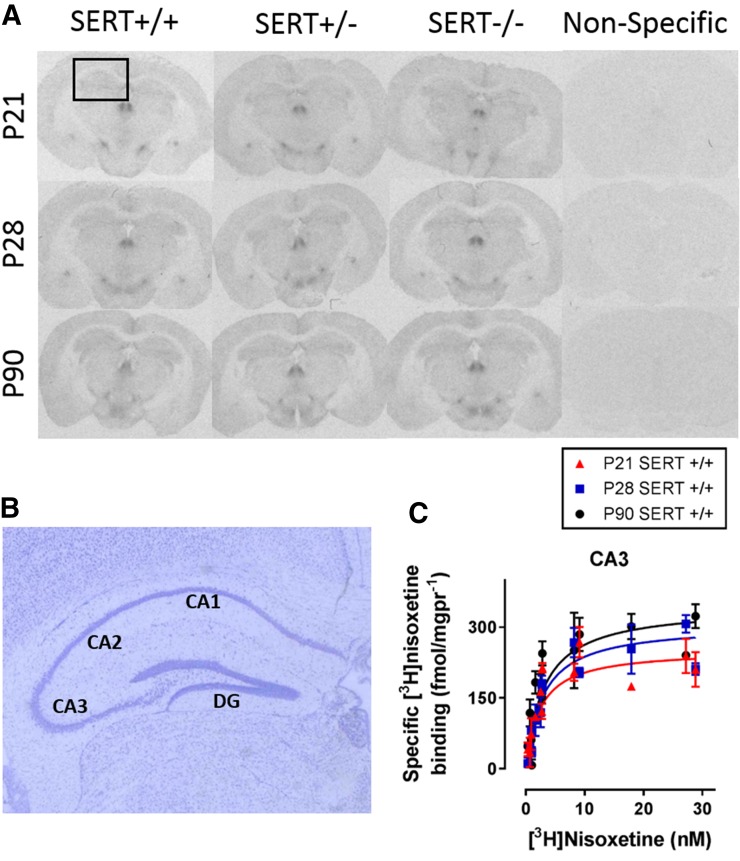
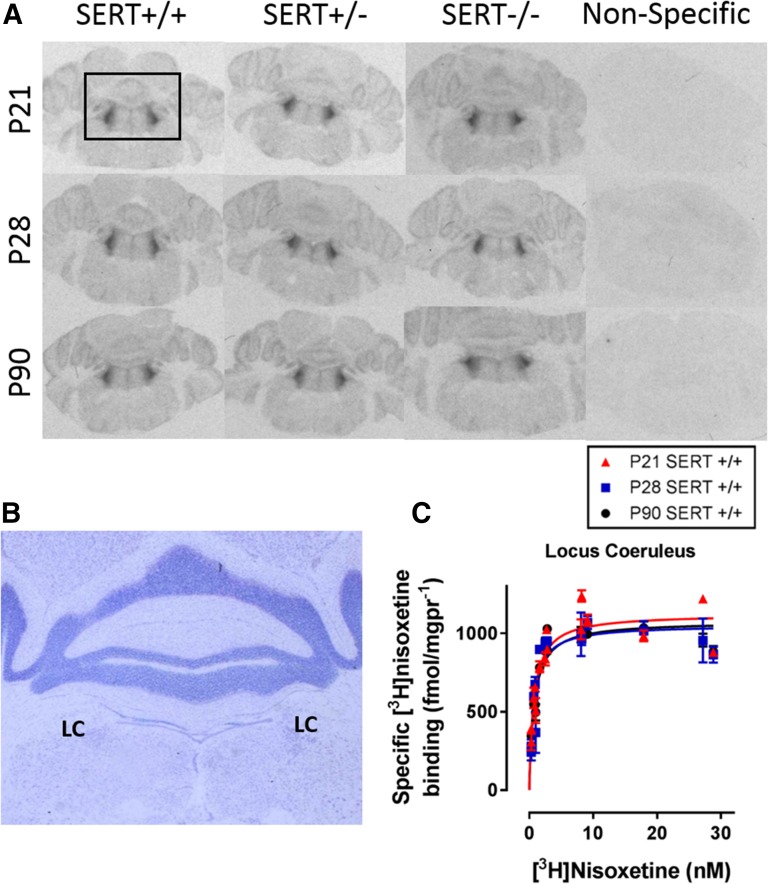
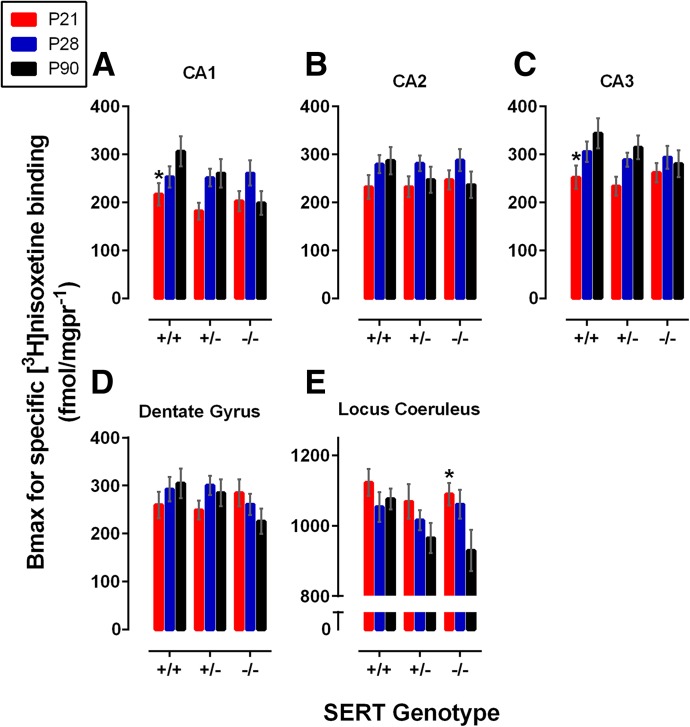
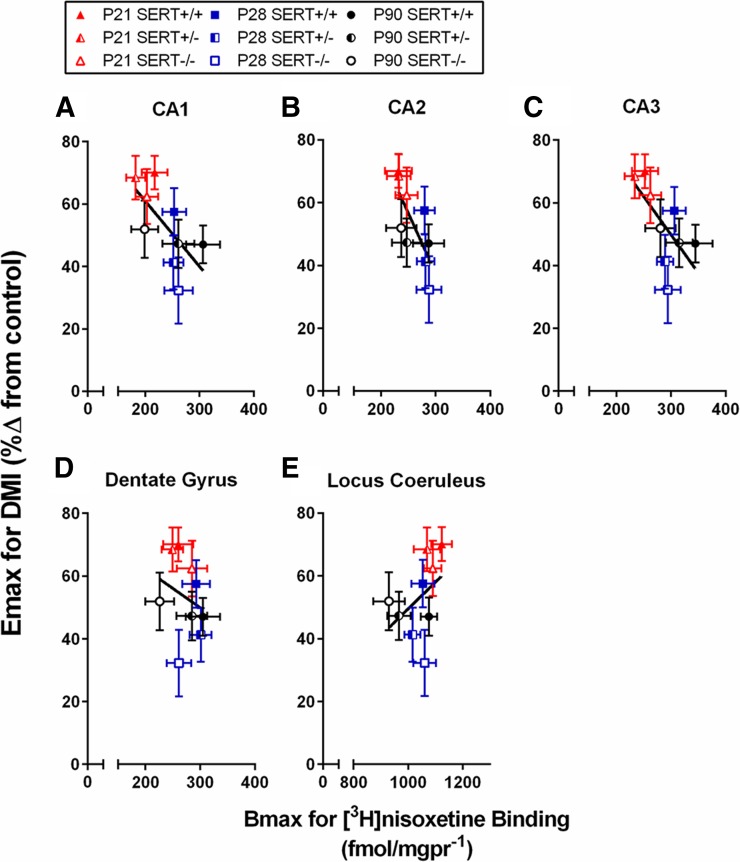
Depression is a major public health concern with symptoms that are often poorly controlled by treatment with common antidepressants. This problem is compounded in juveniles and adolescents, because therapeutic options are limited to selective serotonin reuptake inhibitors (SSRIs). Moreover, therapeutic benefits of SSRIs are often especially limited in certain subpopulations of depressed patients, including children and carriers of low-expressing serotonin transporter (SERT) gene variants. Tricyclic antidepressants (TCAs) offer an alternative to SSRIs; however, how age and SERT expression influence antidepressant response to TCAs is not understood. We investigated the relation between antidepressant-like response to the TCA desipramine using the tail suspension test and saturation binding of [3H]nisoxetine to the norepinephrine transporter (NET), the primary target of desipramine, in juvenile (21 days postnatal [P21]), adolescent (P28), and adult (P90) wild-type (SERT+/+) mice. To model carriers of low-expressing SERT gene variants, we used mice with reduced SERT expression (SERT+/-) or lacking SERT (SERT-/-). The potency and maximal antidepressant-like effect of desipramine was greater in P21 mice than in P90 mice and was SERT genotype independent. NET expression decreased with age in the locus coeruleus and increased with age in several terminal regions (e.g., the cornu ammonis CA1 and CA3 regions of the hippocampus). Binding affinity of [3H]nisoxetine did not vary as a function of age or SERT genotype. These data show age-dependent shifts for desipramine to produce antidepressant-like effects that correlate with NET expression in the locus coeruleus and suggest that drugs with NET-blocking activity may be an effective alternative to SSRIs in juveniles.
Copyright © 2016 by The American Society for Pharmacology and Experimental Therapeutics.
Figures
Similar articles
-
Ontogeny of SERT Expression and Antidepressant-like Response to Escitalopram in Wild-Type and SERT Mutant Mice.J Pharmacol Exp Ther. 2016 Aug;358(2):271-81. doi: 10.1124/jpet.116.233338. Epub 2016 Jun 10. J Pharmacol Exp Ther. 2016. PMID: 27288483 Free PMC article.
-
Antidepressant-like effects and basal immobility depend on age and serotonin transporter genotype.Genes Brain Behav. 2015 Sep;14(7):543-549. doi: 10.1111/gbb.12238. Genes Brain Behav. 2015. PMID: 26250357 Free PMC article.
-
Association of changes in norepinephrine and serotonin transporter expression with the long-term behavioral effects of antidepressant drugs.Neuropsychopharmacology. 2009 May;34(6):1467-81. doi: 10.1038/npp.2008.183. Epub 2008 Oct 15. Neuropsychopharmacology. 2009. PMID: 18923402 Free PMC article.
-
Behavioral and serotonergic consequences of decreasing or increasing hippocampus brain-derived neurotrophic factor protein levels in mice.Neuropharmacology. 2008 Nov;55(6):1006-14. doi: 10.1016/j.neuropharm.2008.08.001. Epub 2008 Aug 12. Neuropharmacology. 2008. PMID: 18761360 Review.
-
Depression and antidepressants: insights from knockout of dopamine, serotonin or noradrenaline re-uptake transporters.Pharmacol Ther. 2011 Mar;129(3):352-68. doi: 10.1016/j.pharmthera.2010.12.002. Epub 2010 Dec 13. Pharmacol Ther. 2011. PMID: 21147164 Review.
Cited by
-
Targeting Serotonin Transporters in the Treatment of Juvenile and Adolescent Depression.Front Neurosci. 2019 Feb 27;13:156. doi: 10.3389/fnins.2019.00156. eCollection 2019. Front Neurosci. 2019. PMID: 30872996 Free PMC article.
-
Chronic Desipramine Reverses Deficits in Cell Activity, Norepinephrine Innervation, and Anxiety-Depression Phenotypes in Fluoxetine-Resistant cF1ko Mice.J Neurosci. 2024 Jan 17;44(3):e1147232023. doi: 10.1523/JNEUROSCI.1147-23.2023. J Neurosci. 2024. PMID: 38050173 Free PMC article.
-
Effect of concurrent organic cation transporter blockade on norepinephrine clearance inhibiting- and antidepressant-like actions of desipramine and venlafaxine.Eur J Pharmacol. 2020 Sep 15;883:173285. doi: 10.1016/j.ejphar.2020.173285. Epub 2020 Jul 19. Eur J Pharmacol. 2020. PMID: 32697958 Free PMC article.
-
Faster Serotonin Clearance in CA3 Region of Hippocampus and Antidepressant-like Effect of Decynium-22 in Juvenile Mice Are Putatively Linked to Increased Plasma Membrane Monoamine Transporter Function: Implications for Efficacy of Antidepressants in Juveniles.Cells. 2022 Aug 8;11(15):2454. doi: 10.3390/cells11152454. Cells. 2022. PMID: 35954298 Free PMC article.
References
-
- Bengel D, Murphy DL, Andrews AM, Wichems CH, Feltner D, Heils A, Mössner R, Westphal H, Lesch KP. (1998) Altered brain serotonin homeostasis and locomotor insensitivity to 3, 4-methylenedioxymethamphetamine (“Ecstasy”) in serotonin transporter-deficient mice. Mol Pharmacol 53:649–655. - PubMed
-
- Bourin M, Colombel MC, Redrobe JP, Nizard J, Hascoët M, Baker GB. (1998) Evaluation of efficacies of different classes of antidepressants in the forced swimming test in mice at different ages. Prog Neuropsychopharmacol Biol Psychiatry 22:343–351. - PubMed
-
- Bujoreanu S, Benhayon D, Szigethy E. (2011) Treatment of depression in children and adolescents. Pediatr Ann 40:548–555. - PubMed
MeSH terms
Substances
Grants and funding
LinkOut - more resources
Full Text Sources
Other Literature Sources
Medical
Miscellaneous
