

A systematic comparison reveals substantial differences in chromosomal versus episomal encoding of enhancer activity
- PMID: 27831498
- PMCID: PMC5204343
- DOI: 10.1101/gr.212092.116
A systematic comparison reveals substantial differences in chromosomal versus episomal encoding of enhancer activity
Erratum in
-
Corrigendum: A systematic comparison reveals substantial differences in chromosomal versus episomal encoding of enhancer activity.Genome Res. 2018 May;28(5):766.3. doi: 10.1101/gr.237321.118. Genome Res. 2018. PMID: 29717003 Free PMC article. No abstract available.
Abstract
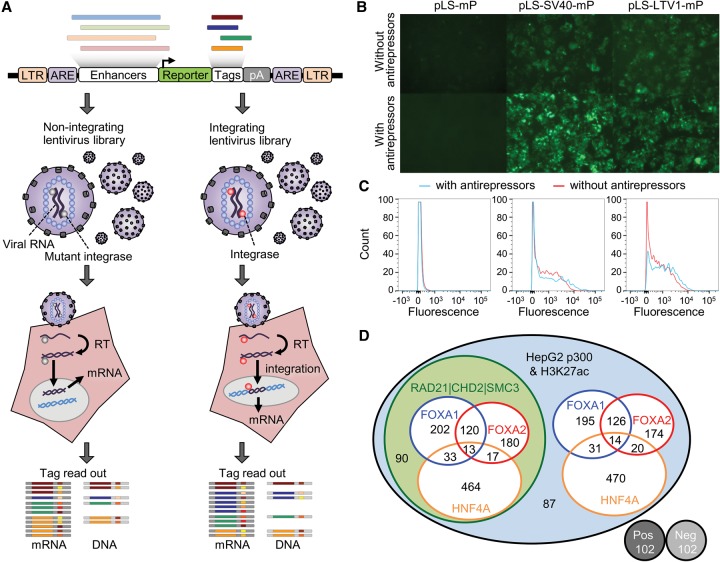
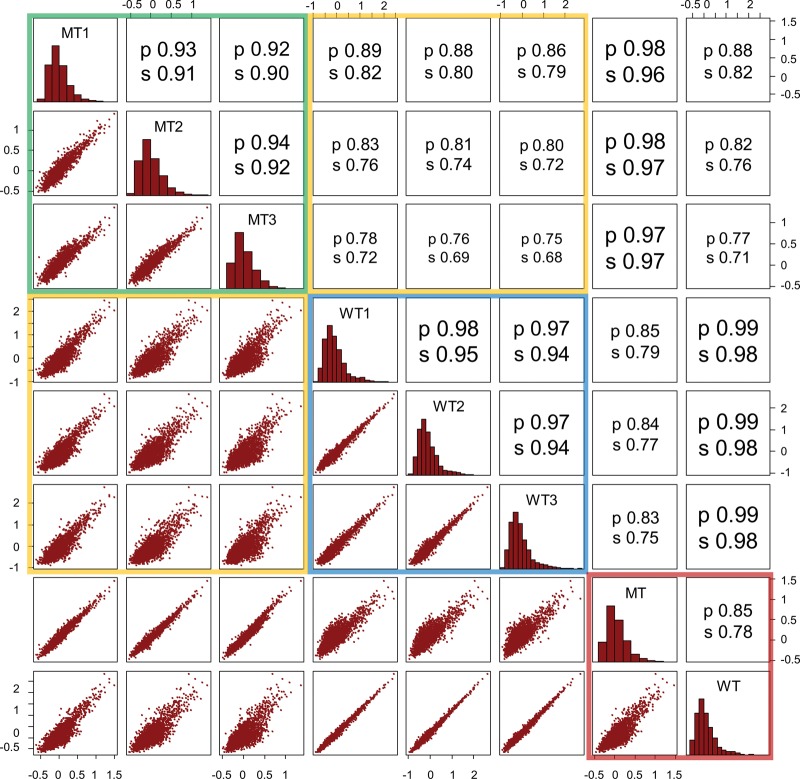
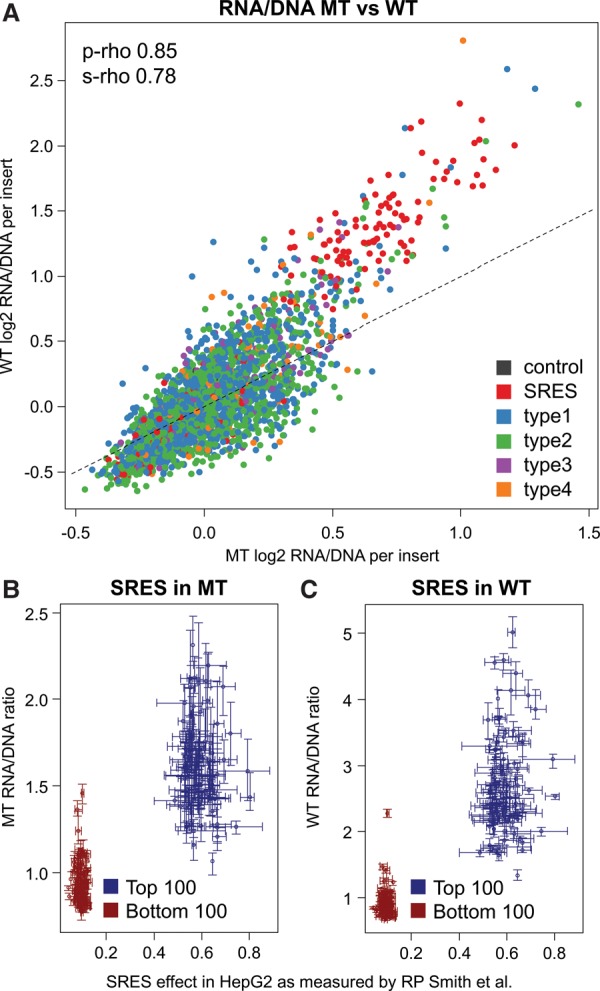
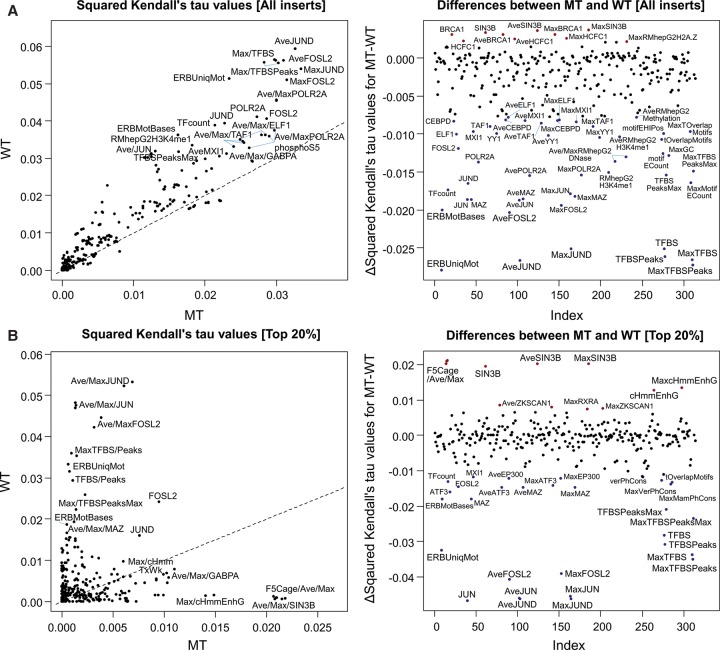
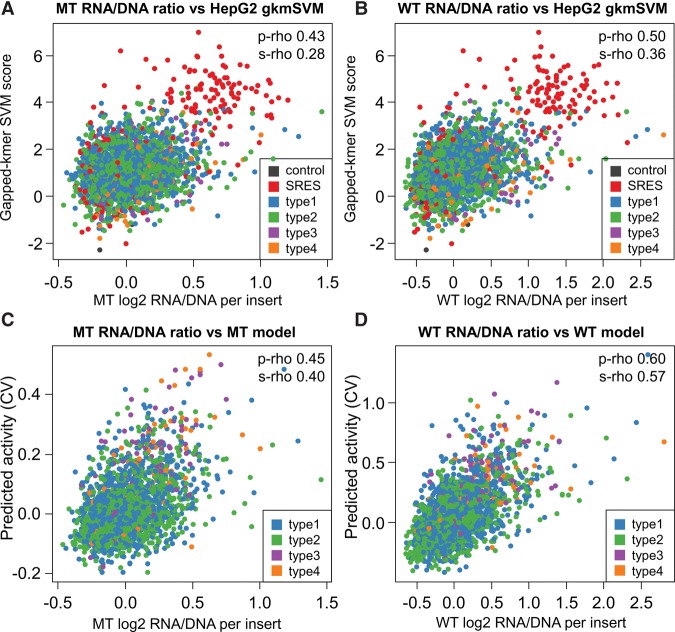
Candidate enhancers can be identified on the basis of chromatin modifications, the binding of chromatin modifiers and transcription factors and cofactors, or chromatin accessibility. However, validating such candidates as bona fide enhancers requires functional characterization, typically achieved through reporter assays that test whether a sequence can increase expression of a transcriptional reporter via a minimal promoter. A longstanding concern is that reporter assays are mainly implemented on episomes, which are thought to lack physiological chromatin. However, the magnitude and determinants of differences in cis-regulation for regulatory sequences residing in episomes versus chromosomes remain almost completely unknown. To address this systematically, we developed and applied a novel lentivirus-based massively parallel reporter assay (lentiMPRA) to directly compare the functional activities of 2236 candidate liver enhancers in an episomal versus a chromosomally integrated context. We find that the activities of chromosomally integrated sequences are substantially different from the activities of the identical sequences assayed on episomes, and furthermore are correlated with different subsets of ENCODE annotations. The results of chromosomally based reporter assays are also more reproducible and more strongly predictable by both ENCODE annotations and sequence-based models. With a linear model that combines chromatin annotations and sequence information, we achieve a Pearson's R2 of 0.362 for predicting the results of chromosomally integrated reporter assays. This level of prediction is better than with either chromatin annotations or sequence information alone and also outperforms predictive models of episomal assays. Our results have broad implications for how cis-regulatory elements are identified, prioritized and functionally validated.
© 2017 Inoue et al.; Published by Cold Spring Harbor Laboratory Press.
Figures
Comment in
-
DNA elements: The ins and outs of enhancer validation.Nat Rev Genet. 2017 Jan;18(1):2-3. doi: 10.1038/nrg.2016.155. Epub 2016 Nov 28. Nat Rev Genet. 2017. PMID: 27890925 No abstract available.
Similar articles
-
Systematic dissection of regulatory motifs in 2000 predicted human enhancers using a massively parallel reporter assay.Genome Res. 2013 May;23(5):800-11. doi: 10.1101/gr.144899.112. Epub 2013 Mar 19. Genome Res. 2013. PMID: 23512712 Free PMC article.
-
Understanding how cis-regulatory function is encoded in DNA sequence using massively parallel reporter assays and designed sequences.Genomics. 2015 Sep;106(3):165-170. doi: 10.1016/j.ygeno.2015.06.003. Epub 2015 Jun 10. Genomics. 2015. PMID: 26072432 Free PMC article. Review.
-
Reporter gene assays and chromatin-level assays define substantially non-overlapping sets of enhancer sequences.BMC Genomics. 2023 Jan 13;24(1):17. doi: 10.1186/s12864-023-09123-9. BMC Genomics. 2023. PMID: 36639739 Free PMC article.
-
Systematic targeted integration to study Albumin gene control elements.PLoS One. 2011;6(8):e23234. doi: 10.1371/journal.pone.0023234. Epub 2011 Aug 12. PLoS One. 2011. PMID: 21858039 Free PMC article.
-
Decoding enhancers using massively parallel reporter assays.Genomics. 2015 Sep;106(3):159-164. doi: 10.1016/j.ygeno.2015.06.005. Epub 2015 Jun 10. Genomics. 2015. PMID: 26072433 Free PMC article. Review.
Cited by
-
A systematic evaluation of the design and context dependencies of massively parallel reporter assays.Nat Methods. 2020 Nov;17(11):1083-1091. doi: 10.1038/s41592-020-0965-y. Epub 2020 Oct 12. Nat Methods. 2020. PMID: 33046894 Free PMC article.
-
Identification of non-coding silencer elements and their regulation of gene expression.Nat Rev Mol Cell Biol. 2023 Jun;24(6):383-395. doi: 10.1038/s41580-022-00549-9. Epub 2022 Nov 7. Nat Rev Mol Cell Biol. 2023. PMID: 36344659 Review.
-
Development and Application of Brain Region-Specific Organoids for Investigating Psychiatric Disorders.Biol Psychiatry. 2023 Apr 1;93(7):594-605. doi: 10.1016/j.biopsych.2022.12.015. Epub 2022 Dec 24. Biol Psychiatry. 2023. PMID: 36759261 Free PMC article. Review.
-
A scalable platform for the development of cell-type-specific viral drivers.Elife. 2019 Sep 23;8:e48089. doi: 10.7554/eLife.48089. Elife. 2019. PMID: 31545165 Free PMC article.
-
Differentially Active and Conserved Neural Enhancers Define Two Forms of Adaptive Noncoding Evolution in Humans.Genome Biol Evol. 2022 Aug 3;14(8):evac108. doi: 10.1093/gbe/evac108. Genome Biol Evol. 2022. PMID: 35866592 Free PMC article.
References
-
- Alcorn JA, Feitelberg SP, Brenner DA. 1990. Transient induction of c-jun during hepatic regeneration. Hepatology 11: 909–915. - PubMed
-
- Archer TK, Lefebvre P, Wolford RG, Hager GL. 1992. Transcription factor loading on the MMTV promoter: a bimodal mechanism for promoter activation. Science 255: 1573–1576. - PubMed
-
- Arnold CD, Gerlach D, Stelzer C, Boryń ŁM, Rath M, Stark A. 2013. Genome-wide quantitative enhancer activity maps identified by STARR-seq. Science 339: 1074–1077. - PubMed
Publication types
MeSH terms
Substances
Grants and funding
LinkOut - more resources
Full Text Sources
Other Literature Sources
Molecular Biology Databases
Research Materials