

Association of Traditional Cardiovascular Risk Factors With Venous Thromboembolism: An Individual Participant Data Meta-Analysis of Prospective Studies
- PMID: 27831499
- PMCID: PMC5201424
- DOI: 10.1161/CIRCULATIONAHA.116.024507
Association of Traditional Cardiovascular Risk Factors With Venous Thromboembolism: An Individual Participant Data Meta-Analysis of Prospective Studies
Erratum in
-
Correction to: Association of Traditional Cardiovascular Risk Factors With Venous Thromboembolism: An Individual Participant Data Meta-Analysis of Prospective Studies.Circulation. 2017 Mar 21;135(12):e788. doi: 10.1161/CIR.0000000000000497. Circulation. 2017. PMID: 28320813 No abstract available.
Abstract
Background: Much controversy surrounds the association of traditional cardiovascular disease risk factors with venous thromboembolism (VTE).
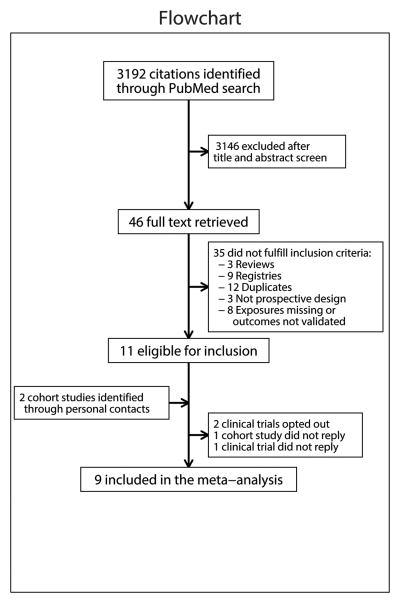
Methods: We performed an individual level random-effect meta-analysis including 9 prospective studies with measured baseline cardiovascular disease risk factors and validated VTE events. Definitions were harmonized across studies. Traditional cardiovascular disease risk factors were modeled categorically and continuously using restricted cubic splines. Estimates were obtained for overall VTE, provoked VTE (ie, VTE occurring in the presence of 1 or more established VTE risk factors), and unprovoked VTE, pulmonary embolism, and deep-vein thrombosis.
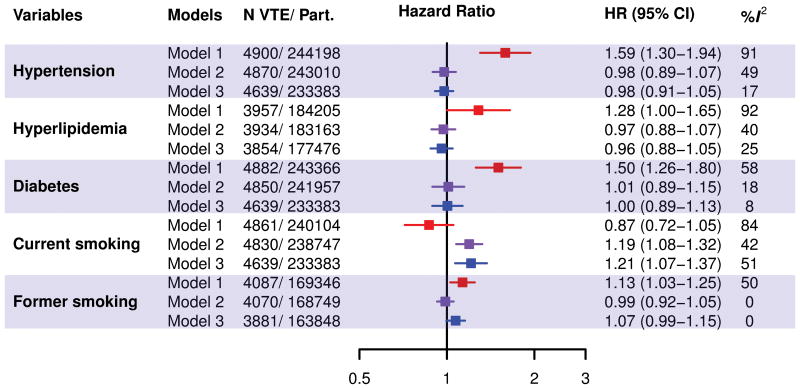
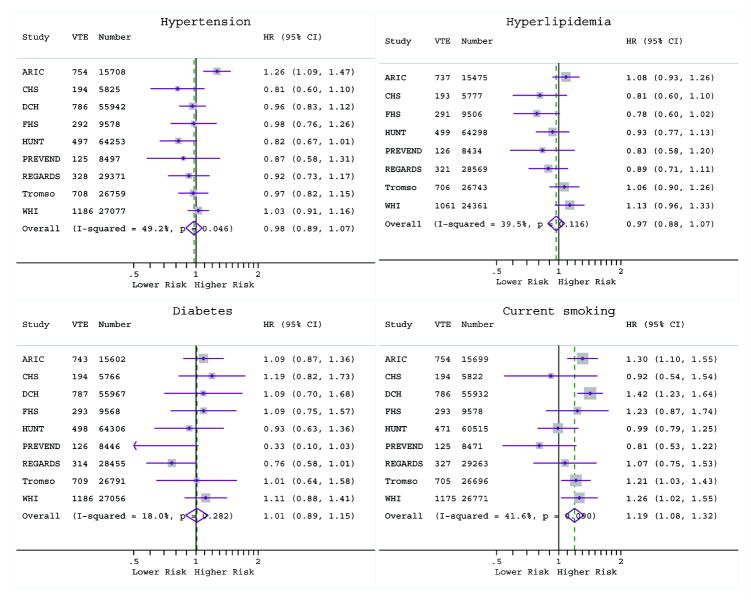
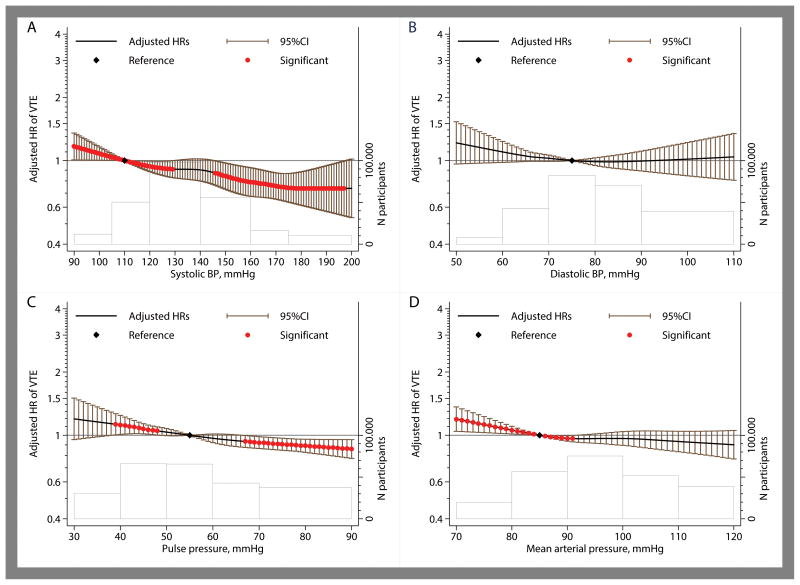
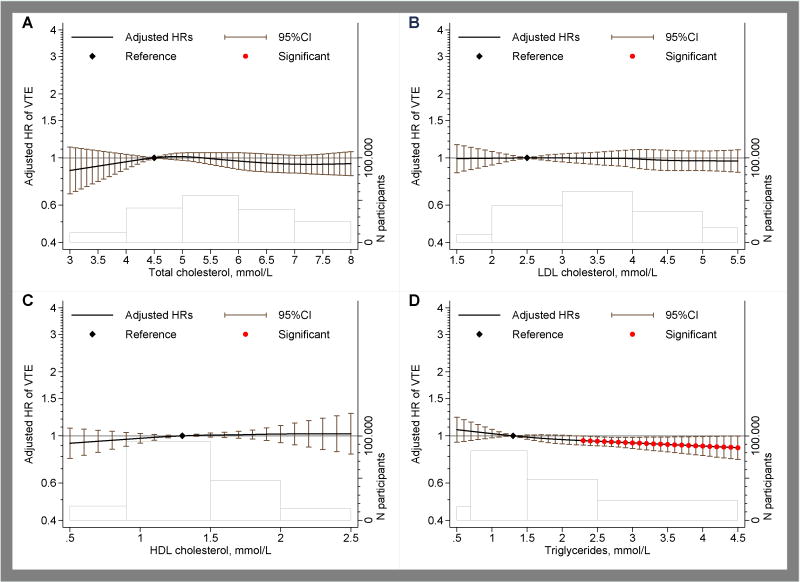
Results: The studies included 244 865 participants with 4910 VTE events occurring during a mean follow-up of 4.7 to 19.7 years per study. Age, sex, and body mass index-adjusted hazard ratios for overall VTE were 0.98 (95% confidence interval [CI]: 0.89-1.07) for hypertension, 0.97 (95% CI: 0.88-1.08) for hyperlipidemia, 1.01 (95% CI: 0.89-1.15) for diabetes mellitus, and 1.19 (95% CI: 1.08-1.32) for current smoking. After full adjustment, these estimates were numerically similar. When modeled continuously, an inverse association was observed for systolic blood pressure (hazard ratio=0.79 [95% CI: 0.68-0.92] at systolic blood pressure 160 vs 110 mm Hg) but not for diastolic blood pressure or lipid measures with VTE. An important finding from VTE subtype analyses was that cigarette smoking was associated with provoked but not unprovoked VTE. Fully adjusted hazard ratios for the associations of current smoking with provoked and unprovoked VTE were 1.36 (95% CI: 1.22-1.52) and 1.08 (95% CI: 0.90-1.29), respectively.
Conclusions: Except for the association between cigarette smoking and provoked VTE, which is potentially mediated through comorbid conditions such as cancer, the modifiable traditional cardiovascular disease risk factors are not associated with increased VTE risk. Higher systolic blood pressure showed an inverse association with VTE.
Keywords: cardiovascular disease; diabetes mellitus; hyperlipidemia; hypertension; risk factors; smoking; venous thromboembolism.
© 2016 American Heart Association, Inc.
Conflict of interest statement
Disclosures: None declared. All authors submitted the ICMJE form on Disclosure of Potential Conflicts of Interest. The views expressed in this manuscript are those of the authors and do not necessarily represent the views of the National Heart, Lung, and Blood Institute; the National Institutes of Health; or the U.S. Department of Health and Human Services.
Figures
Comment in
-
Smoking: A Dual Pathogen for Arterial and Venous Thrombosis.Circulation. 2017 Jan 3;135(1):17-20. doi: 10.1161/CIRCULATIONAHA.116.025024. Circulation. 2017. PMID: 28028060 No abstract available.
Similar articles
-
Cardiovascular Risk Factors Associated With Venous Thromboembolism.JAMA Cardiol. 2019 Feb 1;4(2):163-173. doi: 10.1001/jamacardio.2018.4537. JAMA Cardiol. 2019. PMID: 30649175 Free PMC article.
-
Effect of testing for cancer on cancer- or venous thromboembolism (VTE)-related mortality and morbidity in people with unprovoked VTE.Cochrane Database Syst Rev. 2018 Nov 8;11(11):CD010837. doi: 10.1002/14651858.CD010837.pub4. Cochrane Database Syst Rev. 2018. Update in: Cochrane Database Syst Rev. 2021 Oct 1;10:CD010837. doi: 10.1002/14651858.CD010837.pub5. PMID: 30407621 Free PMC article. Updated.
-
Impact of incident myocardial infarction on the risk of venous thromboembolism: the Tromsø Study.J Thromb Haemost. 2016 Jun;14(6):1183-91. doi: 10.1111/jth.13329. Epub 2016 May 10. J Thromb Haemost. 2016. PMID: 27061154
-
Risk factors for venous thromboembolism: results from the Copenhagen City Heart Study.Circulation. 2010 May 4;121(17):1896-903. doi: 10.1161/CIRCULATIONAHA.109.921460. Epub 2010 Apr 19. Circulation. 2010. PMID: 20404252
-
Venous thrombotic events in psoriasis patients: a systematic review with meta-analysis.Ann Med. 2021 Dec;53(1):1074-1081. doi: 10.1080/07853890.2021.1942974. Ann Med. 2021. PMID: 34184588 Free PMC article.
Cited by
-
Identification of risk factors for venous thromboembolism and validation of the Khorana score in patients with advanced lung cancer: based on the multicenter, prospective Rising-VTE/NEJ037 study data.Int J Clin Oncol. 2023 Jan;28(1):69-78. doi: 10.1007/s10147-022-02257-y. Epub 2022 Nov 10. Int J Clin Oncol. 2023. PMID: 36357710 Free PMC article.
-
Risk factors for venous thromboembolism in patients with pneumonia in the pre-COVID-19 era: a meta-analysis and systematic review.J Thorac Dis. 2023 Dec 30;15(12):6697-6707. doi: 10.21037/jtd-23-926. Epub 2023 Dec 26. J Thorac Dis. 2023. PMID: 38249878 Free PMC article.
-
Mechanical Thrombectomy for Acute and Subacute Blocked Arteries and Veins in the Lower Limbs: A Health Technology Assessment.Ont Health Technol Assess Ser. 2023 Jan 24;23(1):1-244. eCollection 2023. Ont Health Technol Assess Ser. 2023. PMID: 36818453 Free PMC article.
-
Venous thrombosis and obesity: from clinical needs to therapeutic challenges.Intern Emerg Med. 2025 Jan;20(1):47-64. doi: 10.1007/s11739-024-03765-7. Epub 2024 Sep 13. Intern Emerg Med. 2025. PMID: 39269539 Free PMC article. Review.
-
Epidemiology of Vascular Thrombosis in the Eastern Province of Saudi Arabia: A Single Center Study and Comparison with National Data.J Epidemiol Glob Health. 2025 Feb 17;15(1):26. doi: 10.1007/s44197-025-00363-4. J Epidemiol Glob Health. 2025. PMID: 39961871 Free PMC article.
References
-
- Beckman MG, Hooper WC, Critchley SE, Ortel TL. Venous thromboembolism: a public health concern. Am J Prev Med. 2010;38:S495–501. - PubMed
-
- Cohen AT, Agnelli G, Anderson FA, Arcelus JI, Bergqvist D, Brecht JG, Greer IA, Heit JA, Hutchinson JL, Kakkar AK, Mottier D, Oger E, Samama MM, Spannagl M, Europe VTEIAGi. Venous thromboembolism (VTE) in Europe. The number of VTE events and associated morbidity and mortality. Thromb Haemost. 2007;98:756–64. - PubMed
-
- Rosendaal FR. Risk factors for venous thrombotic disease. Thromb Haemost. 1999;82:610–9. - PubMed
-
- White RH. The epidemiology of venous thromboembolism. Circulation. 2003;107:I4–8. - PubMed
-
- Goff DC, Jr, Lloyd-Jones DM, Bennett G, Coady S, D'Agostino RB, Sr, Gibbons R, Greenland P, Lackland DT, Levy D, O'Donnell CJ, Robinson J, Schwartz JS, Shero ST, Smith SC, Jr, Sorlie P, Stone NJ, Wilson PW. 2013 ACC/AHA Guideline on the Assessment of Cardiovascular Risk: A Report of the American College of Cardiology/American Heart Association Task Force on Practice Guidelines. Circulation. 2013;129:S49–73. - PubMed
Publication types
MeSH terms
Substances
Grants and funding
LinkOut - more resources
Full Text Sources
Other Literature Sources
