

Consolidation in the Dialysis Industry, Patient Choice, and Local Market Competition
- PMID: 27831510
- PMCID: PMC5338708
- DOI: 10.2215/CJN.06340616
Consolidation in the Dialysis Industry, Patient Choice, and Local Market Competition
Abstract
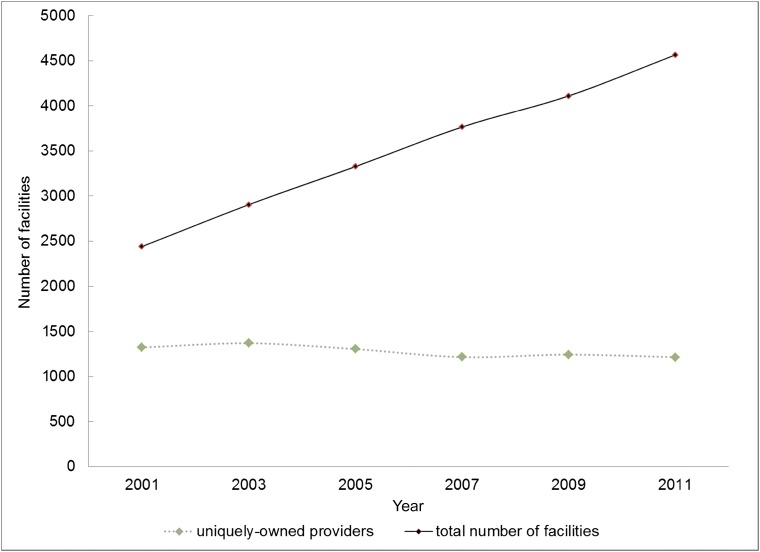
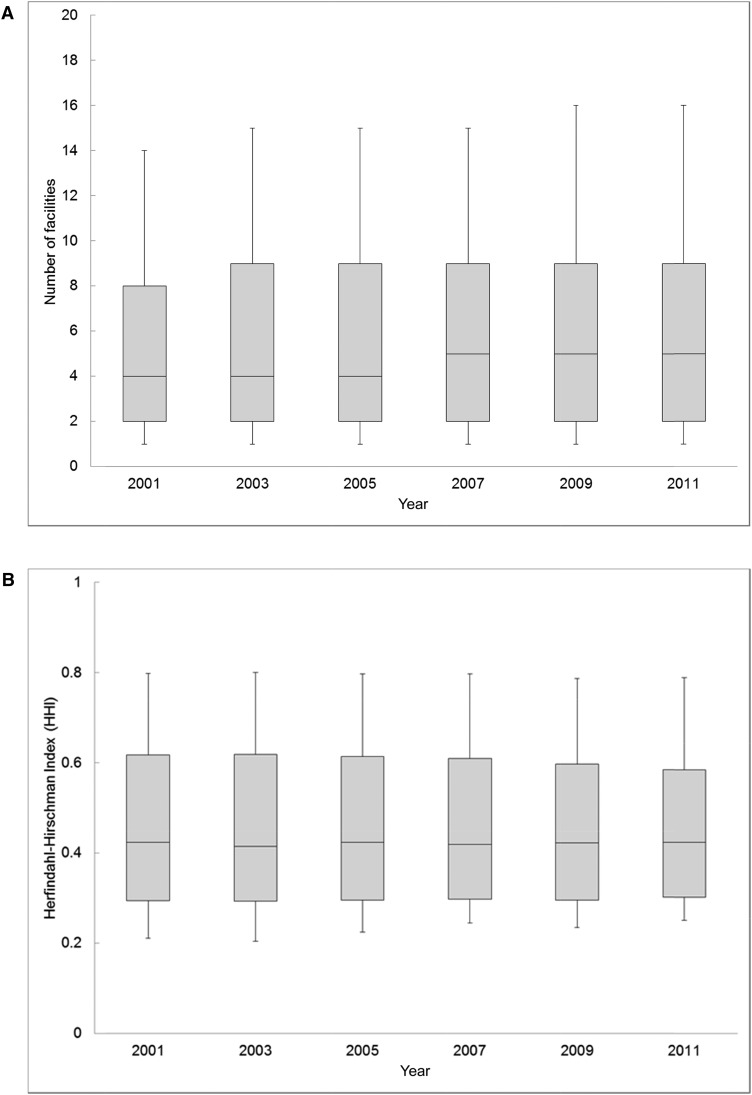
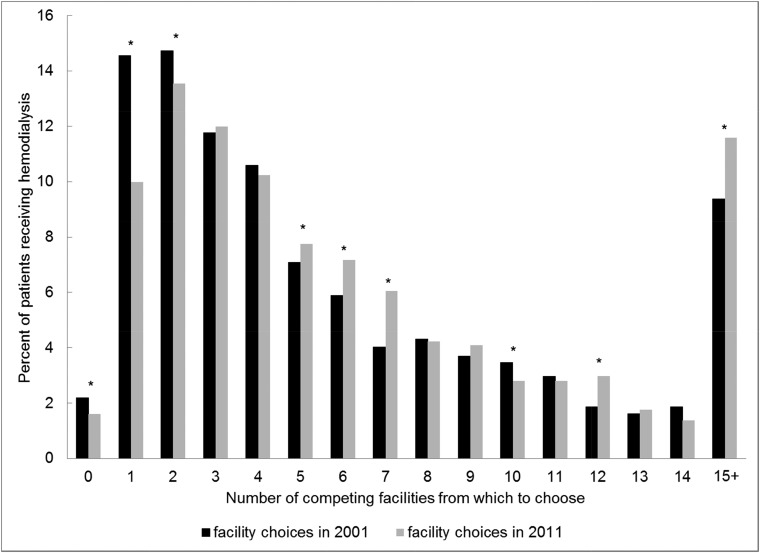
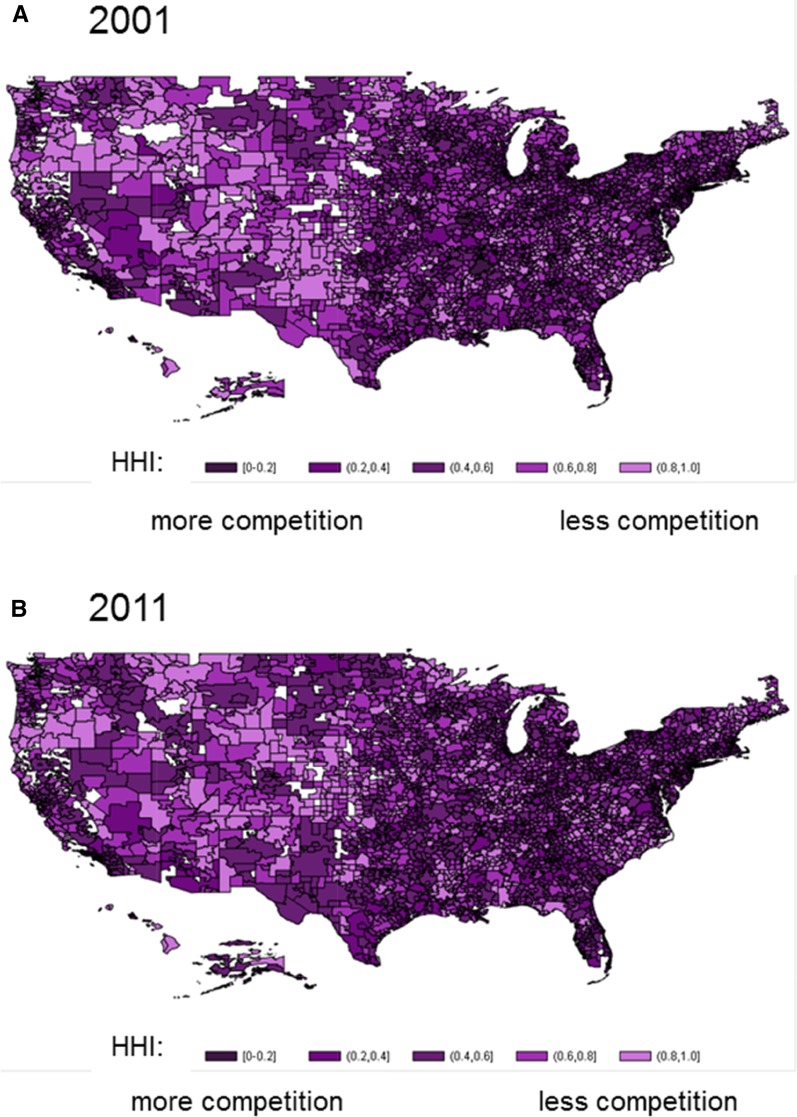
The Medicare program insures >80% of patients with ESRD in the United States. An emphasis on reducing outpatient dialysis costs has motivated consolidation among dialysis providers, with two for-profit corporations now providing dialysis for >70% of patients. It is unknown whether industry consolidation has affected patients' ability to choose among competing dialysis providers. We identified patients receiving in-center hemodialysis at the start of 2001 and 2011 from the national ESRD registry and ascertained dialysis facility ownership. For each hospital service area, we determined the maximum distance within which 90% of patients traveled to receive dialysis in 2001. We compared the numbers of competing dialysis providers within that same distance between 2001 and 2011. Additionally, we examined the Herfindahl-Hirschman Index, a metric of market concentration ranging from near zero (perfect competition) to one (monopoly) for each hospital service area. Between 2001 and 2011, the number of different uniquely owned competing providers decreased 8%. However, increased facility entry into markets to meet rising demand for care offset the effect of provider consolidation on the number of choices available to patients. The number of dialysis facilities in the United States increased by 54%, and patients experienced an average 10% increase in the number of competing proximate facilities from which they could choose to receive dialysis (P<0.001). Local markets were highly concentrated in both 2001 and 2011 (mean Herfindahl-Hirschman Index =0.46; SD=0.2 for both years), but overall market concentration did not materially change. In summary, a decade of consolidation in the United States dialysis industry did not (on average) limit patient choice or result in more concentrated local markets. However, because dialysis markets remained highly concentrated, it will be important to understand whether market competition affects prices paid by private insurers, access to dialysis care, quality of care, and associated health outcomes.
Keywords: Choice Behavior; Chronic; Economic Analysis; Humans; Insurance; Insurance Carriers; Kidney Failure; Medicare; Outpatients; Ownership; Registries; Renal Insufficiency; United States; United States Renal Data System; dialysis; health policy; patient choice; peritoneal dialysis; renal dialysis.
Copyright © 2017 by the American Society of Nephrology.
Figures
References
-
- USRDS: Annual Data Report: Atlas of Chronic Kidney Disease and End-Stage Renal Disease in the United States, Bethesda, MD, National Institutes of Health, National Institute of Diabetes and Digestive and Kidney Diseases, 2013
-
- Department of Health and Human Services, Center for Medicare and Medicaid Services: Medicare Programs; End-Stage Renal Disease Prospective Payment System; Town Hall Meeting on End-Stage Renal Disease Prospective Payment System; Proposed Rule and Notice, Washington, DC, Department of Health and Human Services, 2009, pp 49922–50102
-
- Sullivan JD: The end-stage renal disease industry and exit strategies for nephrologists. Health Care Manag (Frederick) 25: 356–361, 2006 - PubMed
-
- Himmelfarb J, Berns A, Szczech L, Wesson D: Cost, quality, and value: The changing political economy of dialysis care. J Am Soc Nephrol 18: 2021–2027, 2007 - PubMed
MeSH terms
Grants and funding
LinkOut - more resources
Full Text Sources
Other Literature Sources
Medical
