. 2016 Nov 10;7(11):e2466.
doi: 10.1038/cddis.2016.279.

Tissue-type plasminogen activator controls neuronal death by raising surface dynamics of extrasynaptic NMDA receptors

Affiliations

Tissue-type plasminogen activator controls neuronal death by raising surface dynamics of extrasynaptic NMDA receptors

Flavie Lesept et al. Cell Death Dis. .

Abstract

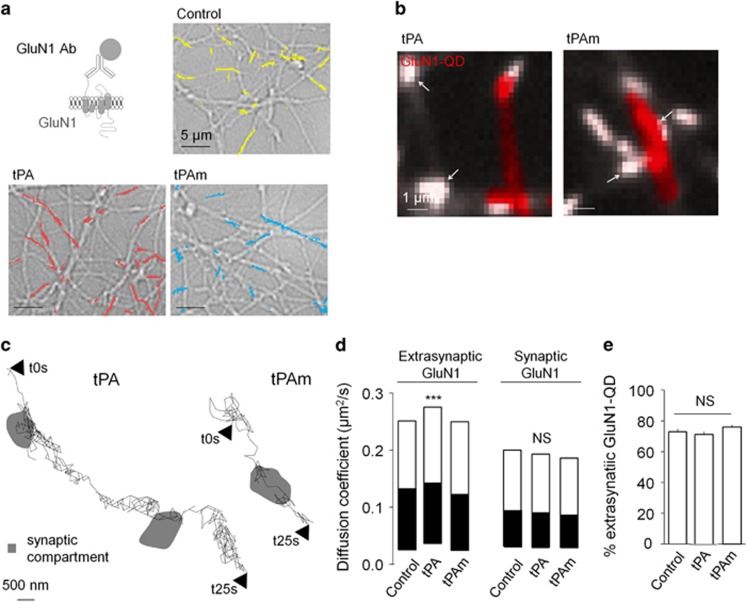
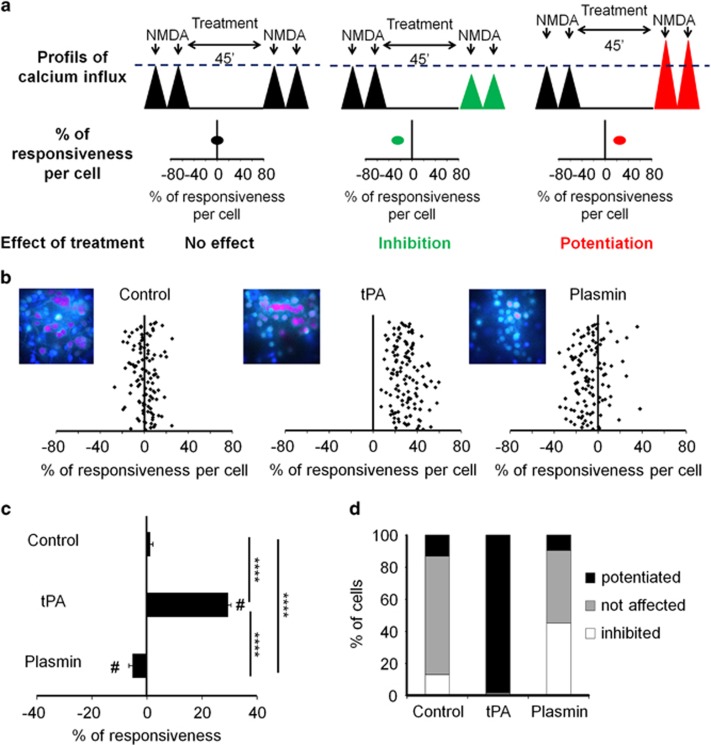
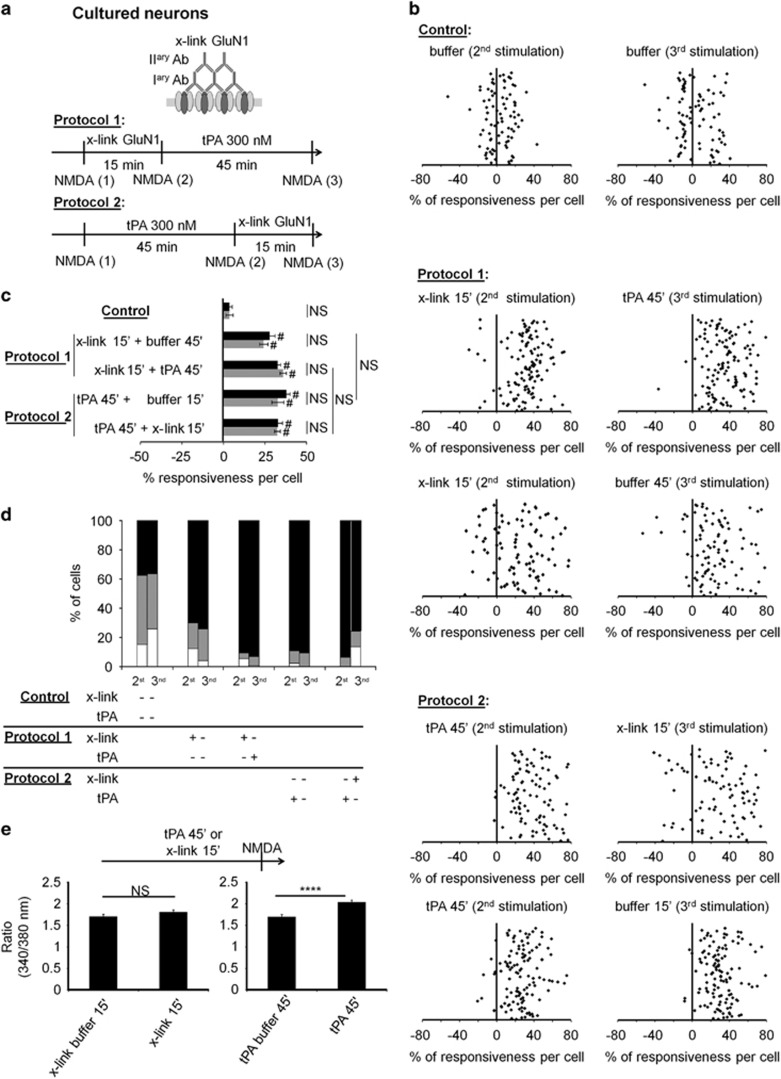
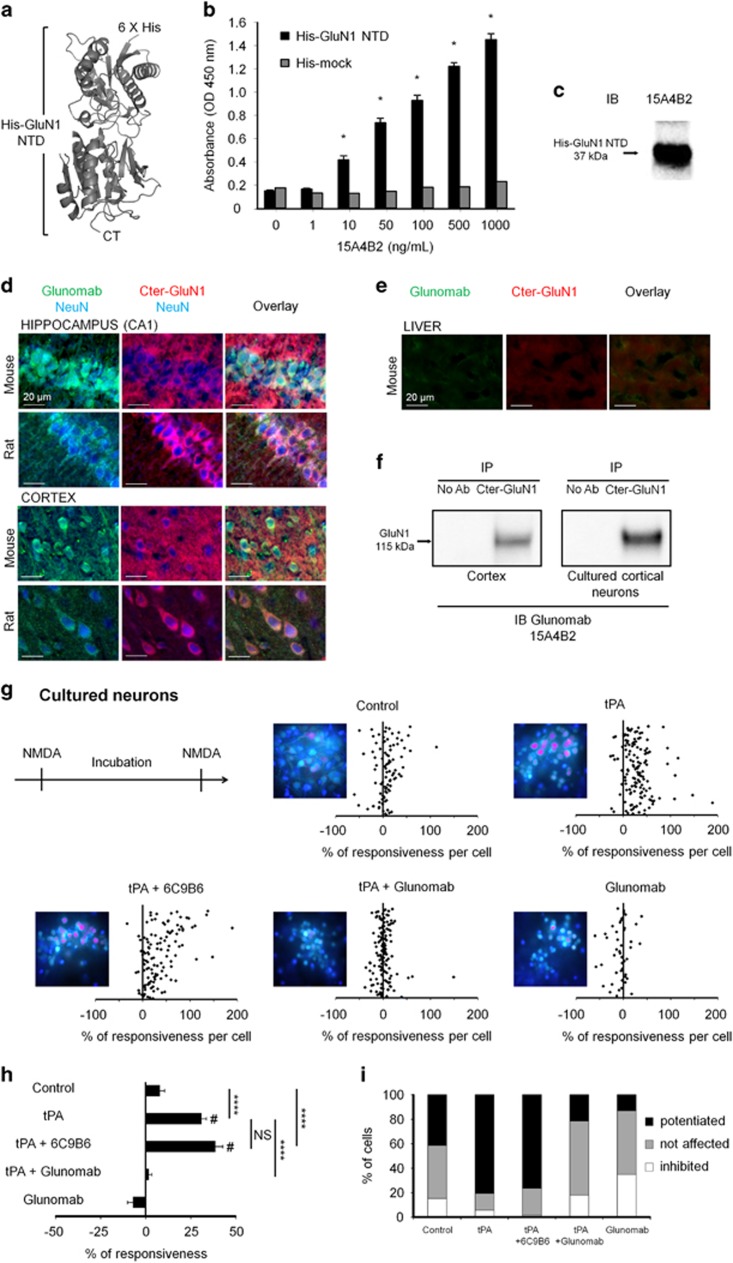
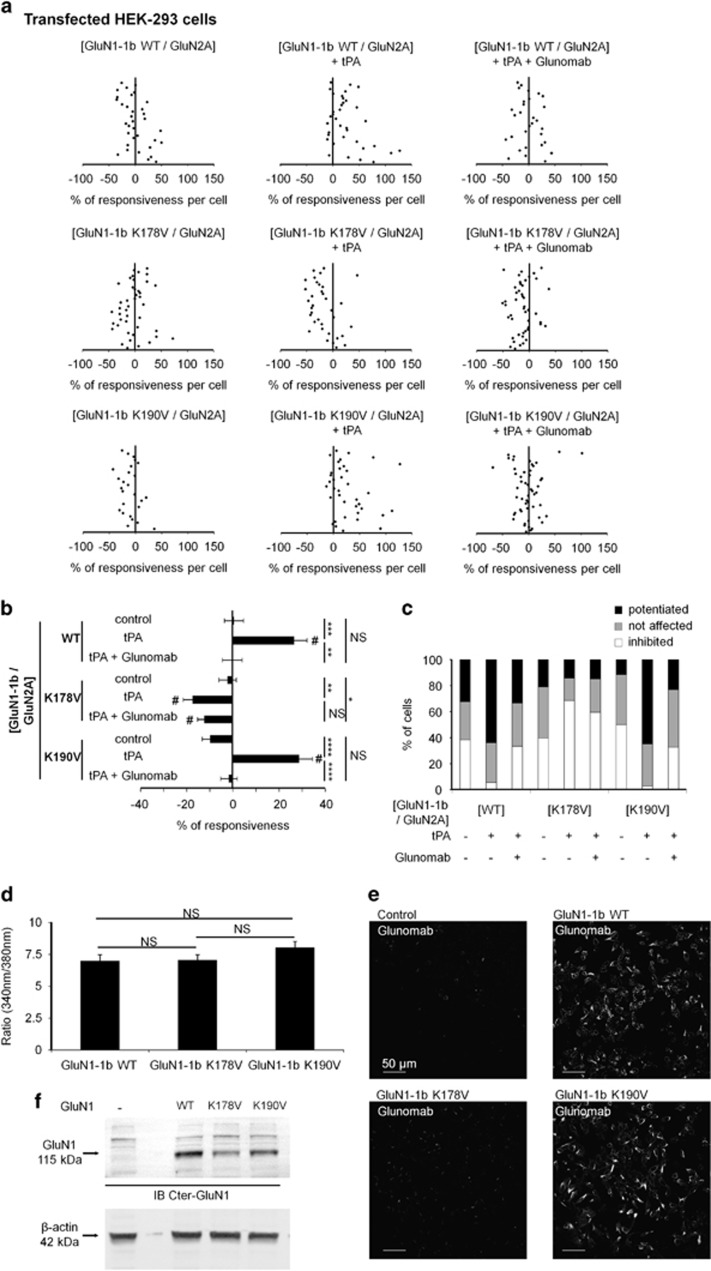
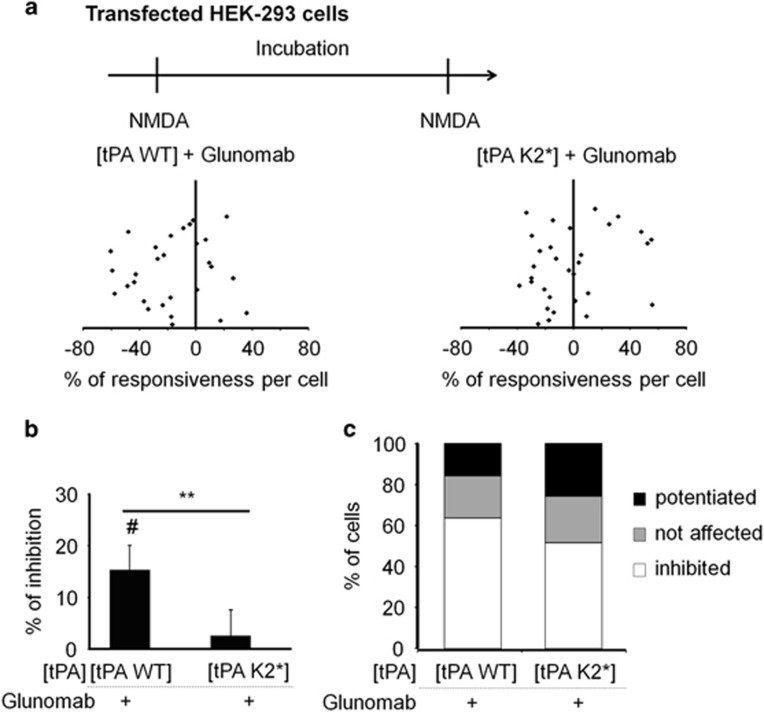
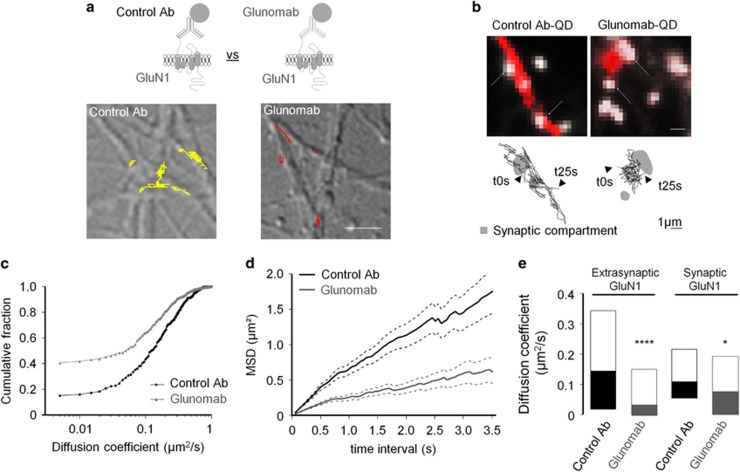
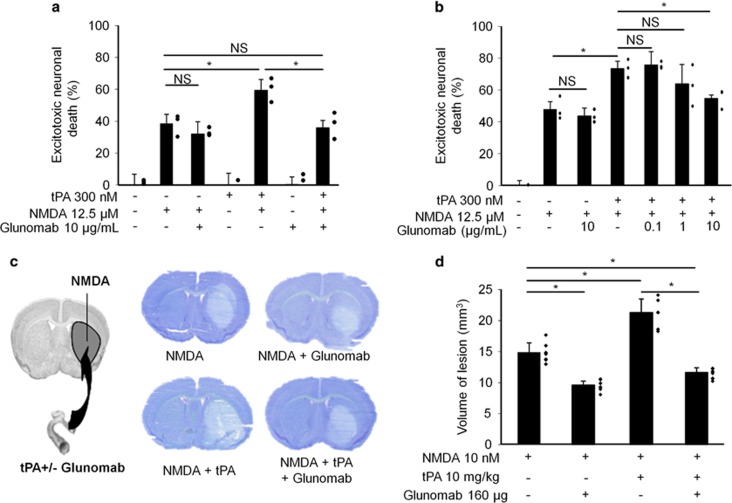
N-methyl-d-aspartate receptors (NMDARs) are ion channels whose synaptic versus extrasynaptic localization critically influences their functions. This distribution of NMDARs is highly dependent on their lateral diffusion at the cell membrane. Each obligatory subunit of NMDARs (GluN1 and GluN2) contains two extracellular clamshell-like domains with an agonist-binding domain and a distal N-terminal domain (NTD). To date, the roles and dynamics of the NTD of the GluN1 subunit in NMDAR allosteric signaling remain poorly understood. Using single nanoparticle tracking in mouse neurons, we demonstrate that the extracellular neuronal protease tissue-type plasminogen activator (tPA), well known to have a role in the synaptic plasticity and neuronal survival, leads to a selective increase of the surface dynamics and subsequent diffusion of extrasynaptic NMDARs. This process explains the previously reported ability of tPA to promote NMDAR-mediated calcium influx. In parallel, we developed a monoclonal antibody capable of specifically blocking the interaction of tPA with the NTD of the GluN1 subunit of NMDAR. Using this original approach, we demonstrate that the tPA binds the NTD of the GluN1 subunit at a lysine in position 178. Accordingly, when applied to mouse neurons, our selected antibody (named Glunomab) leads to a selective reduction of the tPA-mediated surface dynamics of extrasynaptic NMDARs, subsequent signaling and neurotoxicity, both in vitro and in vivo. Altogether, we demonstrate that the tPA is a ligand of the NTD of the obligatory GluN1 subunit of NMDAR acting as a modulator of their dynamic distribution at the neuronal surface and subsequent signaling.


Conflict of interest statement

DV, CA, K-UP and RM are co-inventors on the following patent 'Treatment of neurological or neurodegenerative disorders' (WO2011023250A1). The original patent W02011023250A1 was completed and now published under the number W02014187879A2 (additional references: EP2805972A1, WO2014187879A3). The present invention relates to the field of antibodies. In particular, it provides an anti-NMDA antibody or fragment or derivative thereof which is effective in inhibiting the deleterious effects of tissue-type plasminogen activator (tPA) mediated by N-methyl-d-aspartate (NMDA) receptors being toxic to neurons and inflicting damage to the neurovascular unit/blood–brain barrier (BBB) or regulating it in a way that leads to pathological consequences.

Figures

Figure 1
Figure 1
tPA selectively increases extrasynaptic GluN1-NMDAR surface diffusion. (a) Schematic representation of the surface labeling of a GluN1 subunit using a single anti-GluN1 antibody QD complex. Representative GluN1-QD (GluN1 QD) trajectories on cultured hippocampal neurons (11–12 DIV) incubated 45 min with buffer (yellow), WT tPA (300 nM, red) or a non-proteolytic tPA (tPAm, 300 nM, cyan). (b) Representative trajectories of surface GluN1-QD (red lines, 500 frames, 50-ms acquisition) in the vicinity and within synapses (white arrows). Synaptic trajectories are defined by their colocalization with synaptic labeling (Mitotracker, white), trajectories outside synapses being considered as extrasynaptic. (c) Representative trajectories of GluN1-NMDAR tracked with a control GluN1 NTD antibody (control Ab) in the presence of tPA or tPAm (300 nM both). (d) Instantaneous diffusion coefficient distributions (median 25–75% IQR,) of extrasynaptic (control n=3882 trajectories; tPAm n=3195; tPA n=3701; N=3 independent experiments; ***P<0.001, Kruskal–Wallis test followed by Dunn's multiple comparison test) versus synaptic GluN1-QD (control n=4411 trajectories; tPAm n=2818; tPA n=4283). Note that GluN1 surface diffusion is specifically increased in the extrasynaptic compartment after tPA incubation. (e) Fraction of extrasynaptic GluN1-QD is unchanged between the different incubations (control 73%, n=18; tPAm 76%, n=20; tPA 71%, n=17; NS, not significant, one-way ANOVA; mean±S.E.M.)
Figure 2
Figure 2
tPA-induced potentiation of NMDAR-mediated neuronal calcium influx is independent of plasmin. (a) Schematic representation of calcium video imaging on primary cultures of cortical neurons (12–14 DIV). The neurons were stimulated twice with the NMDA, then incubated with the treatment during 45 min prior a second run of NMDA stimulations. Each neuron responsive to NMDA is thus its own control. By comparison between the two runs of NMDA stimulations (% of responsiveness per cell), we visualized the effect of treatment on NMDA-induced calcium influx estimated the % of responsiveness per cell with either no effect of the treatment, an inhibitory effect or a potentiating effect. Each dot represents one individual neuron, with data collected from a minimum of three independent experiments. (b) After control NMDA stimulations used as baseline, neurons were incubated for 45 min with either plasmin buffer (control, n=107 cells), tPA (300 nM, n=123 cells) or plasmin (100 μg/ml; n=115 cells). Each dot represents one cell. (c) Percentage of stimulation or inhibition after incubation were calculated for each individual cell and reported as the percentages of responsiveness for each group (mean±S.E.M.; N=3 independent experiments; ****P<0.0001 Kruskal–Wallis and Mann–Whitney tests for group comparison; #P<0.0001 Wilcoxon signed-rank test for the comparison pre- and post-incubation responses). (d) Represents the percentages of potentiated, not affected and inhibited cells
Figure 3
Figure 3
tPA mimicks x-link-induced NMDARs clustering. (a) Schematic representation of the x-link procedure performed on cultured cortical neurons and used to induce an artificial clustering of GluN1-NMDAR,, , as well as the detailed sequence of treatments. (b) NMDA-induced calcium influx measured after the following treatments: buffer alone (n=85 cells), x-link 15' then tPA 45' (protocol 1, n=128 cells) or tPA buffer 45'(n=97 cells) and tPA 45' then x-link 15' (protocol 2, n=95 cells) or x-link buffer 15' (n=114 cells). Each dot represents one cell. (c) Percentage of stimulation or inhibition after incubation were calculated for each individual cell and reported as percentages of responsiveness for each group. (mean±S.E.M.; N=3 independent experiments; NS, not significant; ****P<0.0001 Kruskal–Wallis test followed by Mann–Whitney test for group comparison; #P<0.0001 Wilcoxon signed-rank test for the comparison pre- and post-incubation responses). (d) Percentages of potentiated, not affected and inhibited cells. (e) Comparison of the amplitudes of calcium influx after tPA 45' (n=87 cells) or x-link 15' (n=77 cells) treatments and their controls (tPA buffer 45', n=68 cells; x-link buffer 15', n=92 cells) without a pre-treatment with NMDA (as shown on the diagram). Effects of tPA 45' or x-link 15' are not dependent of the pre-incubation NMDA stimulation. In contrast to tPA 45' condition, the x-link does not lead a augmentation of calcium influx amplitude. (mean±S.E.M.; N=3 independent experiments; ****P<0.0001 Mann–Whitney test for group comparison)
Figure 4
Figure 4
Production and characterization of Glunomab (clone 15A4B2), a monoclonal antibody raised against GluN1 NTD. (a) Structure of the bilobate amino-terminal domain of GluN1 (GluN1 NTD, PDB ID: 3Q41). The GluN1 NTD was used as antigen for immunization assays in mice. (b) Example of an indirect ELISA assay performed with conditioned media harvested from Glunomab (clone 15A4B2), using a His-tagged mock protein as a control or the His-GluN1 NTD as the specific antigen (1–1000 ng/ml of antibody, N=4 independent experiments; *P<0.05 compared between one dose and previous dose; Kruskal–Wallis and Mann–Whitney tests). (c) Immunoblotting performed after SDS-PAGE resolution of recombinant His-GluN1 NTD (20 μg loaded per lane) and immunoglobulin Glunomab (clone 15A4B2) as the primary antibody (N=2 experiments). (d) Immunostaining performed from hippocampal (CA1) and cortical tissue sections (mice and rats) using either Glunomab (clone 15A4B2) (1 : 400, green) or an antibody against the C-terminal GluN1 subunit (Cter-GluN1, 1 : 400, red) or NeuN (1 : 250, blue). (e) Control immunostainings performed from liver tissue sections (mice) using either Glunomab (clone 15A4B2) (1 : 400, green) or an antibody against the C-terminal GluN1 subunit (Cter-GluN1, 1 : 400, red). (f) Immunoprecipitation (IP) assays from mouse cortices or primary cultures of cortical neurons using Cter-GluN1 subunit antibody followed by immunoblotting (IB) using Glunomab (clone 15A4B2) (representative data of three independent samples). (g) Calcium video imaging was performed on primary cultures of cortical neurons (12–14 DIV, see Materials and Methods section). After two successive control NMDA stimulations, neurons were incubated for 45 min with buffer (control, n=98 cells), Glunomab alone (10 μg/ml, n=46 cells), tPA alone (300 nM, n=139 cells) or with immunoglobulins corresponding to Glunomab (clone 15A4B2) (10 μg/ml, n=139 cells) or the clone 6C9B6 (10 μg/ml, n=119 cells). A second set of NMDA stimulations was then performed. Each dot represents one cell. Each graph is accompanied by an image during NMDA stimulation after treatment. (h) Percentage of stimulation or inhibition after incubation were calculated for each individual cell and reported as percentages of responsiveness for each group (mean±S.E.M.; N=3 independent experiments; NS, not significant; ****P<0.0001; Kruskal–Wallis and Mann–Whitney tests for group comparison; #P<0.0001 Wilcoxon signed-rank test for the comparison pre- and post-incubation responses). (i) Percentages of potentiated, not affected and inhibited cells
Figure 5
Figure 5
tPA-induced potentiation of NMDAR signaling involves the lysine 178 of the GluN1 NTD (GluN1 NTDLys178). (a) Calcium video imaging performed on HEK-293 cells transiently transfected with either GluN1-1b WT, K178V mutated GluN1-1b or K190V mutated GluN1-1b in combination with WT GluN2A. After control NMDA stimulations (used as baseline), transfected cells with GluN1-1b WT and GluN2A were incubated for 20 min with either buffer (control, n=34 cells), tPA (300 nM, n=36 cells) and/or Glunomab (10 μg/ml, n=30 cells), before a second set of NMDA stimulations. The same set of NMDA stimulations were applied on cells transfected with mutated GluN1-1b K178V or mutated GluN1-1b K190V incubated with either buffer (n=43 cells or n=26, respectively) or tPA (300 nM, n=35 cells or n=37, respectively) or tPA with Glunomab (n=47 cells and n=52 cells, respectively). Each dot represents one cell. (b) Percentage of stimulation or inhibition after incubation were calculated for each individual cell and reported as the percentages of responsiveness for each group (mean±S.E.M.; N=3 independent experiments; *P<0.05; **P<0.01; ***P<0.001; ****P<0.0001 Kruskal–Wallis and Mann–Whitney tests for group comparison; #P<0.01 Wilcoxon signed-rank test for the comparison pre- and post-incubation responses). (c) Percentages of potentiated, not affected and inhibited cells. (d) Calcium video imaging performed on HEK-293 cells transiently transfected with either GluN1-1b WT, K178V mutated GluN1-1b or K190V mutated GluN1-1b in combination with WT GluN2A. Before an incubation with different treatment, two first NMDA stimulations (100 μM) were performed on transfected HEK-293 cells with GluN1-1b WT (or K178V or K190V) and GluN2A. The K178V and K190V point mutations within GluN1 do not influence the basal activity of NMDAR in the absence of tPA. (mean±S.E.M.; N=3 independent experiments; NS, not significant; Kruskal–Wallis and Mann–Whitney tests for group comparison). (e) Representative images of immunolabelings revealed with Glunomab (as primary antibody, 1 : 800) performed on HEK-293 cells transiently transfected with either GluN1-1b WT, mutated GluN1-1b K178V or mutated GluN1-1b K190V in combination with WT GluN2A (N=3 independent experiments). (f) Immunoblotting raised against GluN1 (Cter-GluN1, 1 : 250) performed from protein extracts of HEK-293 cells transiently transfected with either GluN1-1b WT, K178V mutated GluN1-1b or K190V mutated GluN1-1b in combination with WT GluN2A and a loading control using β-actin antibody (20 μg loaded per lane, N=1 experiment)
Figure 6
Figure 6
tPA-induced potentiation of NMDAR signaling is dependent of the LBS of the tPA kringle 2 domain (kringle 2-tPALBS). (a) Calcium video imaging performed on HEK-293 cells transiently transfected with GluN1-1b WT and GluN2A in combination with tPA WT or a tPA containing a point mutation within its LBS-containing kringle 2 domain (W254, tPA K2*). After control NMDA stimulations (used as baseline), transfected HEK-293 cells with either GluN1-1b/GluN2A/tPA WT (n=44 cells) or GluN1-1b/GluN2A/tPA K2* (n=31 cells) were incubated for 20 min with Glunomab (10 μg/ml), before a second set of NMDA stimulations. (b) Percentages of inhibition after incubation with Glunomab were calculated for each individual cell and reported as the percentages of inhibition for each group (mean±S.E.M.; N=3 independent experiments; **P<0.01 Kruskal–Wallis and Mann–Whitney tests for group comparison; #P<0.01 Wilcoxon signed-rank test for the comparison pre- and post-incubation responses). (c) Percentages of potentiated, not affected and inhibited cells
Figure 7
Figure 7
Blockage of the ability of tPA to bind GluN1 NTD alters extrasynaptic GluN1-NMDARs surface diffusion and increases their confined behavior. (a) Up: GluN1-NMDAR tracked using a single anti-GluN1 antibody QD complex obtained either by coupling a control GluN1 NTD subunit antibody (control Ab, Alomone Labs, 1 : 200) or the Glunomab antibody (1 : 200) to QDs. Down: representative GluN1-QD (GluN1 QD) trajectories on cultured hippocampal neurons (11–12 DIV) with control Ab (yellow) or Glunomab (red). (b) Representative trajectories of surface GluN1-QD (black lines, 500 frames, 50-ms acquisition) in the vicinity and within synapses (white arrows). Synaptic trajectories are defined by their colocalization with synaptic labeling (Mitotracker, white), trajectories outside synapses being considered as extrasynaptic. Note that the diffusion of NMDAR targeted by Glunomab is reduced outside synapses. Scale bar=1 μm. (c) Cumulative distribution of the instantaneous diffusion coefficient of NMDARs targeted by the control Ab or Glunomab. The population of NMDAR targeted by Glunomab shows a reduced diffusion speed and a higher proportion of immobile receptors compared with the one tracked with the control Ab (immobile fraction Control Ab=15% Glunomab=41%). (d) Plot of the MSD versus time of total GluN1 tracked with control Ab (n=273 trajectories) or Glunomab (n=129). The red curve (Glunomab) tends toward a negative curvature, characteristic of a confined behavior. (e) Instantaneous diffusion coefficient distributions (median 25–75% IQR) of extrasynaptic (control Ab=0.1489 μm2/s IQR=0.0228–0.3476 μm2/s, n=148 trajectories; Glunomab=0.0318 μm2/s IQR=0.00008–0.1532 μm2/s, n=261) versus synaptic GluN1-QD (control Ab=0.1132 μm2/s IQR=0.0511–0.2148 μm2/s, n=170 trajectories; Glunomab=0.0764 μm2/s IQR=0.0014–0.1909 μm2/s n=146; *P<0.05, ****P<0.001; Kruskal–Wallis and Dunn's multiple comparison test)
Figure 8
Figure 8
Blockage of the ability of tPA to bind GluN1 NTD interaction prevents the pro-excitotoxic effects of tPA in vitro and in vivo without alter its anti-apoptotic effect. (a) Neuronal death was assessed on primary cultured cortical neurons (12–14 DIV) by measuring LDH release in the bathing media after 24-h exposure to NMDA alone (12.5 μM) or in the presence of tPA (300 nM) and/or Glunomab (10 μg/ml) (mean±S.E.M.; N=3 independent experiments, including n=9 individual dishes per condition; each spot represents an average value for the three independent experiments; NS, not significant, *P<0.05; Kruskal–Wallis and Mann–Whitney tests). (b) Same experiments as in (a) were performed in the presence of decreasing concentrations of Glunomab (10, 1, 0.1 μg/ml; mean±S.E.M.; N=3 independent experiments, including n=9 individual dishes per condition; *P<0.05; Kruskal–Wallis and Mann–Whitney tests; each spot represents an average value for the three independent experiments). (c) Left: schematic representation of unilateral striatal injection of NMDA (10 nmoles, 1 μl). Right: illustrative images of excitotoxic lesions in all conditions. (d) Quantification of volume of excitotoxic lesions (mean±S.E.M.; n=7, 8 or 9 mice per group; *P<0.05 Kruskal–Wallis and Mann–Whitney tests; each spot represents individual lesion volumes).

Similar articles

Cited by

References

    1. Paoletti P, Bellone C, Zhou Q. NMDA receptor subunit diversity: impact on receptor properties, synaptic plasticity and disease. Nat Rev Neurosci 2013; 14: 383–400. - PubMed
    1. Hardingham GE, Bading H. Synaptic versus extrasynaptic NMDA receptor signalling: implications for neurodegenerative disorders. Nat Rev Neurosci 2010; 11: 682–696. - PMC - PubMed
    1. Groc L, Heine M, Cousins SL, Stephenson FA, Lounis B, Cognet L et al. NMDA receptor surface mobility depends on NR2A-2B subunits. Proc Natl Acad Sci USA 2006; 103: 18769–18774. - PMC - PubMed
    1. Bard L, Sainlos M, Bouchet D, Cousins S, Mikasova L, Breillat C et al. Dynamic and specific interaction between synaptic NR2-NMDA receptor and PDZ proteins. Proc Natl Acad Sci USA 2010; 107: 19561–19566. - PMC - PubMed
    1. Triller A, Choquet D. Surface trafficking of receptors between synaptic and extrasynaptic membranes: and yet they do move!. Trends Neurosci 2005; 28: 133–139. - PubMed

Publication types

MeSH terms

LinkOut - more resources