

Imaging Biomarkers of Tumor Response in Neuroendocrine Liver Metastases Treated with Transarterial Chemoembolization: Can Enhancing Tumor Burden of the Whole Liver Help Predict Patient Survival?
- PMID: 27831830
- PMCID: PMC5425309
- DOI: 10.1148/radiol.2016160838
Imaging Biomarkers of Tumor Response in Neuroendocrine Liver Metastases Treated with Transarterial Chemoembolization: Can Enhancing Tumor Burden of the Whole Liver Help Predict Patient Survival?
Abstract
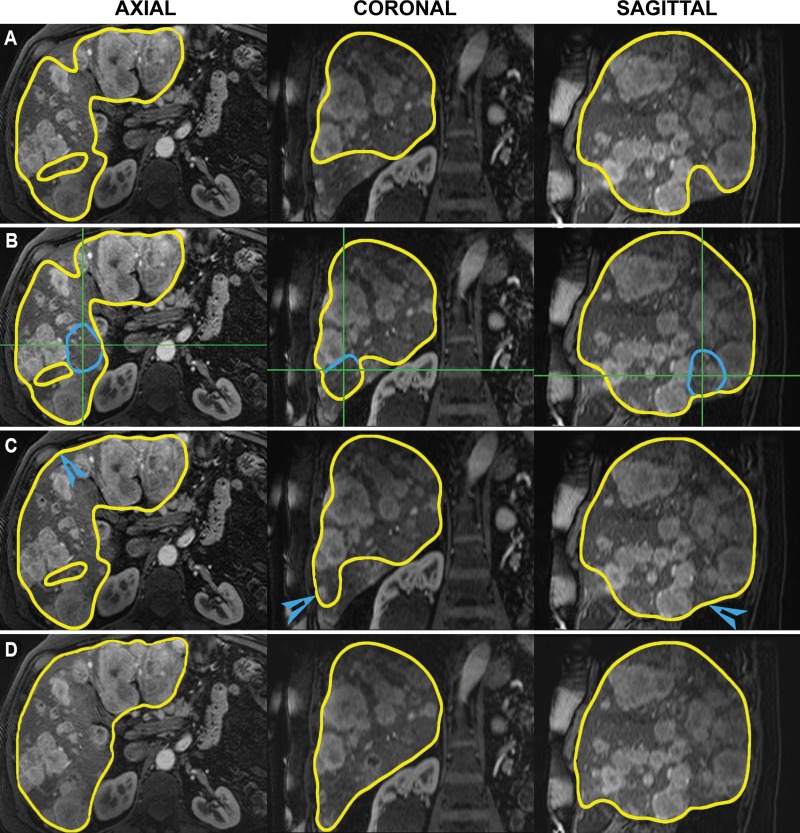
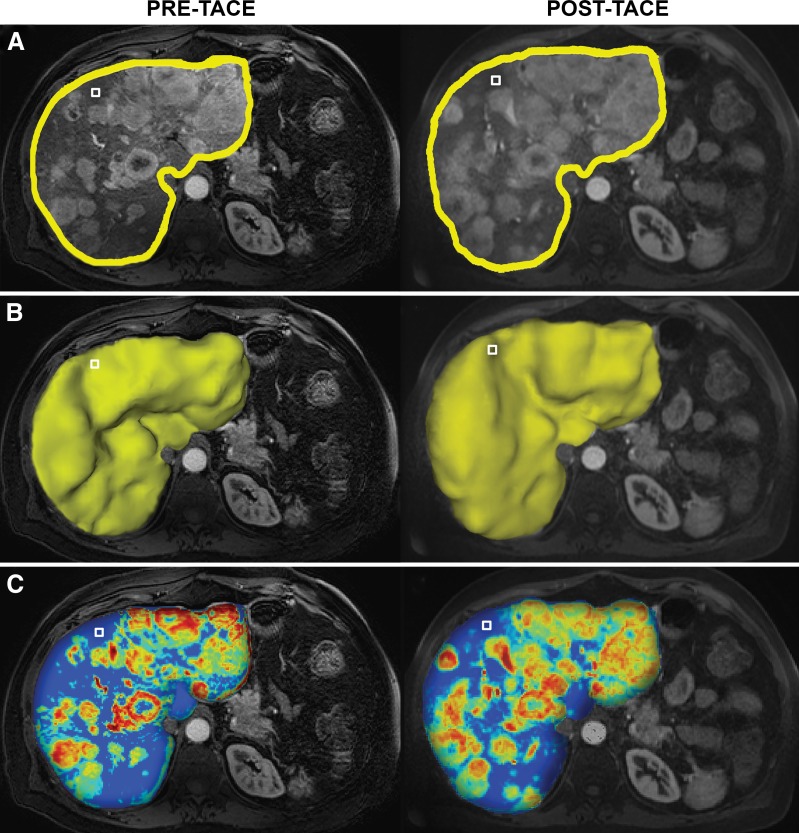
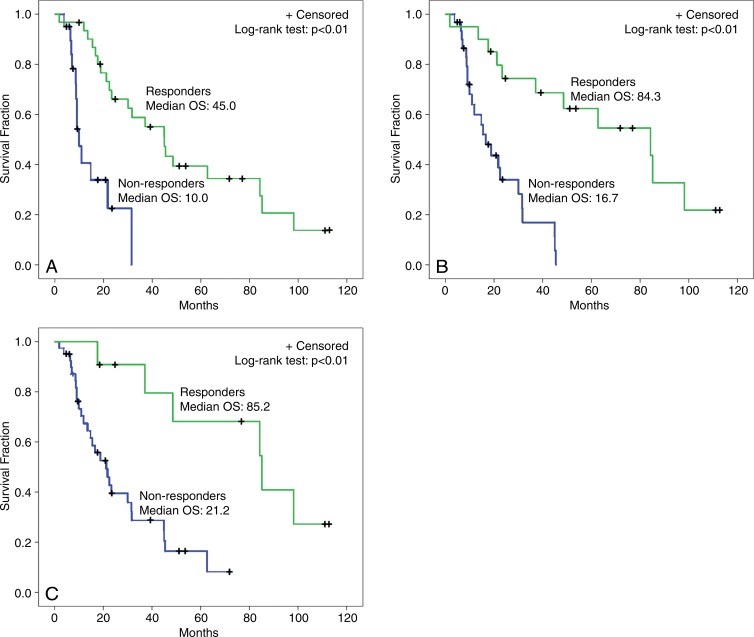
Purpose To investigate whether whole-liver enhancing tumor burden [ETB] can serve as an imaging biomarker and help predict survival better than World Health Organization (WHO), Response Evaluation Criteria in Solid Tumors (RECIST), modified RECIST (mRECIST), and European Association for the Study of the Liver (EASL) methods in patients with multifocal, bilobar neuroendocrine liver metastases (NELM) after the first transarterial chemoembolization (TACE) procedure. Materials and Methods This HIPAA-compliant, institutional review board-approved retrospective study included 51 patients (mean age, 57.8 years ± 13.2; range, 13.5-85.8 years) with multifocal, bilobar NELM treated with TACE. The largest area (WHO), longest diameter (RECIST), longest enhancing diameter (mRECIST), largest enhancing area (EASL), and largest enhancing volume (ETB) were measured at baseline and after the first TACE on contrast material-enhanced magnetic resonance images. With three-dimensional software, ETB was measured as more than 2 standard deviations the signal intensity of a region of interest in normal liver. Response was assessed with WHO, RECIST, mRECIST, and EASL methods according to their respective criteria. For ETB response, a decrease in enhancement of at least 30%, 50%, and 65% was analyzed by using the Akaike information criterion. Survival analysis included Kaplan-Meier curves and Cox regressions. Results Treatment response occurred in 5.9% (WHO criteria), 2.0% (RECIST), 25.5% (mRECIST), and 23.5% (EASL criteria) of patients. With 30%, 50%, and 65% cutoffs, ETB response was seen in 60.8%, 39.2%, and 21.6% of patients, respectively, and was the only biomarker associated with a survival difference between responders and nonresponders (45.0 months vs 10.0 months, 84.3 months vs 16.7 months, and 85.2 months vs 21.2 months, respectively; P < .01 for all). The 50% cutoff provided the best survival model (hazard ratio [HR]: 0.2; 95% confidence interval [CI]: 0.1, 0.4). At multivariate analysis, ETB response was an independent predictor of survival (HR: 0.2; 95% CI: 0.1, 0.6). Conclusion Volumetric ETB is an early treatment response biomarker and surrogate for survival in patients with multifocal, bilobar NELM after the first TACE procedure. © RSNA, 2016.
Figures
Similar articles
-
Comparison of Existing Response Criteria in Patients with Hepatocellular Carcinoma Treated with Transarterial Chemoembolization Using a 3D Quantitative Approach.Radiology. 2016 Jan;278(1):275-84. doi: 10.1148/radiol.2015142951. Epub 2015 Jul 1. Radiology. 2016. PMID: 26131913 Free PMC article.
-
Volumetric Enhancing Tumor Burden at CT to Predict Survival Outcomes in Patients with Neuroendocrine Liver Metastases after Intra-arterial Treatment.Radiol Imaging Cancer. 2023 Jan;5(1):e220051. doi: 10.1148/rycan.220051. Radiol Imaging Cancer. 2023. PMID: 36607243 Free PMC article.
-
Identifying Staging Markers for Hepatocellular Carcinoma before Transarterial Chemoembolization: Comparison of Three-dimensional Quantitative versus Non-three-dimensional Imaging Markers.Radiology. 2015 May;275(2):438-47. doi: 10.1148/radiol.14141180. Epub 2014 Dec 19. Radiology. 2015. PMID: 25531387 Free PMC article.
-
Optimizing the treatment of liver metastases from uveal melanomas with transarterial chemoembolization using melphalan and calibrated microspheres.Bull Cancer. 2020 Dec;107(12):1274-1283. doi: 10.1016/j.bulcan.2020.09.010. Epub 2020 Nov 9. Bull Cancer. 2020. PMID: 33183739 Review.
-
Prognostic Relevance of Objective Response According to EASL Criteria and mRECIST Criteria in Hepatocellular Carcinoma Patients Treated with Loco-Regional Therapies: A Literature-Based Meta-Analysis.PLoS One. 2015 Jul 31;10(7):e0133488. doi: 10.1371/journal.pone.0133488. eCollection 2015. PLoS One. 2015. PMID: 26230853 Free PMC article.
Cited by
-
Identifying enhancement-based staging markers on baseline MRI in patients with colorectal cancer liver metastases undergoing intra-arterial tumor therapy.Eur Radiol. 2021 Dec;31(12):8858-8867. doi: 10.1007/s00330-021-08058-7. Epub 2021 Jun 1. Eur Radiol. 2021. PMID: 34061209 Free PMC article.
-
Yttrium-90 transarterial radioembolization for liver metastases from medullary thyroid cancer.Eur Thyroid J. 2022 Oct 17;11(6):e220130. doi: 10.1530/ETJ-22-0130. Print 2022 Dec 1. Eur Thyroid J. 2022. PMID: 36126186 Free PMC article.
-
Predictive Factors for Resistant Disease with Medical/Radiologic/Liver-Directed Anti-Tumor Treatments in Patients with Advanced Pancreatic Neuroendocrine Neoplasms: Recent Advances and Controversies.Cancers (Basel). 2022 Feb 28;14(5):1250. doi: 10.3390/cancers14051250. Cancers (Basel). 2022. PMID: 35267558 Free PMC article. Review.
-
Long Term Efficacy and Assessment of Tumor Response of Transarterial Chemoembolization in Neuroendocrine Liver Metastases: A 15-Year Monocentric Experience.Cancers (Basel). 2021 Oct 26;13(21):5366. doi: 10.3390/cancers13215366. Cancers (Basel). 2021. PMID: 34771531 Free PMC article.
-
Role of 3D quantitative tumor analysis for predicting overall survival after conventional chemoembolization of intrahepatic cholangiocarcinoma.Sci Rep. 2021 Apr 29;11(1):9337. doi: 10.1038/s41598-021-88426-x. Sci Rep. 2021. PMID: 33927226 Free PMC article.
References
-
- Pape UF, Berndt U, Müller-Nordhorn J, et al. . Prognostic factors of long-term outcome in gastroenteropancreatic neuroendocrine tumours. Endocr Relat Cancer 2008;15(4):1083–1097. - PubMed
-
- Frilling A, Clift AK. Therapeutic strategies for neuroendocrine liver metastases. Cancer 2015;121(8):1172–1186. - PubMed
-
- Pavel M, Baudin E, Couvelard A, et al. . ENETS consensus guidelines for the management of patients with liver and other distant metastases from neuroendocrine neoplasms of foregut, midgut, hindgut, and unknown primary. Neuroendocrinology 2012;95(2):157–176. - PubMed
-
- Proye C. Natural history of liver metastasis of gastroenteropancreatic neuroendocrine tumors: place for chemoembolization. World J Surg 2001;25(6):685–688. - PubMed
-
- Modlin IM, Oberg K, Chung DC, et al. . Gastroenteropancreatic neuroendocrine tumours. Lancet Oncol 2008;9(1):61–72. - PubMed
Publication types
MeSH terms
Substances
Grants and funding
LinkOut - more resources
Full Text Sources
Other Literature Sources
Medical
Miscellaneous
