. 2016 Nov 9;8(364):364ra153.
doi: 10.1126/scitranslmed.aag2306.

Local and transient gene expression primes the liver to resist cancer metastasis

Affiliations

Local and transient gene expression primes the liver to resist cancer metastasis

Tyler J Goodwin et al. Sci Transl Med. .

Abstract

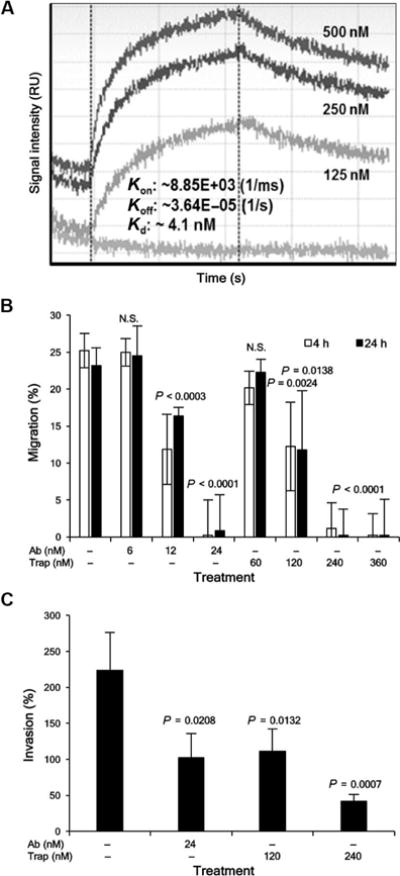
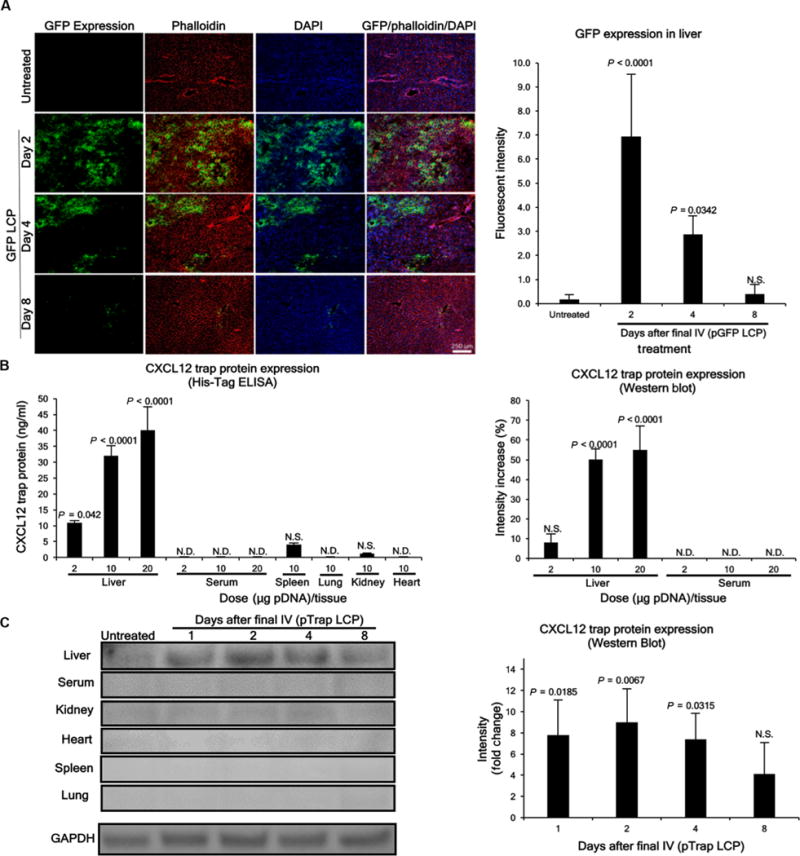
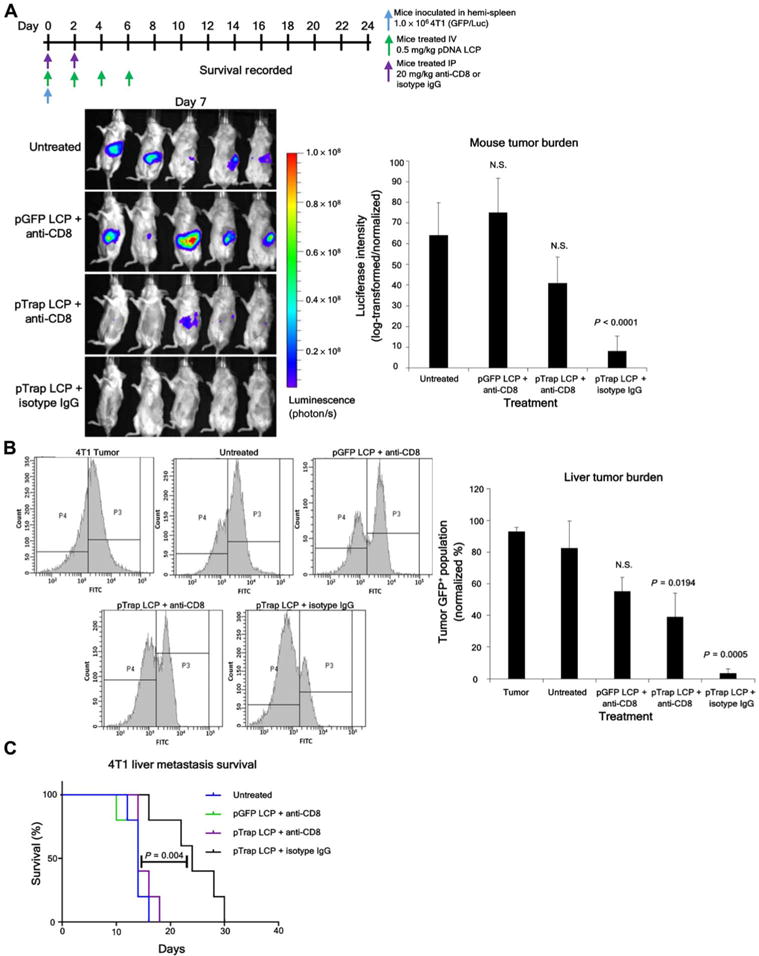
The liver is the primary site of metastasis for gastrointestinal cancers and is a location highly susceptible to the establishment of metastasis in numerous other primary cancers, including breast, lung, and pancreatic cancers. The current standard of care typically consists of primary tumor resection and systemic administration of potent but toxic chemotherapeutics, yielding a minimal improvement in the median survival rate. CXCL12, a chemokine, is a key factor for activating the migration/survival pathways of CXCR4+ cancer cells and for recruiting immunosuppressive cells to areas of inflammation. Therefore, reducing CXCL12 concentrations within the liver has the potential to decrease tumor and immunosuppressive cell activation/migration within the liver. However, because of off-target toxicities associated with systemic administration of anti-CXCL12 therapies, transient and liver-specific expression of a CXCL12 trap is necessary. To address this challenge, we developed a lipid calcium phosphate nanoparticle optimized for delivering plasmid DNA, encoding an engineered CXCL12 protein trap, to the nucleus of liver hepatocytes. This pCXCL12-trap formulation yielded transient (4 days) liver-specific expression, which greatly decreased the occurrence of liver metastasis in two aggressive liver metastasis models, including colorectal [CT-26(FL3)] and breast (4T1) cancers. Subsequent studies in an aggressive human colorectal liver metastasis model (HT-29) decreased the establishment of liver metastasis more effectively than did systemic administration of the CXCL12 protein trap and to a level comparable to a high-dose regimen of a potent CXCR4 antagonist (AMD3100).


Conflict of interest statement

Competing interests: U.S. Provisional Patent application no. 62/232,169 was filed on 24 September 2015 covering the LCP and pTrap technologies described.

Figures

Fig. 1
Fig. 1. Binding affinity and effect of engineered CXCL12 trap protein on in vitro cellular migration and invasion
(A) Binding affinity between CXCL12 trap and CXCL12 measured by BLI, where CXCL12 was immobilized on the AR2G biosensor and the binding kinetics were measured against no CXCL12 trap (0 nM) and increasing concentrations of CXCL12 trap (125, 250, and 500 nM) to determine the kon and koff rates depicted by the tracing of signal intensities versus time. The Kd was calculated to be 4.1 ± 0.4 nM after determining the on and off rate depicted. RU, resonance units. (B) The Chemotaxis Migration Assay Kit (EMD Millipore) with a pore size of 8 μm was used to investigate inhibition of cellular migration. We analyzed CT-26(FL3) cell migration toward a concentration gradient of CXCL12 (10 nM) in the presence of CXCL12 trap (60, 120, 240, or 360 nM). A positive control CXCL12 antibody (6, 12, or 24 nM) was also used. The engineered CXCL12 trap was found to have one-half maximal inhibition (ND50) against biologically active CXCL12 (10 nM) at a concentration of 120 nM. (C) Invasion Assay Kit (EMD Millipore) with a pore size of 8 μm and ECMatrix were used to analyze the increase in CT-26(FL3) cell invasion toward a concentration gradient of CXCL12 (10 nM) in the presence or absence of CXCL12 trap (120 or 240 nM) or control CXCL12 antibody (24 nM). Data are means ± SD, calculated from samples performed in triplicate and as a percentage of untreated (no CXCL12 or treatment protein) control. Cell migration and invasion were determined through cell collection, lysis, and quantification by luciferase bio-luminescent analysis. Statistical significance is indicated in graph compared to the control containing CXCL12 (10 nM) in the feeder (lower) plate without CXCL12 trap or antibody. N.S., not significant.
Fig. 2
Fig. 2. Transient liver-specific expression of pGFP and engineered pTrap
(A) Microscopy analysis of GFP expression in major LCP-accumulating organs. The liver sections demonstrate transient expression for at least 4 days after the final injection (10 mg every other day × 3). Scale bar, 250 μm. Data are means ± SD, calculated from at least triplicated samples and reported as fluorescence intensity quantified by ImageJ software. N.D., under detection limit; P values represent significance of the difference from untreated sample. Scale bar, 250 μm. DAPI, 4′,6-diamidino-2-phenylindole; IV, intravenous. (B) His(6×)-tag ELISA and Western blot analysis were conducted to determine the organ distribution/expression of the pTrap in all major LCP-accumulating organs and serum. Doses were escalated from 2.0 to 10.0 and 20.0 mg of pDNA administered via tail vein. (C) Western blot analysis of organs shows CXCL12 trap expression using His(6×) monoclonal antibody. The expression is transient and only lasts for 4 to 8 days after the final injection (10 mg every other day × 3). Total protein concentrations were determined by bicinchoninic acid assay, BCA, and 50 mg of total protein was loaded per well/lane. Trap protein was detected at 28.6 kDa, as confirmed by a protein standard ladder, consistent with the theoretical value. Glyceraldehyde-3-phosphate dehydrogenase (GAPDH) was used as a loading control, except in the serum samples, where GAPDH is not present. Data are means ± SD, calculated from samples run in triplicate and shown as a fold increase compared to untreated control. The P values of groups compared to corresponding untreated control are displayed in graphs.
Fig. 3
Fig. 3. Biological trapping of endogenous CXCL12 and immune cell recruitment
(A) Endogenous CXCL12 expression in paraffin-embedded sections of liver tissues from BALB/c mouse models of CRC sacrificed 10 days after the final treatment injection and control healthy livers [healthy (no CRC)]. Immunofluorescence stain for CXCL12 (red), along with DAPI nuclear stain (blue). Five groups were studied, including healthy (no CRC), untreated (PBS), pGFP LCP control [10 mg every other day (QOD) × 3], pTrap LCP (10 mg), and pTrap LCP (10 mg every other day × 3). All data are means ± SD, calculated from samples run in triplicate and reported as fluorescence intensity. The P values of individual groups compared to corresponding untreated control are displayed in graphs. (B) Additional sections were stained to determine the recruitment of immune cells to the liver, including immunosuppressive anti-inflammatory MDSCs [CDllb+ (green)/GR1+ (red)] and Tregs [CD4+ (green)/Foxp3+ (red)] as well as the CD8+ T cell population (green). Four groups were studied, including healthy (no CRC), untreated (tumor), untreated (stroma), and pTrap LCP (10 mg every other day × 3). Trichrome staining is also shown to distinguish normal and diseased liver. White arrows indicate metastatic lesions. All data are means ± SD, calculated from samples run in triplicate and reported as fluorescence intensity relative to untreated control. The P values of individual groups compared to corresponding untreated control are displayed in graphs. Scale bars, 250 μm.
Fig. 4
Fig. 4. Decreased incidence of liver metastasis after pTrap LCP treatment
(A) Mice were inoculated with 2 × 10⁶ CT-26(FL3) RFP/Luc cells into the cecum wall. Treatment schedule is shown above. Treatment, 10 mg (0.5 mg/kg) of pDNA, was administered intravenously through the tail vein on days 10, 12, and 14. Groups included PBS (untreated; n = 7) and pGFP LCP (10 mg every other day × 3; n = 6), as well as pTrap LCP (10 mg every other day × 3; n = 7). Progression of overall tumor mass was followed by administration of 200 of ml luciferin (10 mg/ml) intraperitoneally. Luciferase bioluminescence imaging was recorded 10 min after administration of luciferin. Whole mouse and liver tumor burden were recorded. All data are means ± SD and reported as bioluminescent intensity. The P values of individual groups compared to corresponding untreated control are displayed in graph. (B) Total organ tumor burden of untreated (n = 3) and therapeutic pTrap LCP (n = 4) groups. Quantification of tumor burden in organs was performed with IVIS/Kodak software. All data are means ± SD and reported as bioluminescent intensity. The P values of individual groups compared to corresponding untreated control are displayed in graph. (C) Paraffin-embedded liver sections were stained with trichrome. Large tumor burden (indicated by black arrows) and cirrhosis/fibrosis (blue stain, collagen) are clearly seen in the PBS (untreated) and pGFP LCP treatment groups. The pTrap LCP– treated livers have normal healthy liver morphology and no detectable metastatic burden. Scale bars, 250 μm. Collagen quantification in liver section was recorded. All data are means ± SD. The P values of individual groups compared to corresponding untreated control are displayed in graph.
Fig. 5
Fig. 5. Decreased incidence of liver metastasis and enhanced T cell killing after pTrap LCP therapy
Mice were inoculated with 2 × 10⁶ CT-26(FL3) RFP/Luc cells into the cecum wall. Treatment, 10 mg (0.5 mg/kg) of pDNA, was administered intravenously through the tail vein on days 10, 12, and 14. Groups included PBS (untreated; n = 5) and pTrap LCP (10 mg every other day × 3; n = 5) with either anti-Lyt2.2 or isotype IgG control administrated on days 8 and 10 (400 mg, 20 mg/kg) intraperitoneally (IP). Inoculation and treatment schedule/dose and liver tumor mass on day 21 are shown above. Mice were administered 200 ml of luciferin (10 mg/ml) intraperitoneally. After 5 min, mice were euthanized, and livers were extracted, rinsed in PBS, and placed in a solution of luciferin (1 mg/ml). The bioluminescence images were recorded using IVIS Kinetic with Kodak camera. Quantification of tumor burden in the liver was performed with IVIS/Kodak software. Data were expressed as log-transformed mean, normalized ± SE. The P values of individual groups compared to corresponding untreated control are displayed in graph.
Fig. 6
Fig. 6. Decreased incidence of 4T1 liver metastasis and increased survival after pTrap LCP treatment
(A) Inoculation and treatment schedule and doses, as well as bioluminescent signal detection and tumor burden quantification 7 days after inoculation. Treatment groups included PBS (untreated; n = 5), pGFP LCP/anti-CD8 (n = 5), pTrap LCP/anti-CD8 (n = 5), and pTrap LCP/isotype IgG (n = 5). Data were expressed as log-transformed mean, normalized ± SE. The P values of individual groups compared to corresponding untreated control are displayed in graph. (B) Flow cytometry analysis of tumor burden and quantification on day 10 (n = 3 per group). Gating consists of GFP+ tumor cells (P3) versus non-GFP+ cells (P4). Data were expressed as mean, normalized ± SD. The P values of individual groups compared to corresponding untreated control are displayed in graph. FITC, fluorescein isothiocyanate. (C) Kaplan-Meier survival curve including all four treatment groups (n = 5 per group). Survival was determined by evaluating mouse weight, activity, and quality of life. The P values of individual groups compared to corresponding untreated control are displayed in graph.
Fig. 7
Fig. 7. Comparison of therapeutic strategies for reducing incidence of CRC (HT-29) liver metastasis
(A) The timeline at the top shows the inoculation and treatment schedule and dosing for the HT-29. Treatments were administered intravenously through the tail vein every other day on days 0 to 16. Treatment groups included PBS (untreated; n = 5), pGFP LCP [10 mg (0.5 mg/kg) of pDNA; n = 5], pTrap LCP [10 mg (0.5 mg/kg) of pDNA; n = 5], free CXCL12 trap protein [10 mg (0.5 mg/kg) of protein; n = 5], and AMD3100 (100 mg, 5.0 mg/kg; n = 5). (B) Tumor burden analysis and quantification on day 36 (n = 5 per group). Liver metastasis burden was quantified by resection and weighing of tumor nodules (in mg). The image shows a representative liver from each treatment group with metastatic burden shown, and white arrows indicate metastatic lesions. Survival was determined by evaluating mouse weight, activity, and quality of life. Data were expressed as individual data points with means ± SD. The P values of individual groups compared to corresponding untreated control are displayed in graph.
Fig. 8
Fig. 8. Toxicological analysis
(A) ALT, AST, creatinine, and BUN measurements and blood leukocyte cell counts 24 hours after the final treatment with PBS (untreated), 10 mg of pGFP LCP (every other day × 3), 10 mg of pTrap LCP (every other day × 3), or 20 mg of free CXCL12 trap protein (every other day × 3), in which mice were sacrificed on days 1, 7, and 14 after the final administration. All data are means ± SD from samples run in triplicate. The P values of individual groups compared to corresponding untreated control are displayed in graph. (B) Trichrome histology sections of different organs 24 hours after the final treatment with PBS (untreated), 10 mg of pGFP LCP (every other day × 3), 10 mg of pTrap LCP (every other day × 3), or 20 mg of free CXCL12 trap protein (every other day × 3), in which mice were sacrificed on days 1, 7, and 14 after the final administration. All trichrome histology sections show no toxicity in any major organ including heart, lung, spleen, kidney, and liver. Scale bar, 100 μm.

Similar articles

Cited by

References

    1. American Cancer Society. Cancer Facts and Figures 2012. American Cancer Society Inc.; 2012. pp. 25–26.
    1. Schima W, Kulinna C, Langenberger H, Ba-Ssalamah A. Liver metastases of colorectal cancer: US, CT or MR? Cancer Imaging. 2005;5:S149–S156. - PMC - PubMed
    1. Ismaili N. Treatment of colorectal liver metastases. World J Surg Oncol. 2011;9:154. - PMC - PubMed
    1. Zeelenberg IS, Stalle L Ruuls-Van, Roos E. The chemokine receptor CXCR4 is required for outgrowth of colon carcinoma micrometastases. Cancer Res. 2003;63:3833–3839. - PubMed
    1. Kucia M, Reca R, Miekus K, Wanzeck J, Wojakowski W, Janowska-Wieczorek A, Ratajczak J, Ratajczak MZ. Trafficking of normal stem cells and metastasis of cancer stem cells involve similar mechanisms: Pivotal role of the SDF-1-CXCR4 axis. Stem Cells. 2005;23:879–894. - PubMed

Publication types

MeSH terms

LinkOut - more resources