MR Spectroscopy in Prostate Cancer: New Algorithms to Optimize Metabolite Quantification
- PMID: 27832096
- PMCID: PMC5104319
- DOI: 10.1371/journal.pone.0165730
MR Spectroscopy in Prostate Cancer: New Algorithms to Optimize Metabolite Quantification
Abstract
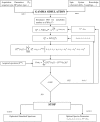
Prostate cancer (PCa) is the most common non-cutaneous cancer in male subjects and the second leading cause of cancer-related death in developed countries. The necessity of a non-invasive technique for the diagnosis of PCa in early stage has grown through years. Proton magnetic resonance spectroscopy (1H-MRS) and proton magnetic resonance spectroscopy imaging (1H-MRSI) are advanced magnetic resonance techniques that can mark the presence of metabolites such as citrate, choline, creatine and polyamines in a selected voxel, or in an array of voxels (in MRSI) inside prostatic tissue. Abundance or lack of these metabolites can discriminate between pathological and healthy tissue. Although the use of magnetic resonance spectroscopy (MRS) is well established in brain and liver with dedicated software for spectral analysis, quantification of metabolites in prostate can be very difficult to achieve, due to poor signal to noise ratio and strong J-coupling of the citrate. The aim of this work is to develop a software prototype for automatic quantification of citrate, choline and creatine in prostate. Its core is an original fitting routine that makes use of a fixed step gradient descent minimization algorithm (FSGD) and MRS simulations developed with the GAMMA libraries in C++. The accurate simulation of the citrate spin systems allows to predict the correct J-modulation under different NMR sequences and under different coupling parameters. The accuracy of the quantifications was tested on measurements performed on a Philips Ingenia 3T scanner using homemade phantoms. Some acquisitions in healthy volunteers have been also carried out to test the software performance in vivo.
Conflict of interest statement
The authors have declared that no competing interests exist.
Figures


Similar articles
-
A phase and frequency alignment protocol for 1H MRSI data of the prostate.NMR Biomed. 2012 May;25(5):755-65. doi: 10.1002/nbm.1790. Epub 2011 Sep 26. NMR Biomed. 2012. PMID: 21953616
-
Three-dimensional proton magnetic resonance spectroscopic imaging with and without an endorectal coil: a prostate phantom study.Acta Radiol. 2015 Nov;56(11):1342-9. doi: 10.1177/0284185114556704. Epub 2014 Oct 27. Acta Radiol. 2015. PMID: 25348479
-
Combined morphological, [1H]-MR spectroscopic and contrast-enhanced imaging of human prostate cancer with a 3-Tesla scanner: preliminary experience.Radiol Med. 2008 Aug;113(5):670-88. doi: 10.1007/s11547-008-0271-8. Epub 2008 May 20. Radiol Med. 2008. PMID: 18493829 English, Italian.
-
Proton MR spectroscopy of the prostate.Eur J Radiol. 2007 Sep;63(3):351-60. doi: 10.1016/j.ejrad.2007.06.024. Epub 2007 Aug 20. Eur J Radiol. 2007. PMID: 17709223 Review.
-
Metabolite ratios in 1H MR spectroscopic imaging of the prostate.Magn Reson Med. 2015 Jan;73(1):1-12. doi: 10.1002/mrm.25122. Epub 2014 Jan 31. Magn Reson Med. 2015. PMID: 24488656 Review.
Cited by
-
Omega-3 Fatty Acids Survey in Men under Active Surveillance for Prostate Cancer: from Intake to Prostate Tissue Level.Nutrients. 2019 Jul 16;11(7):1616. doi: 10.3390/nu11071616. Nutrients. 2019. PMID: 31315273 Free PMC article.
-
Three-dimensional nuclear magnetic resonance spectroscopy: a complementary tool to multiparametric magnetic resonance imaging in the identification of aggressive prostate cancer at 3.0T.Quant Imaging Med Surg. 2021 Aug;11(8):3749-3766. doi: 10.21037/qims-21-331. Quant Imaging Med Surg. 2021. PMID: 34341747 Free PMC article.
-
Evaluation of Proton MR Spectroscopy for the Study of the Tongue Tissue in Healthy Subjects and Patients With Tongue Squamous Cell Carcinoma: Preliminary Findings.Front Oral Health. 2022 Jul 18;3:912803. doi: 10.3389/froh.2022.912803. eCollection 2022. Front Oral Health. 2022. PMID: 35924279 Free PMC article.
References
-
- Siegel R, Naishadham D, Jemal A. Cancer statistics, 2012. CA Cancer J Clin. 2012. February;62(1):10–29. doi: 10.3322/caac.20138 - DOI - PubMed
-
- Ward JF, Slezak JM, Blute ML, Bergstralh EJ, Zincke H. Radical prostatectomy for clinically advanced (cT3) prostate cancer since the advent of prostate-specific antigen testing: 15-year outcome. BJU Int. 2005. April;95(6):751–6. doi: 10.1111/j.1464-410X.2005.05394.x - DOI - PubMed
-
- Mullerad M, Hricak H, Kuroiwa K, Pucar D, Chen H-N, Kattan MW, et al. Comparison of endorectal magnetic resonance imaging, guided prostate biopsy and digital rectal examination in the preoperative anatomical localization of prostate cancer. J Urol. 2005. December;174(6):2158–63. doi: 10.1097/01.ju.0000181224.95276.82 - DOI - PubMed
-
- Ouzzane A, Renard-Penna R, Marliere F, Mozer P, Olivier J, Barkatz J, et al. Magnetic Resonance Imaging Targeted Biopsy Improves Selection of Patients Considered for Active Surveillance for Clinically Low Risk Prostate Cancer Based on Systematic Biopsies. J Urol. 2015. August;194(2):350–6. doi: 10.1016/j.juro.2015.02.2938 - DOI - PubMed
-
- Heidenreich A, Bastian PJ, Bellmunt J, Bolla M, Joniau S, van der Kwast T, et al. EAU guidelines on prostate cancer. part 1: screening, diagnosis, and local treatment with curative intent-update 2013. Eur Urol. 2014. January;65(1):124–37. doi: 10.1016/j.eururo.2013.09.046 - DOI - PubMed
MeSH terms
Substances
LinkOut - more resources
Full Text Sources
Other Literature Sources
Medical

